San Antonio Economic Indicators

October 27, 2022
The San Antonio economy grew in September. The business-cycle index continued to expand as unemployment ticked down, employment picked up and wages increased slightly. Median home prices stabilized, while dining out broadened with respect to prepandemic habits.
Business-cycle index
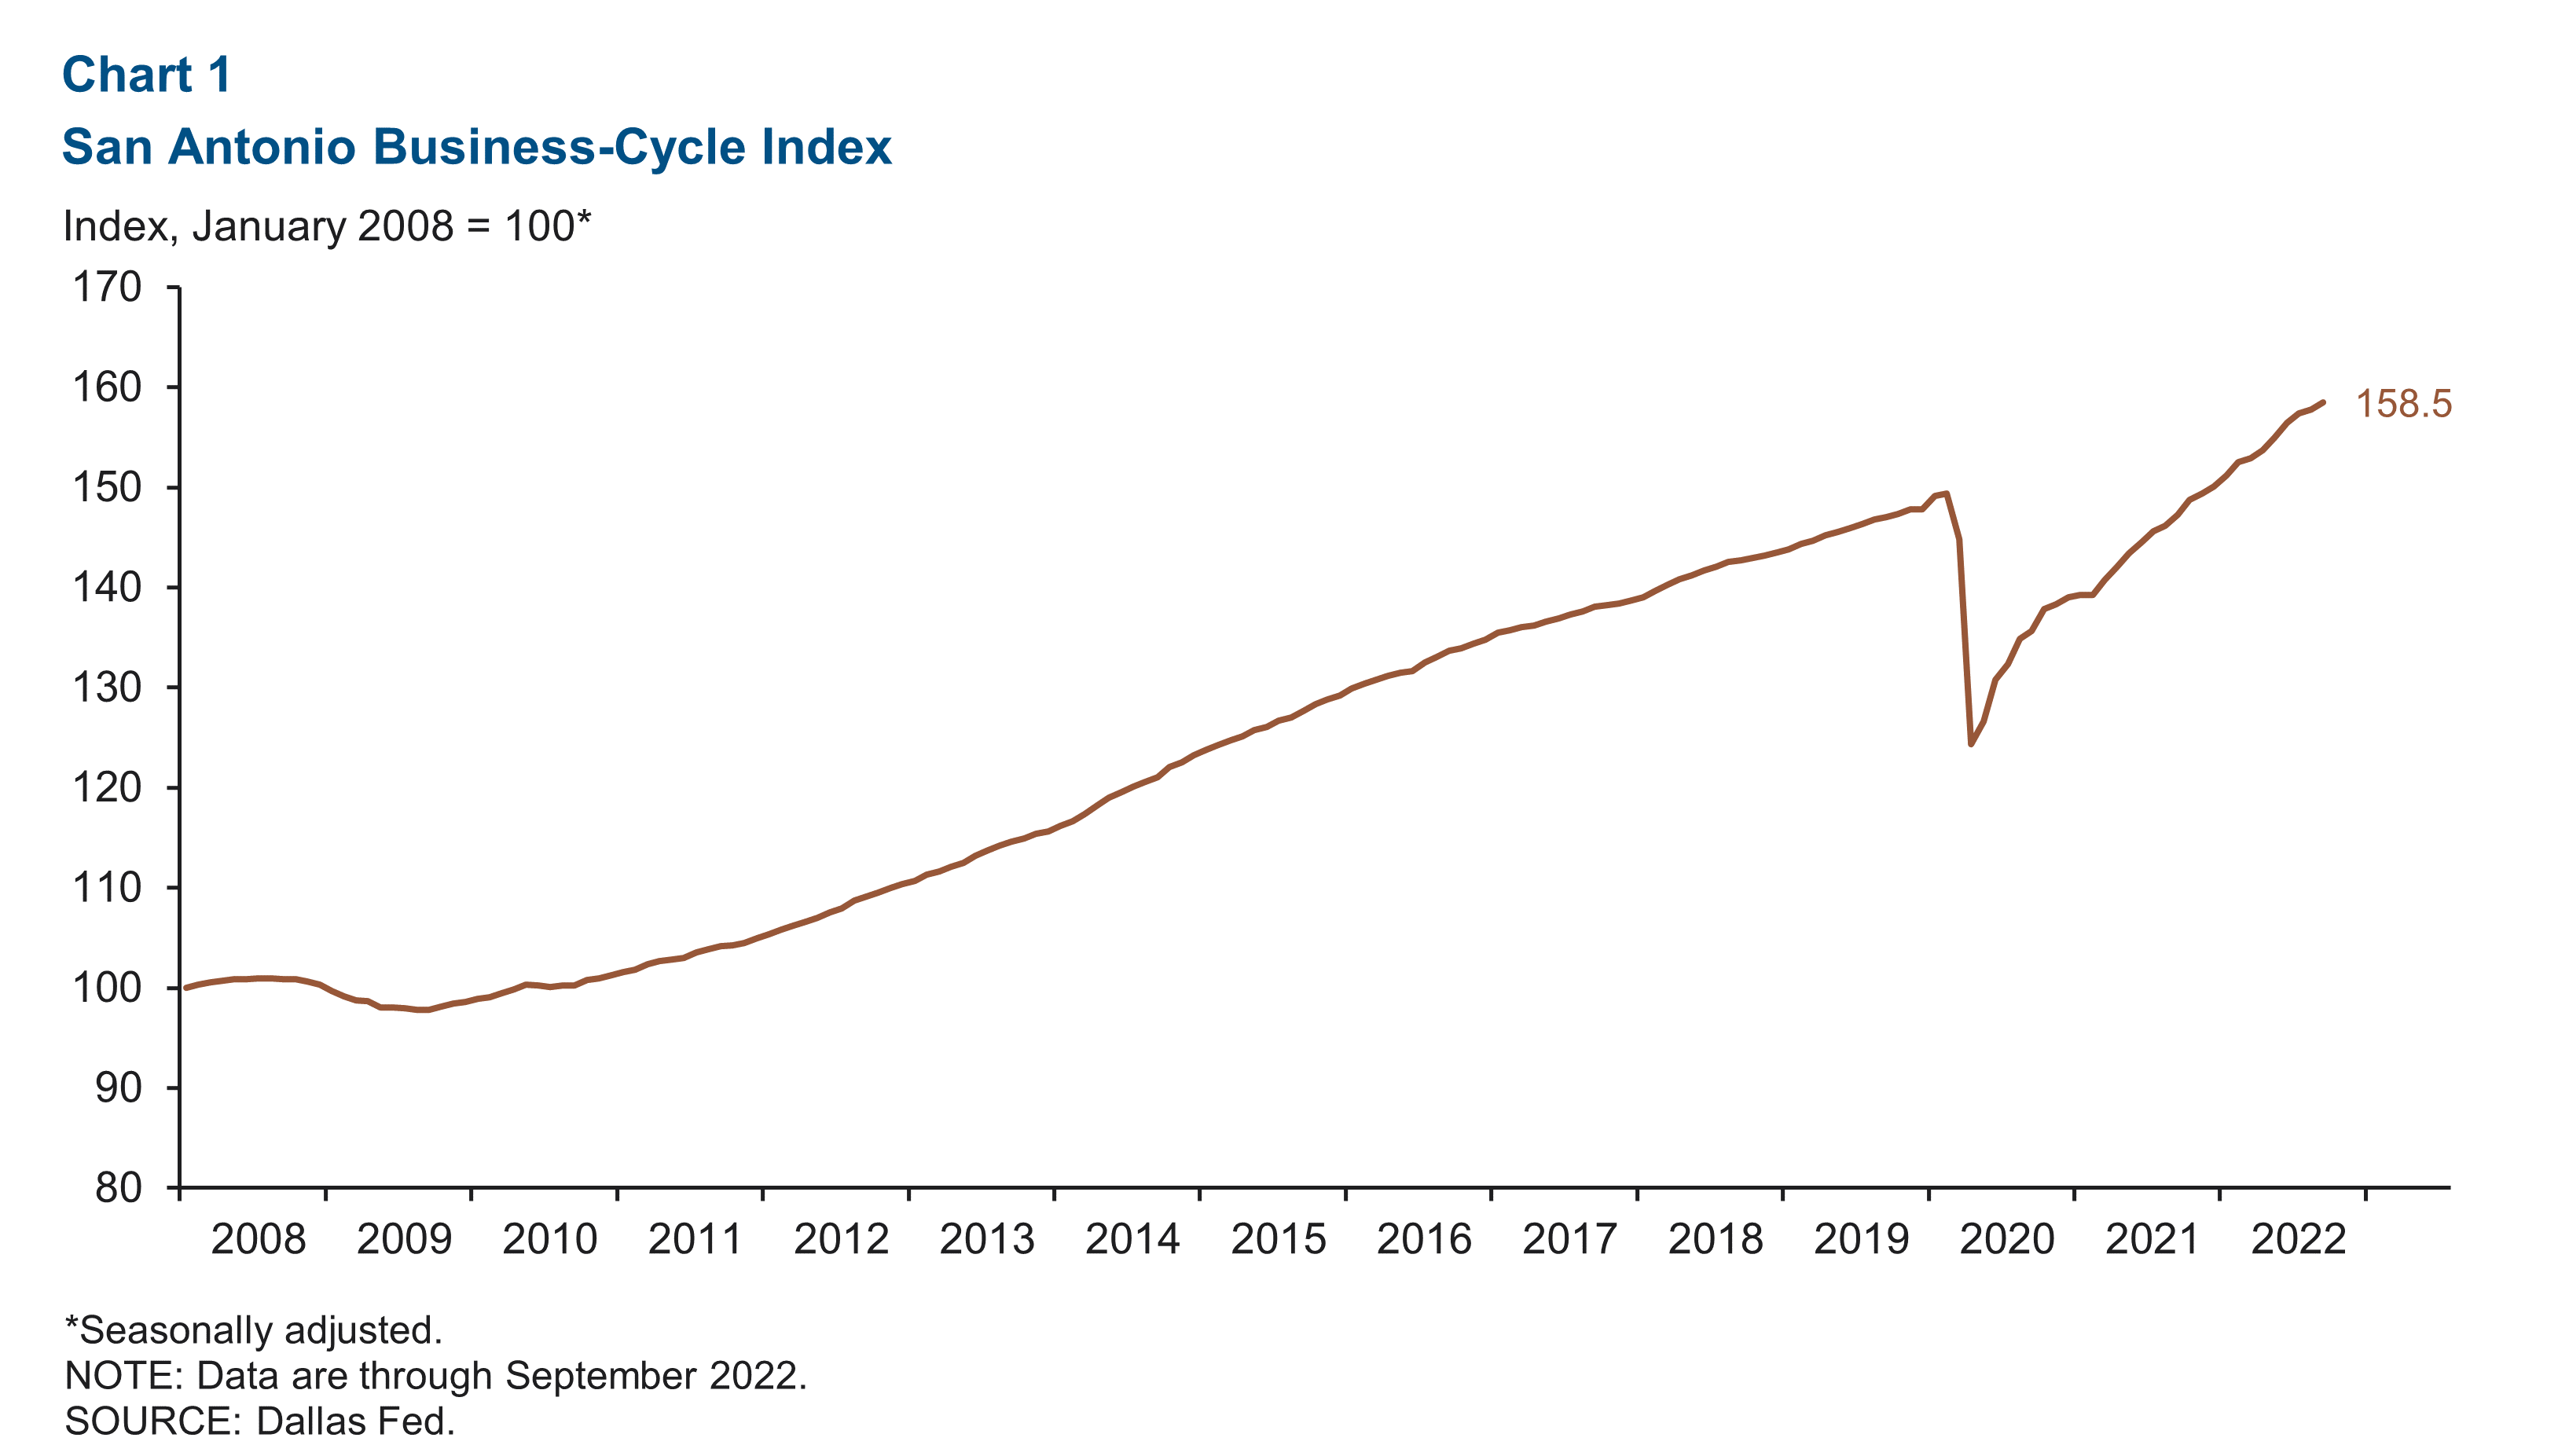
The San Antonio Business-Cycle Index —a broad measure of economic activity in the metro—grew at an annualized rate of 5.7 percent in September, faster than August’s 2.5 percent growth (Chart 1).
Labor market
Unemployment rate dips in September
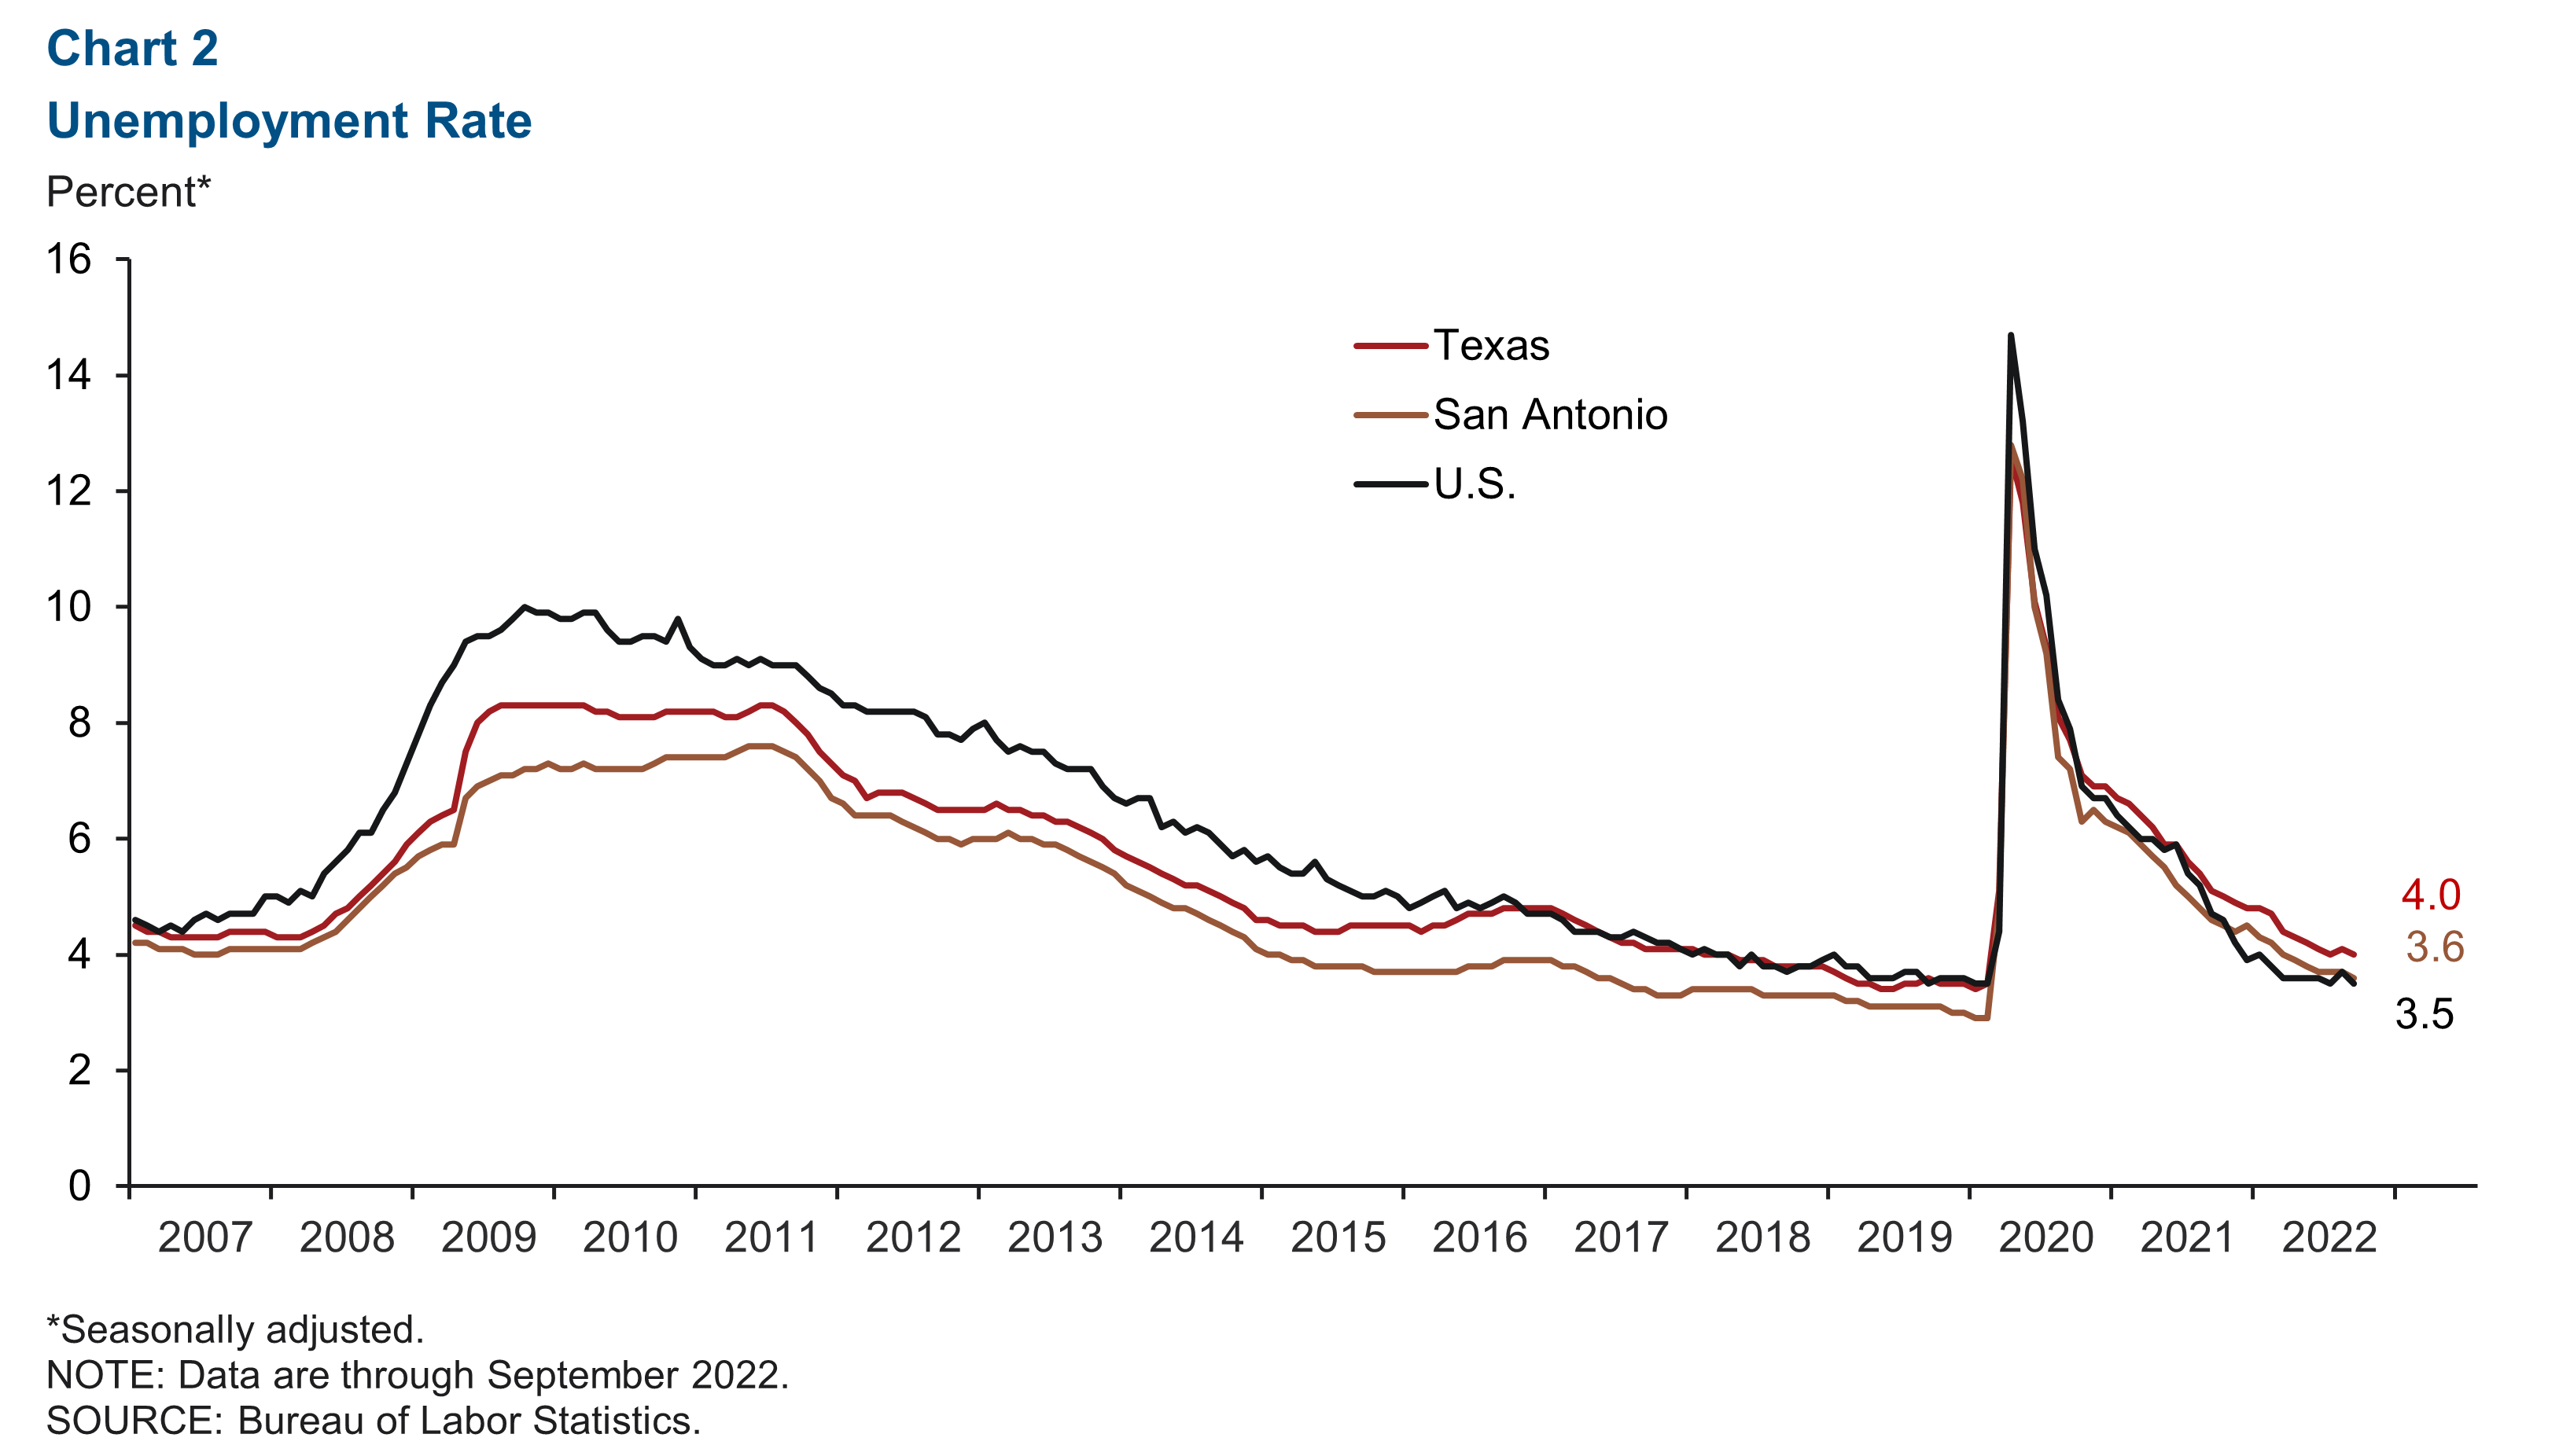
The San Antonio unemployment rate declined to 3.6 percent in September from 3.7 in August (Chart 2). The metro’s unemployment rate is higher than the U.S. rate of 3.5 percent but below the state rate of 4.0 percent. Meanwhile, the San Antonio labor force grew at a 4.0 percent annualized rate.
Most sectors see job gains
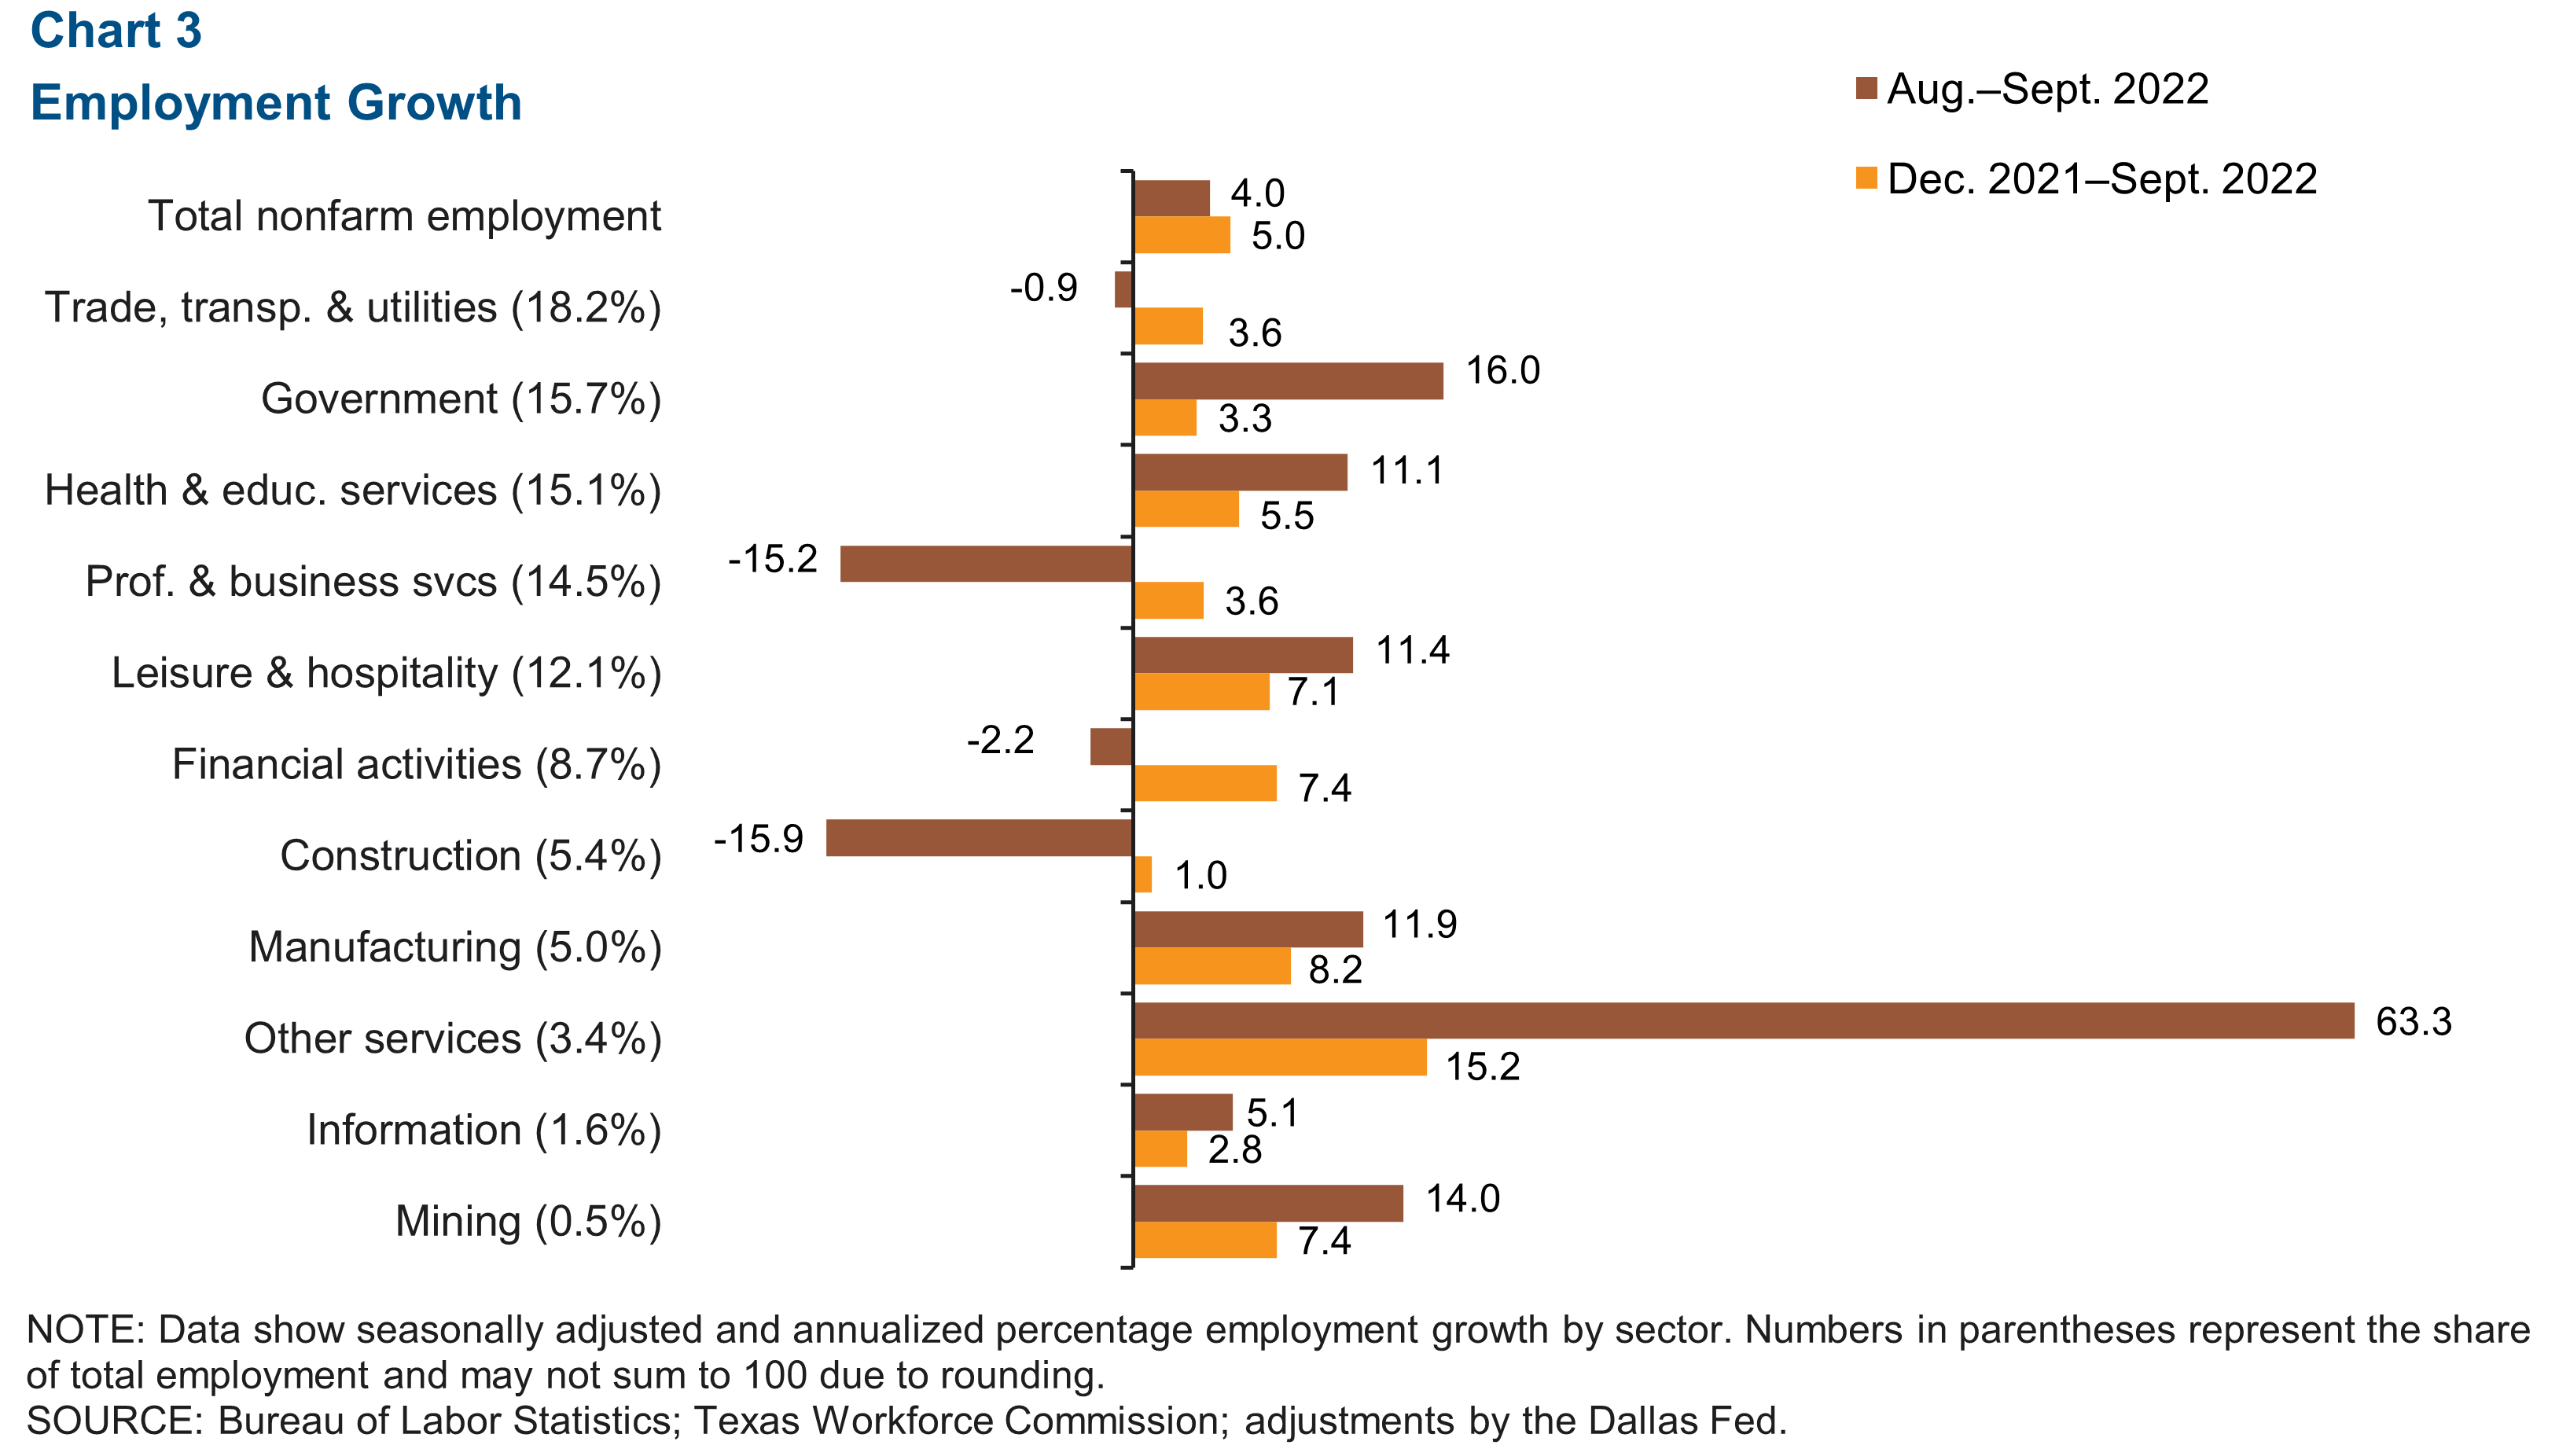
San Antonio payrolls grew 4.0 percent from August to September (3,643 jobs) (Chart 3). Of the individual sectors, “other services” grew the most at an annualized 63.3 percent (1,678 jobs), followed by government at 16.0 percent (2,181). Other services includes repair and maintenance, personal and laundry services, religious organizations, etc. Construction declined an annualized 15.9 percent (861 jobs), while professional and business services fell 15.2 percent (2,198). Since the depths of the pandemic in April 2020, San Antonio has gained approximately 174,679 jobs and remains above prepandemic employment.
Hourly wages rise in September
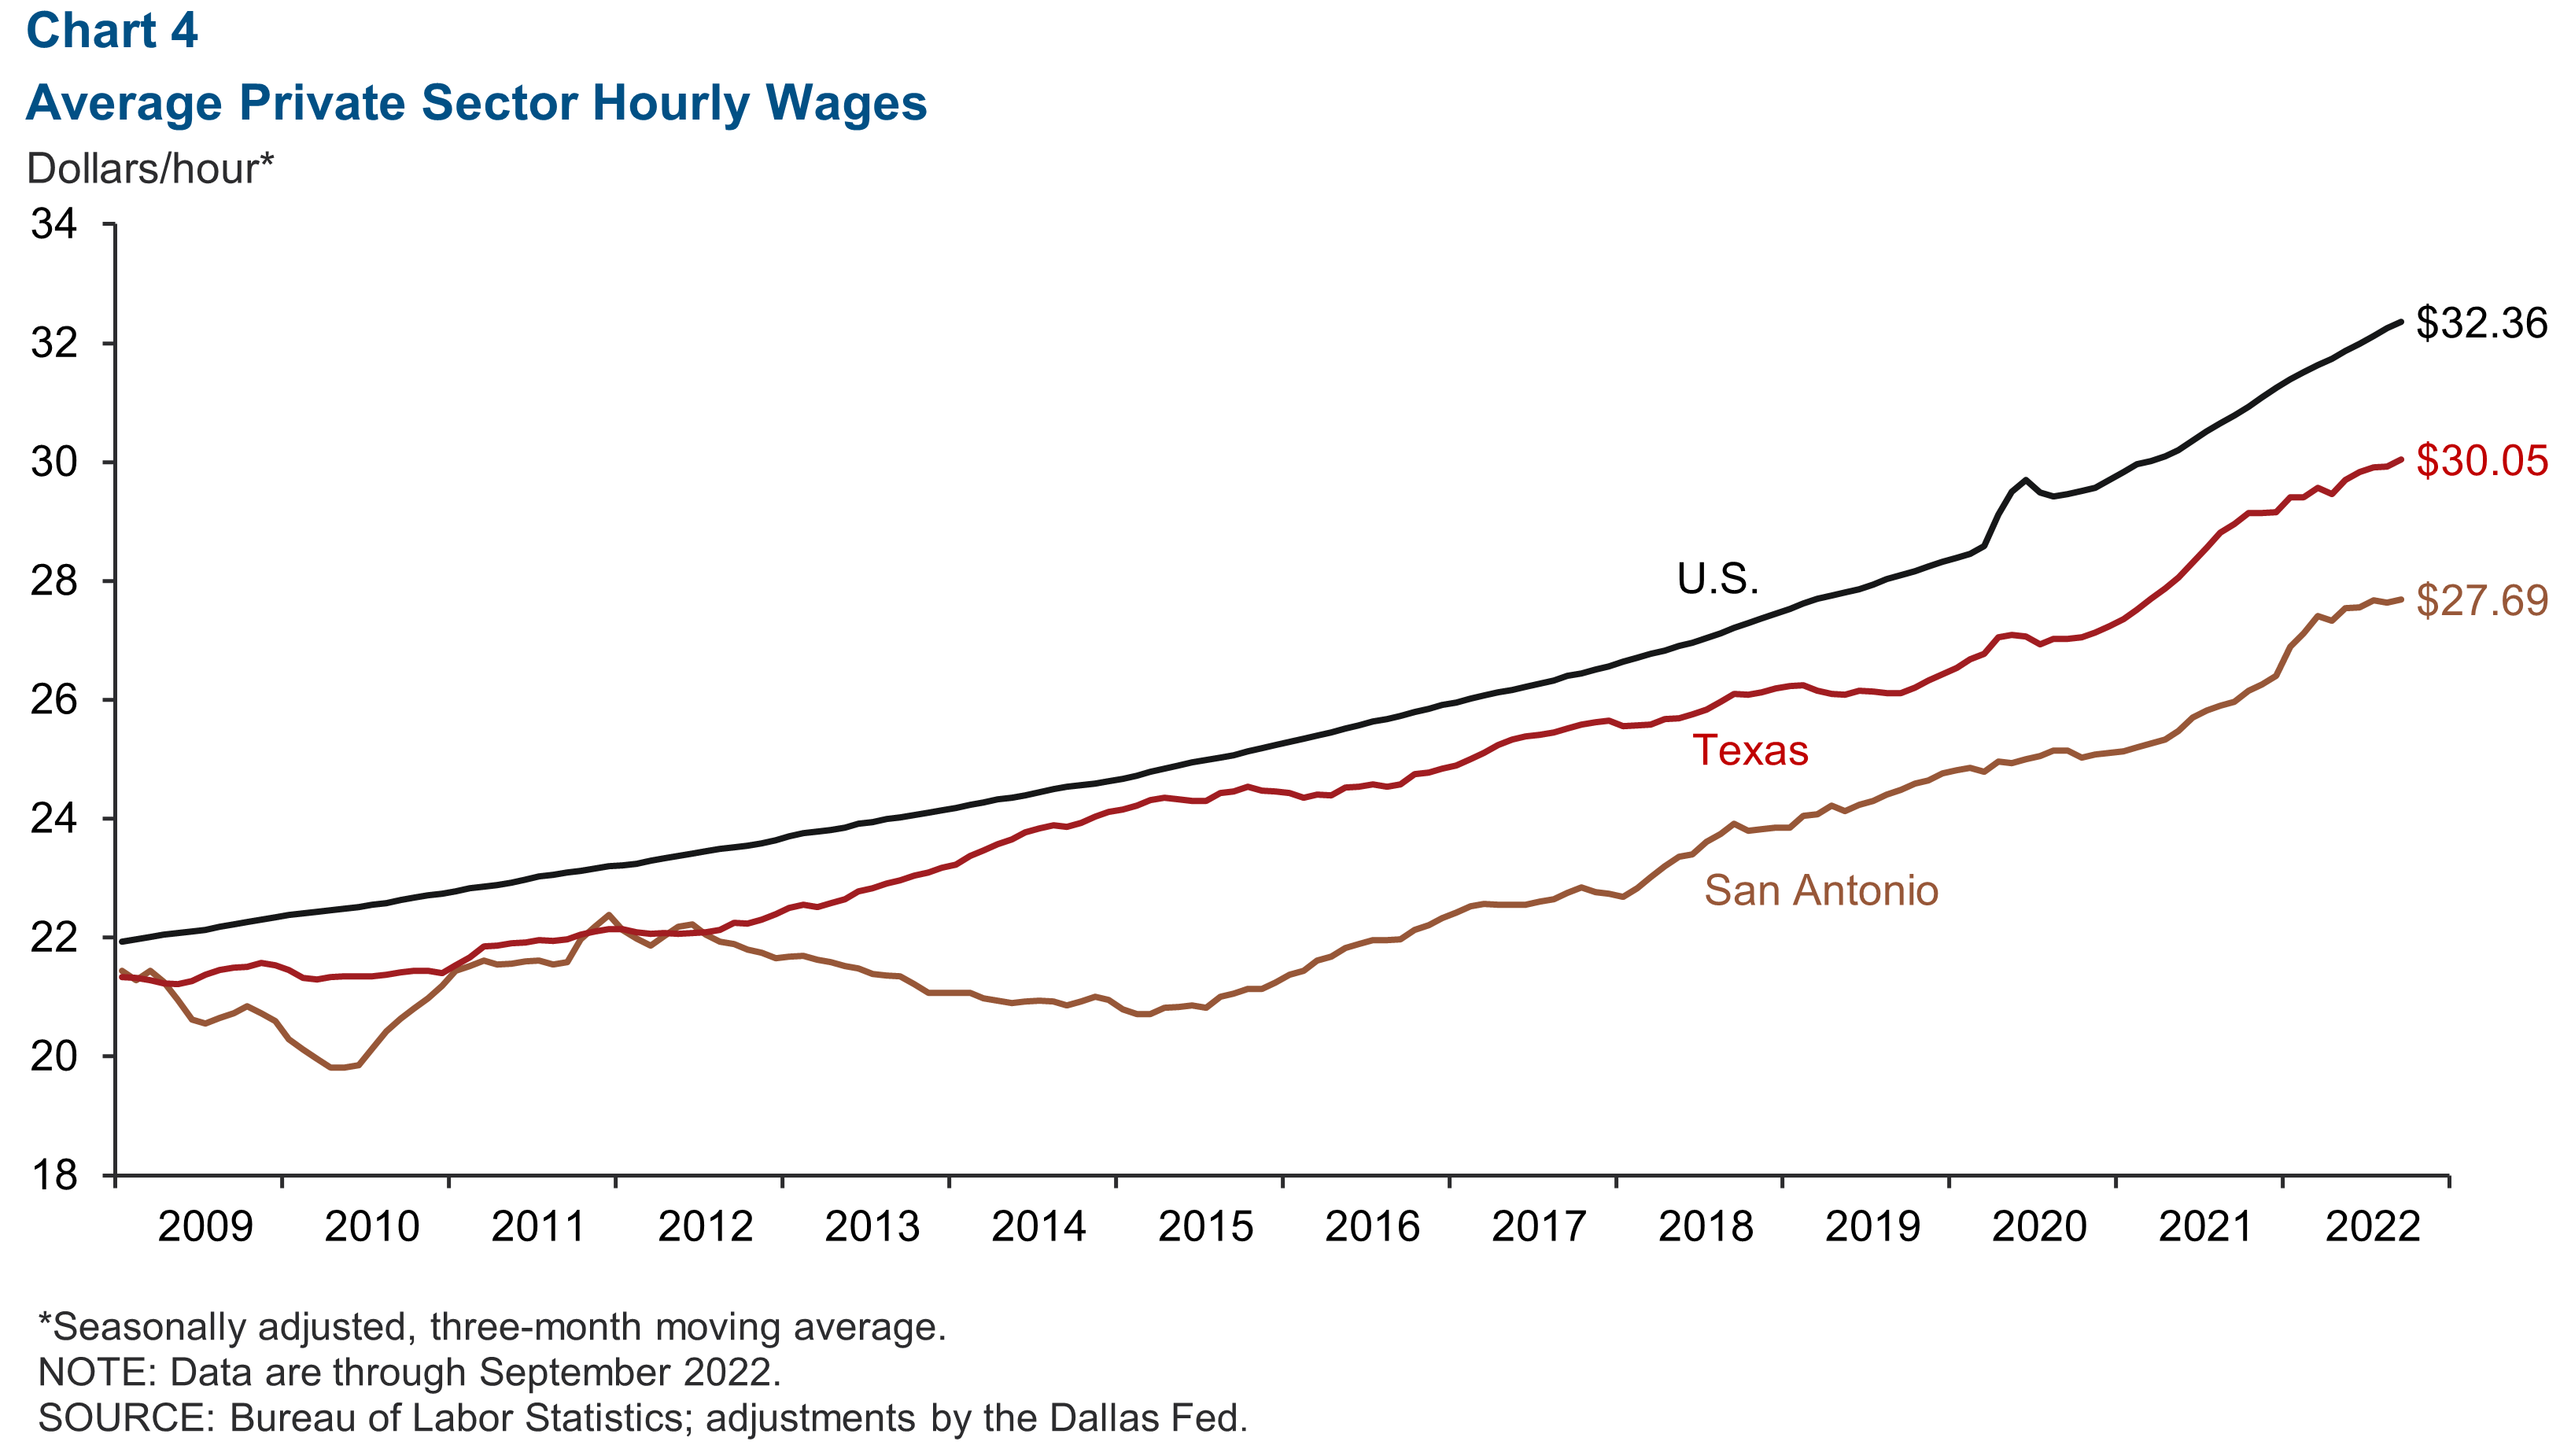
San Antonio wages grew an annualized 2.6 percent in September. The three-month moving average of hourly wages rose to $27.69, remaining below the state average of $30.05 and the national average of $32.36 (Chart 4). Over the 12 months through September, San Antonio wages grew 6.6 percent, outpacing gains of 3.8 percent in Texas and 5.1 percent in the U.S.
Home prices
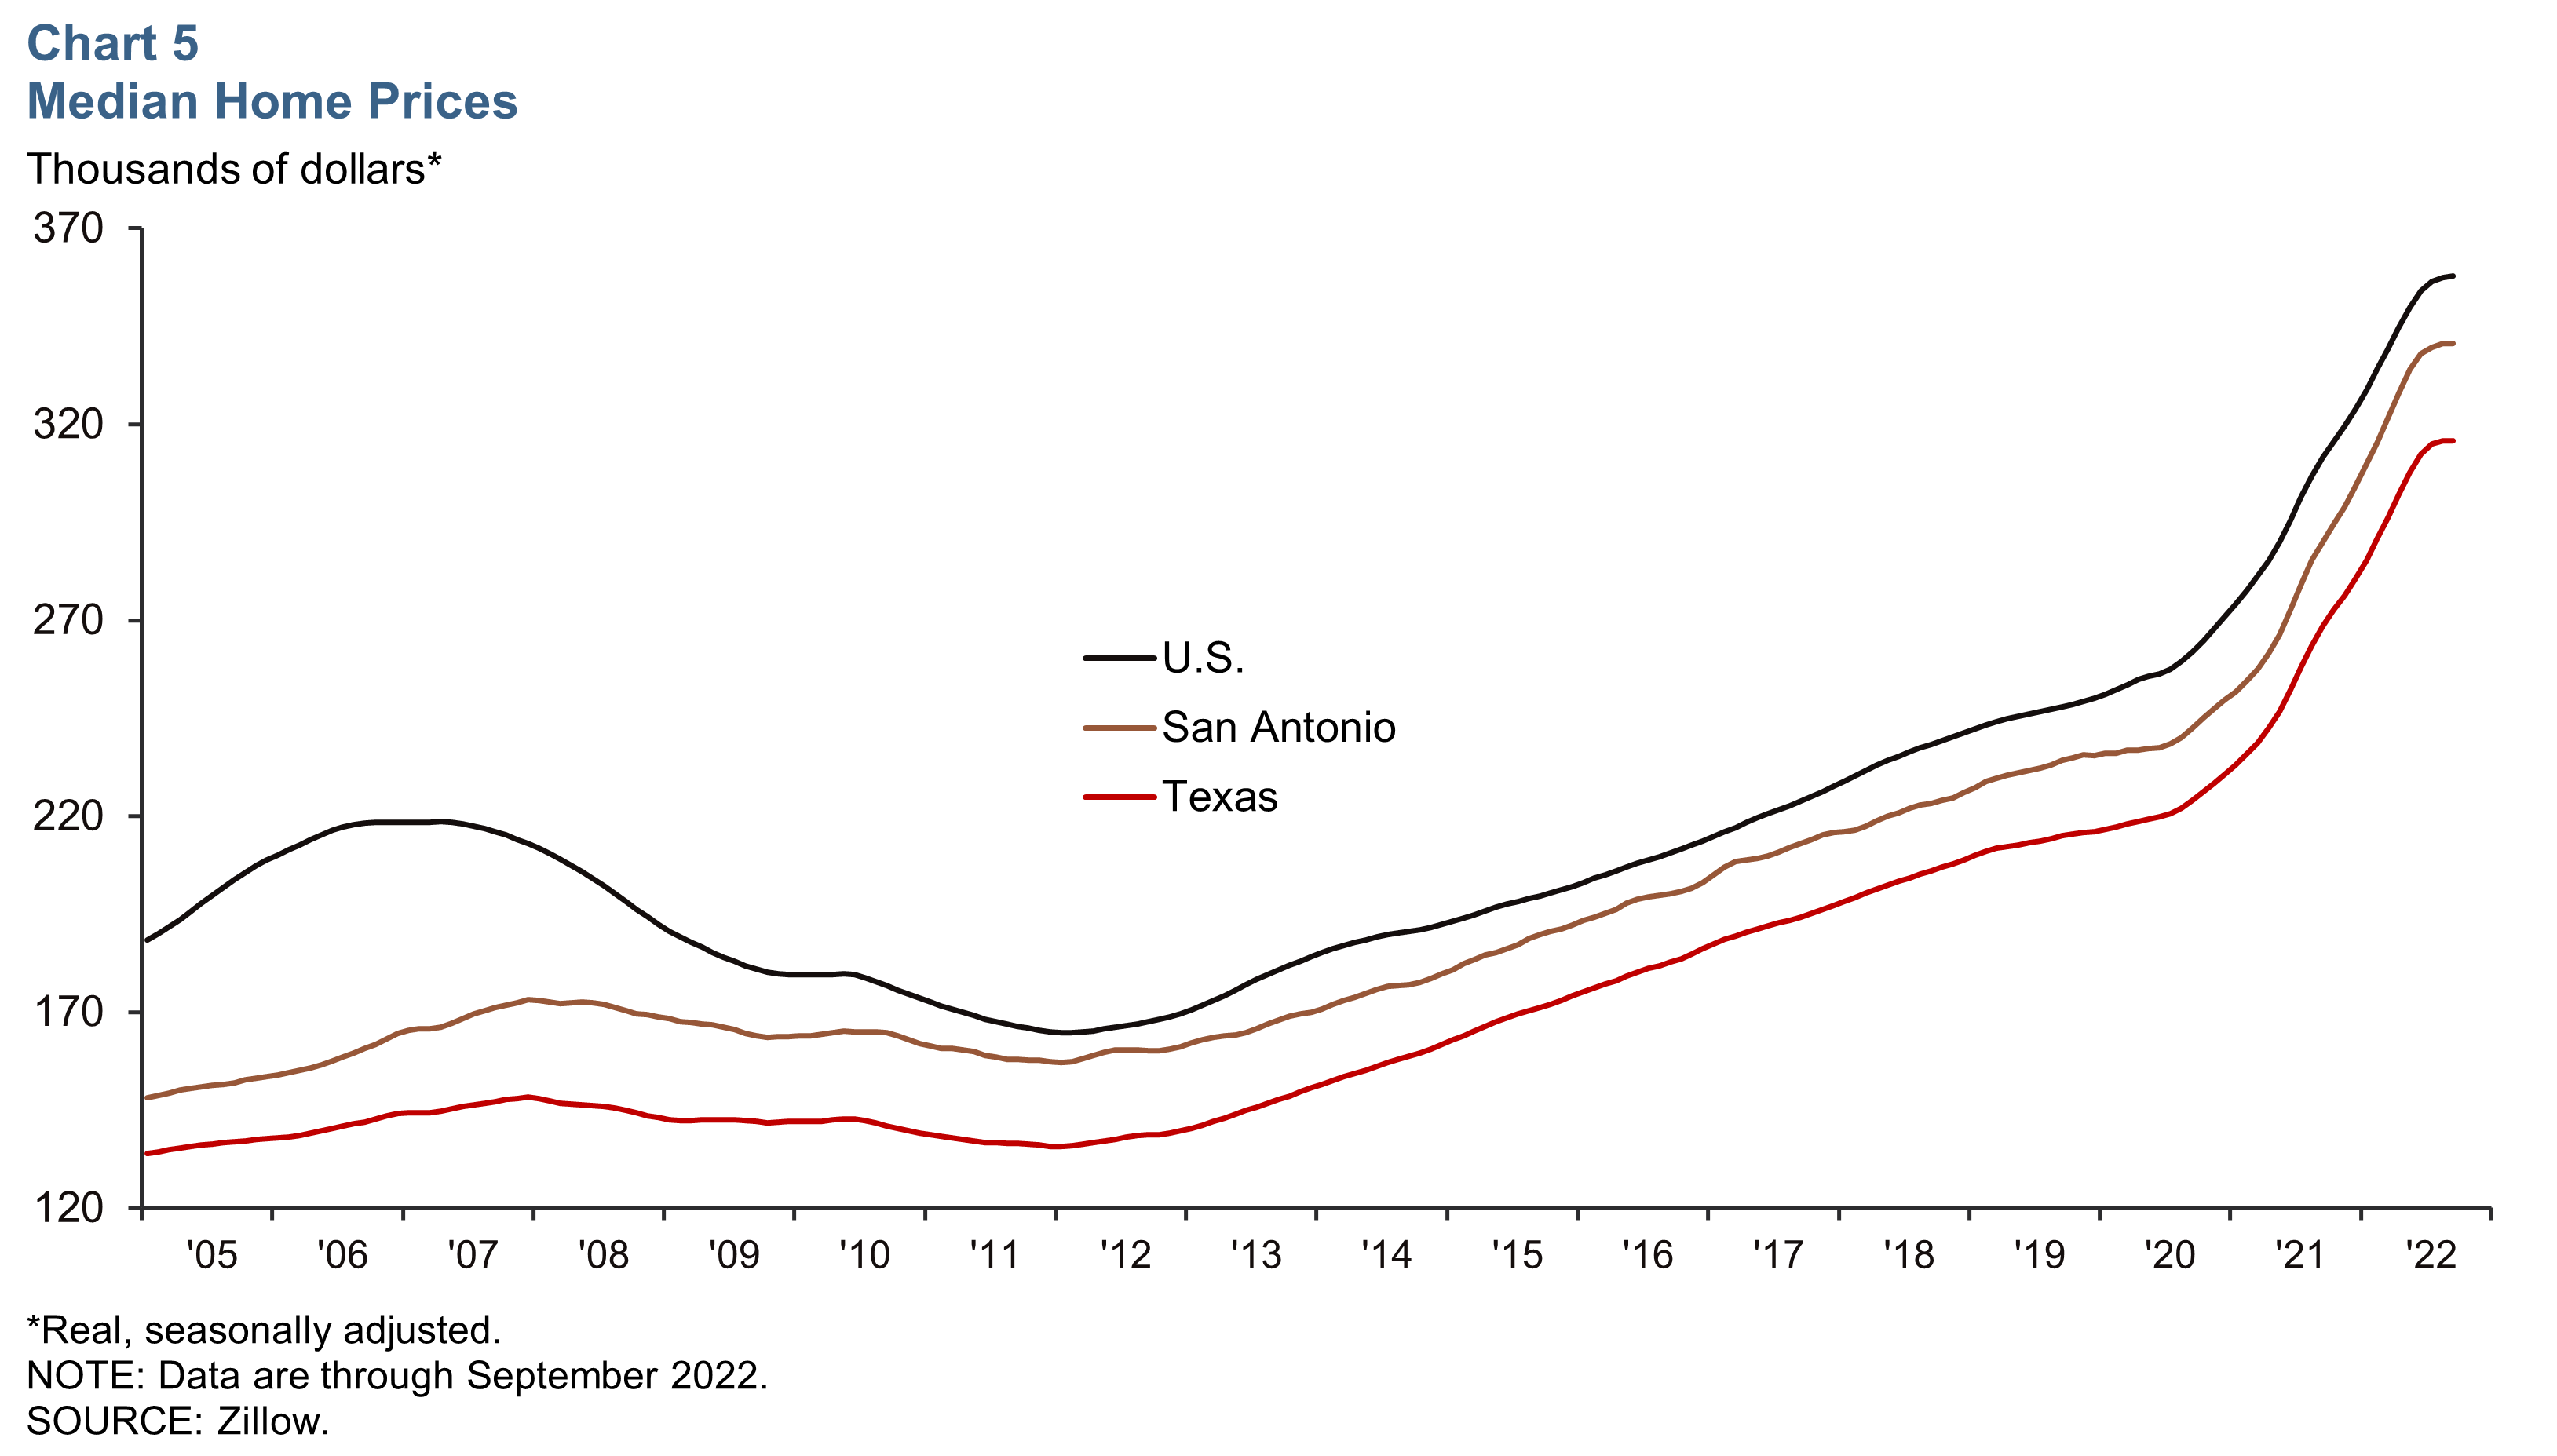
As interest rates rise, home sales are cooling, housing inventory is recovering and median home prices are stabilizing across the metro, state and nation. From August to September, San Antonio’s median home price grew an annualized 1.2 percent, slower than the prior month’s 3.6 percent gain (Chart 5). As of Sept. 30, the seasonally adjusted median home price in San Antonio was $340,674.
Dining out
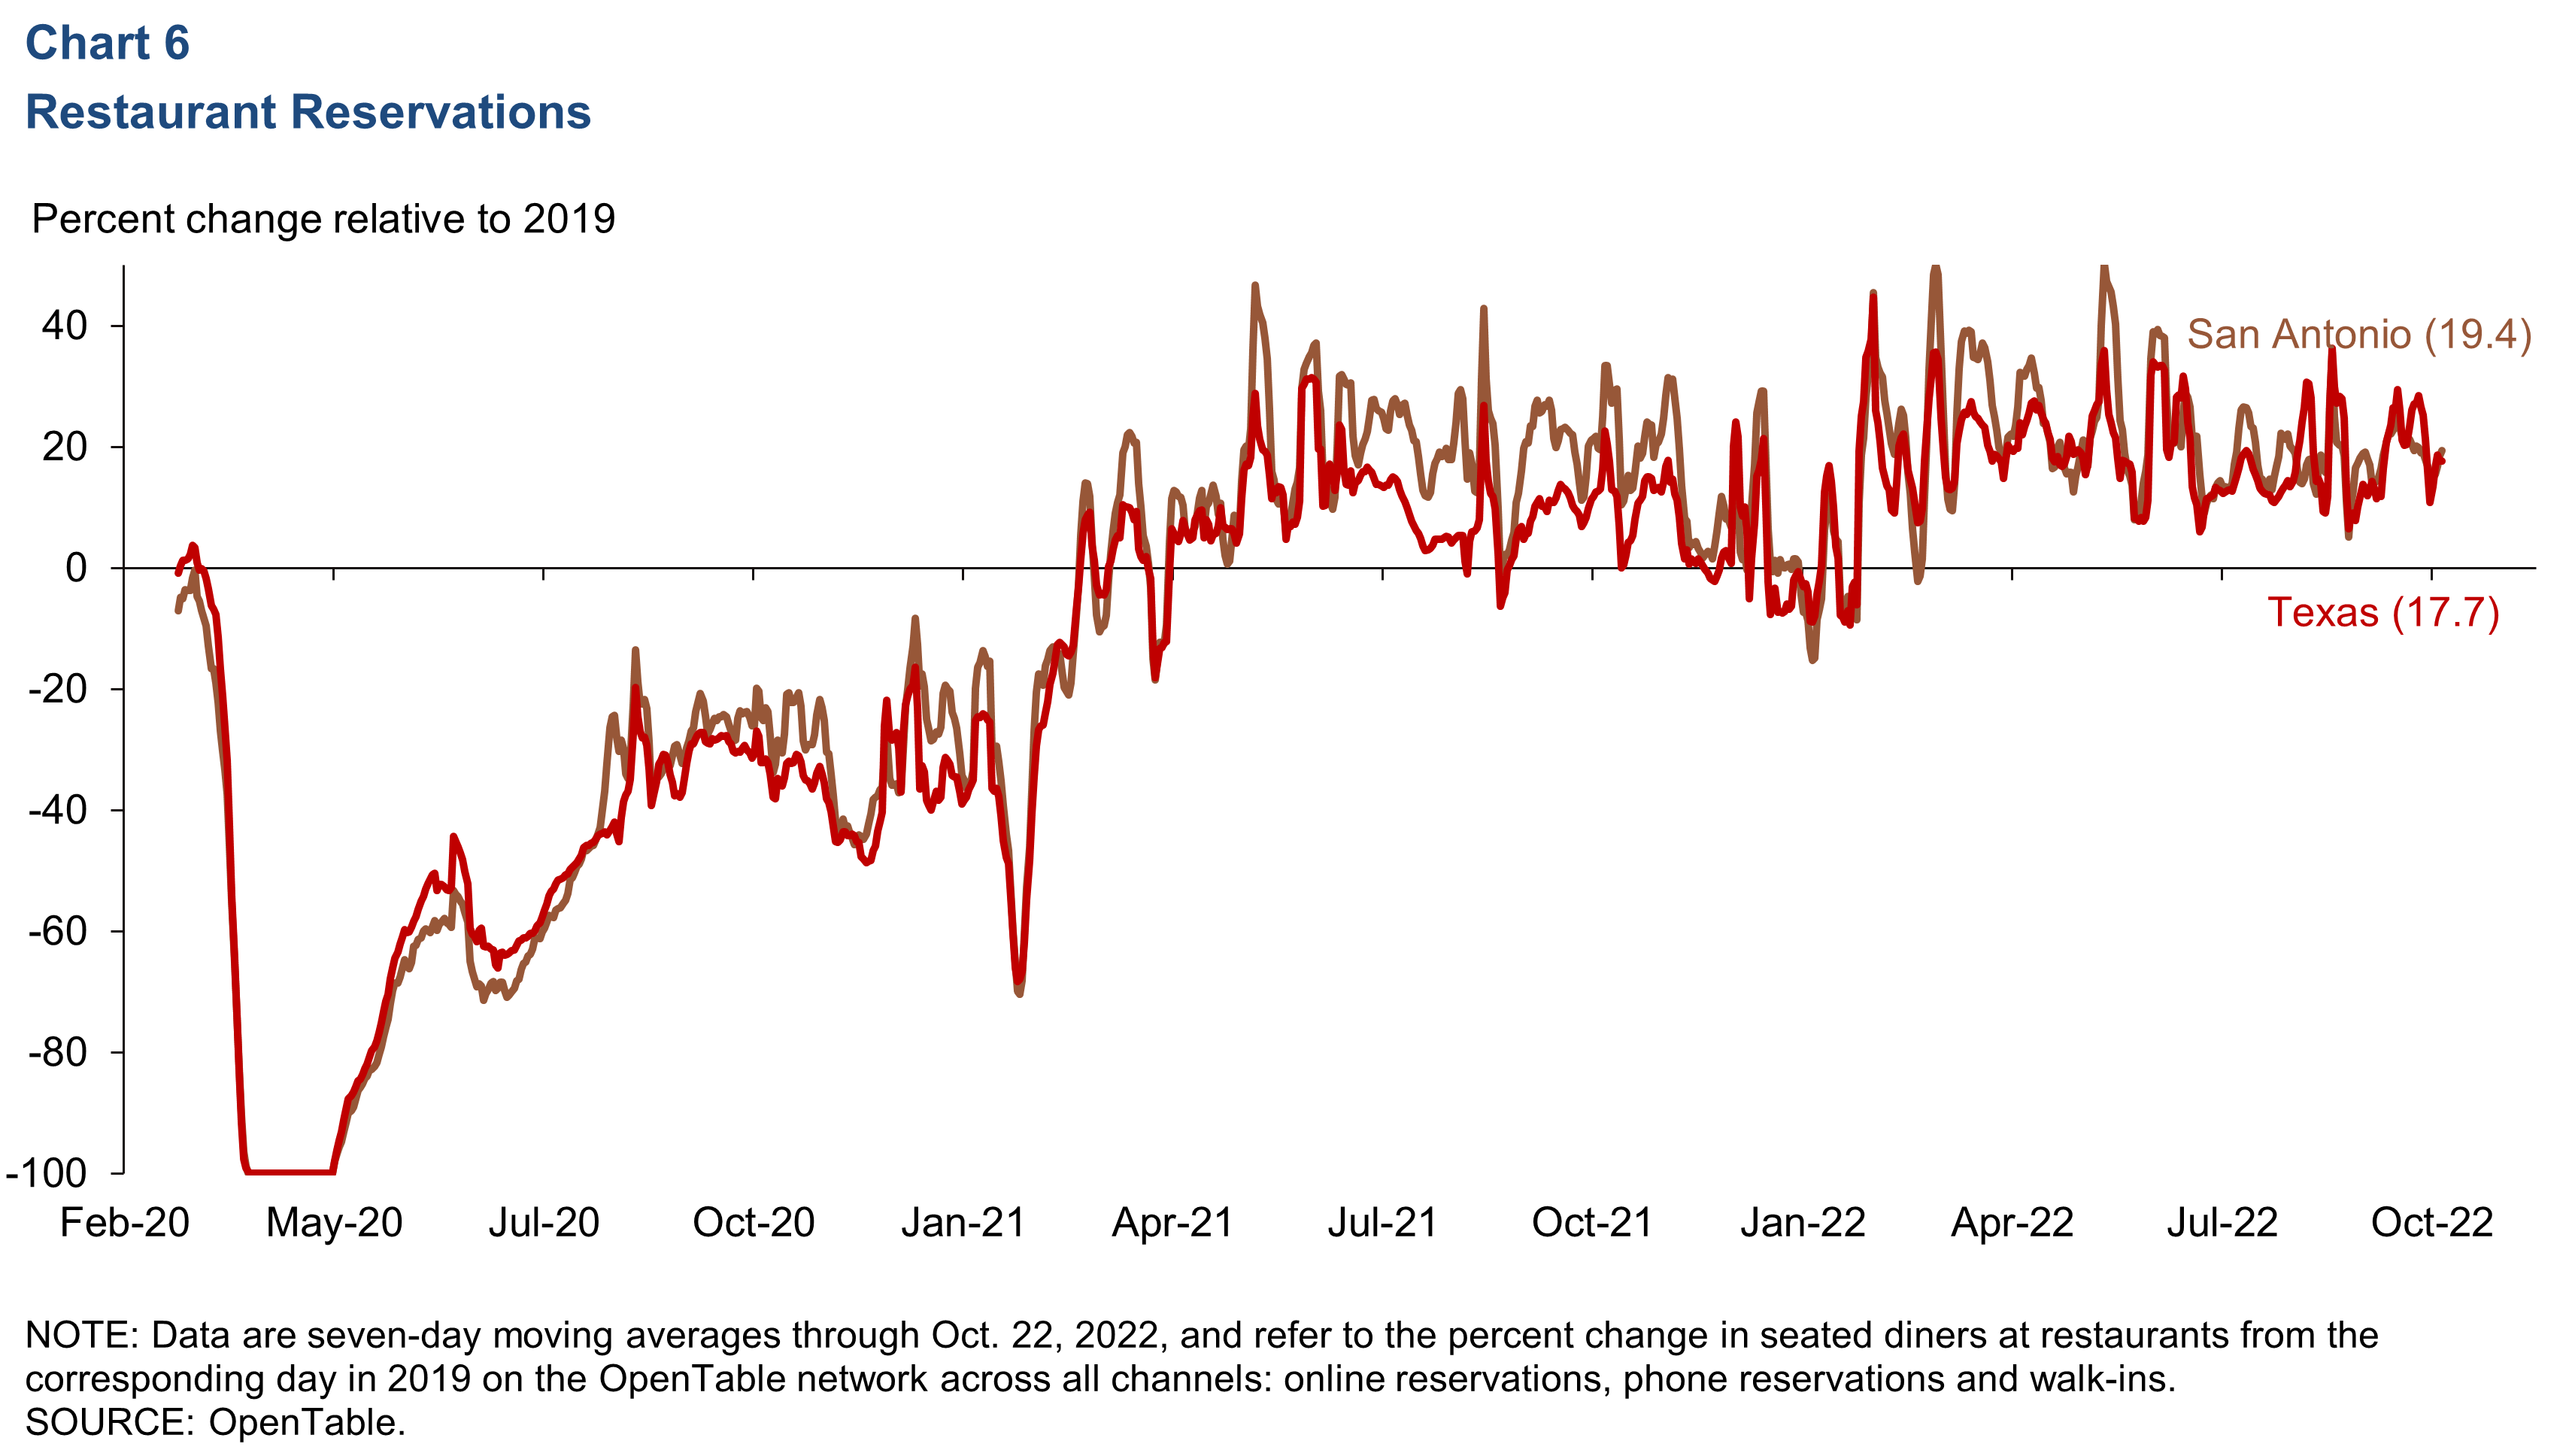
As of Oct. 22, dining out in San Antonio was 19.4 percent higher than in October 2019 and above the 13.9 percent recorded on Sept. 22, 2022 (Chart 6). Diners in San Antonio continue to eat out at a slightly higher rate than those in the rest of the state.
NOTES: The San Antonio payroll employment data and corresponding chart (Chart 3) were updated August 4, 2022. Data may not match previously published numbers due to revisions.
About San Antonio Economic Indicators
Questions or suggestions can be addressed to Vee Kalkunte at Prithvi.Kalkunte@dal.frb.org. San Antonio Economic Indicators is published every month during the week after state and metro employment data are released.