San Antonio Economic Indicators

January 25, 2023
| San Antonio economy dashboard (December 2022) | |||
| Job growth (annualized) Sept.–Dec. '22 |
Unemployment rate |
Avg. hourly earnings |
Avg. hourly earnings growth y/y |
| 3.2% | 3.6% | $27.88 | 5.5% |
San Antonio job growth declined in December, while the unemployment rate was unchanged. Restaurant spending and wages increased. In contrast, the business-cycle index declined slightly, and home sales continued to fall.
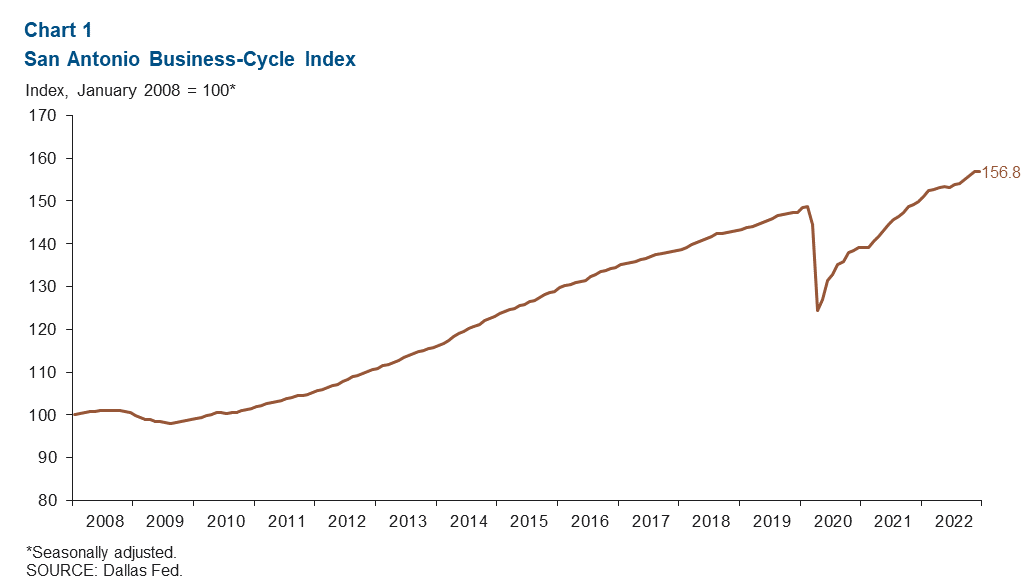
Business-cycle index
The San Antonio Business-Cycle Index—a broad measure of economic activity in the metro—declined slightly, registering a 7.1 annualized growth rate in December (Chart 1).
Labor market
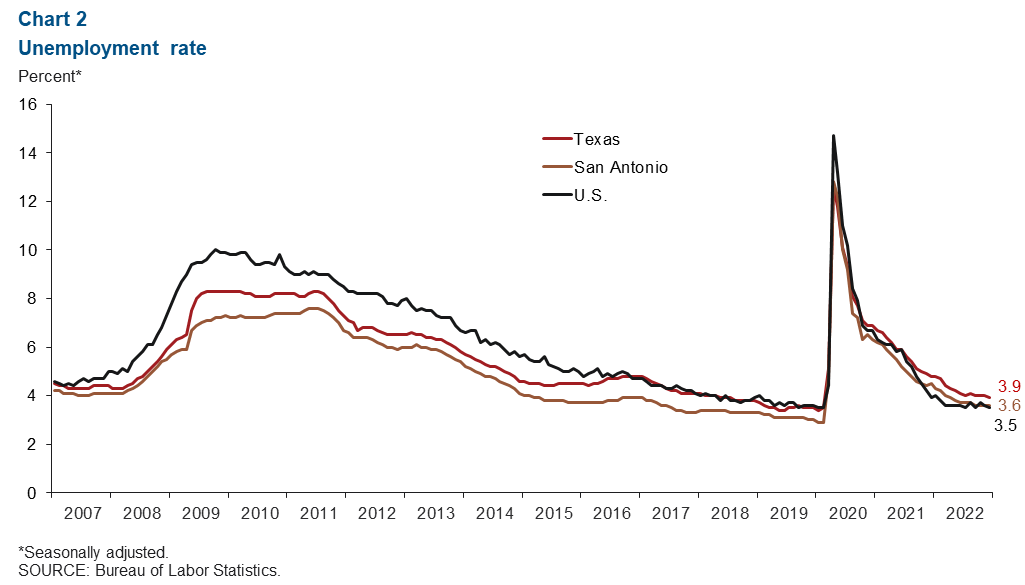
Unemployment rate steady
San Antonio’s unemployment rate remained at 3.6 percent in December (Chart 2). The metro’s unemployment rate is greater than the U.S. rate of 3.5 percent but less than the state rate of 3.9 percent. In December, San Antonio’s labor force declined an annualized 1.7 percent.
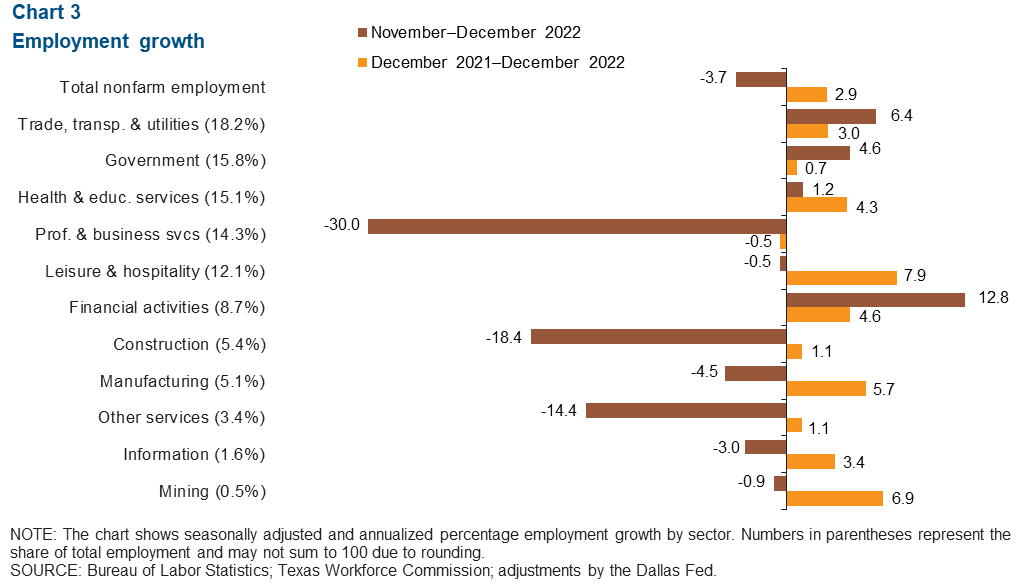
Jobs decline during holiday season
San Antonio payrolls fell an annualized 3.7 percent from November to December (3,477 jobs) (Chart 3). Most sectors experienced declines, with professional and business services (30.0 percent, or 4,663 jobs), construction (18.4 percent, or 1,017 jobs) and other services (14.4 percent, or 449 jobs) experiencing the biggest drops. However, financial activities grew the most (12.8 percent, or 980 jobs). Overall in 2022, payroll employment grew 2.9 percent in San Antonio and every major sector experienced job growth except professional and business services, which declined 0.5 percent.
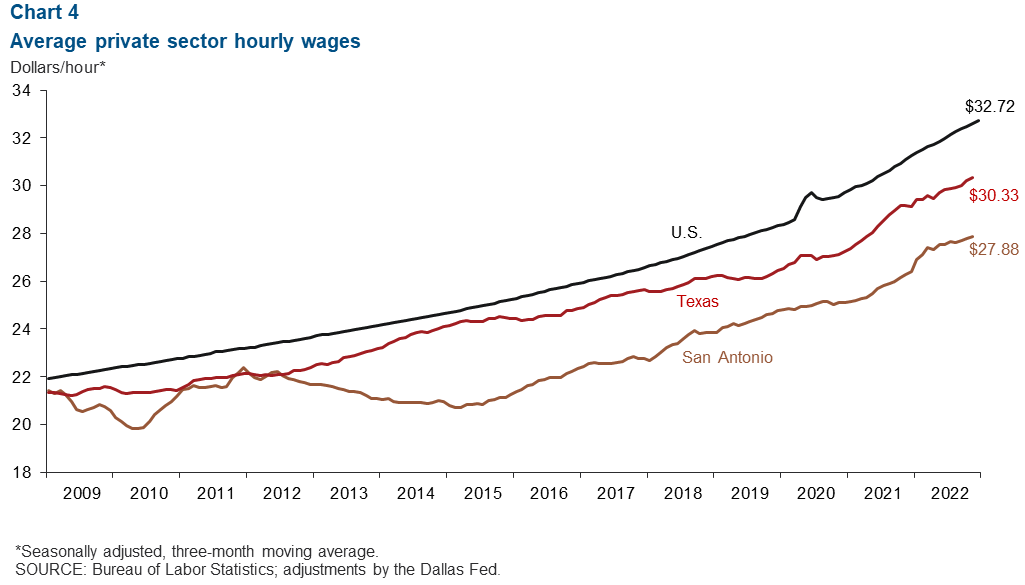
Wages climb
San Antonio wages increased an annualized 1.7 percent in December (Chart 4). The three-month moving average of wages in San Antonio was $27.88, below both the state average of $30.49 and the national average of $32.72. In the past year, San Antonio had a 5.5 percent increase in wages, outpacing gains of 4.5 percent in Texas and 4.7 percent in the U.S.
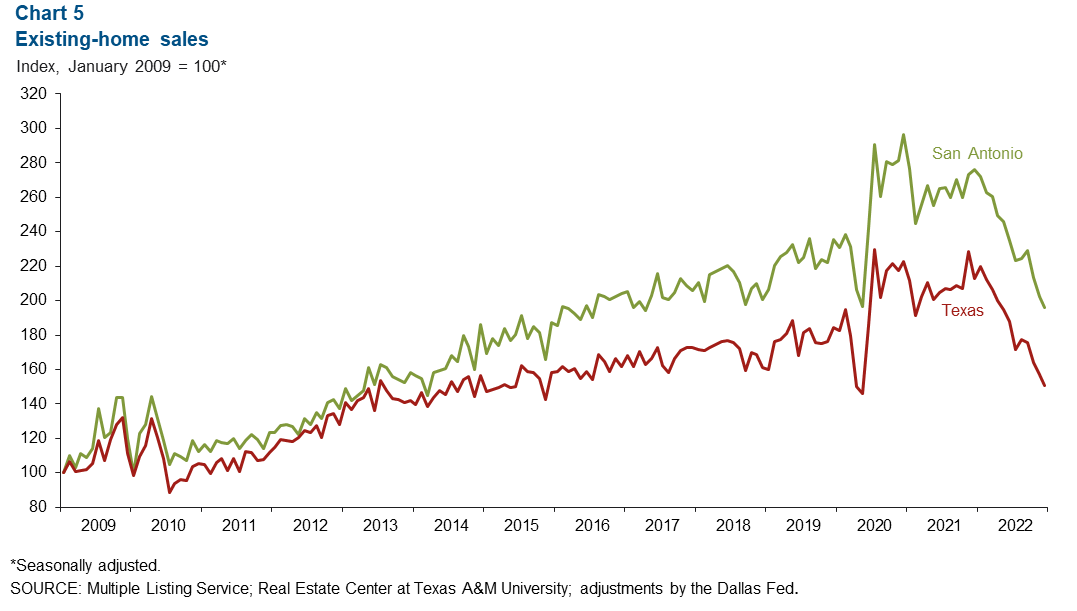
Home sales
San Antonio’s existing-home sales fell an annualized 3.2 percent in December, less than November’s 5.0 percent drop and the 3.9 percent decline statewide (Chart 5). Year over year, San Antonio sales dropped 28.9 percent, similar to Texas’ 29.1 percent decline. Existing-home sales are at levels last seen around the onset of the COVID-19 pandemic in early 2020 in both San Antonio and Texas.
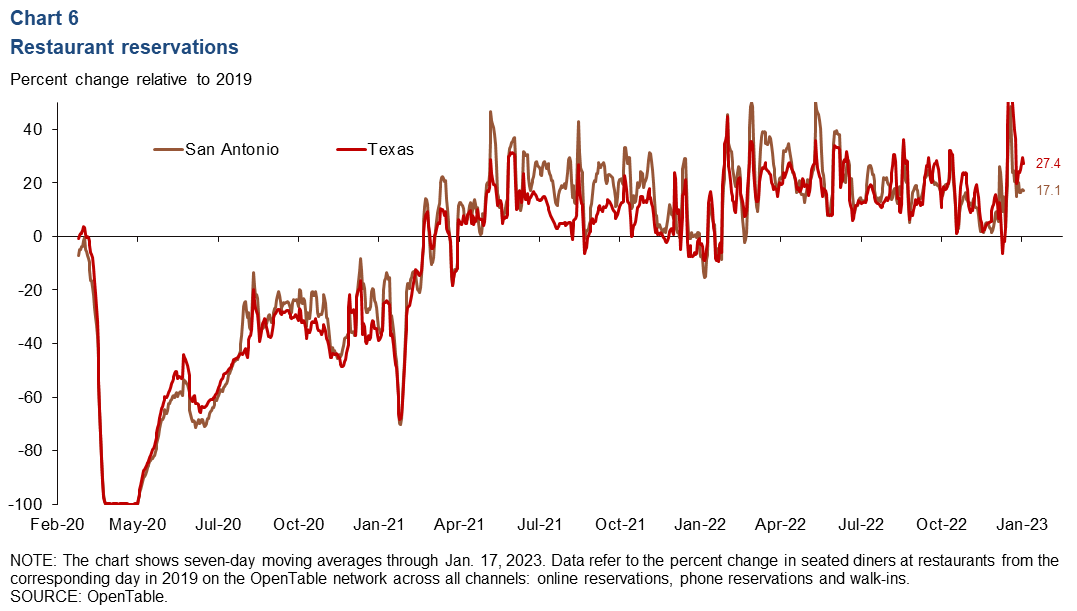
Consumer spending
As of Jan. 17, the seven-day moving average of restaurant reservations is 17.1 percent higher than the prepandemic level in San Antonio, compared with 27.4 percent higher in Texas (Chart 6). In the past month, restaurant reservations have increased 12.1 percent in San Antonio and 12.2 percent in the state.
NOTE: Data may not match previously published numbers due to revisions.
About San Antonio Economic Indicators
Questions or suggestions can be addressed to Vee Kalkunte at Prithvi.Kalkunte@dal.frb.org. San Antonio Economic Indicators is published every month during the week after state and metro employment data are released.