San Antonio Economic Indicators

| San Antonio economy dashboard (April 2024) | |||
| Job growth (annualized) Jan.–April '24 |
Unemployment rate |
Avg. hourly earnings |
Avg. hourly earnings growth y/y |
| 1.9% | 3.5% | $28.91 | 3.7% |
San Antonio payroll job growth picked up in April, unemployment ticked down, and retail sales tax revenue rose sharply . In addition, wages declined in April, and home sales declined in March.
Business-cycle index
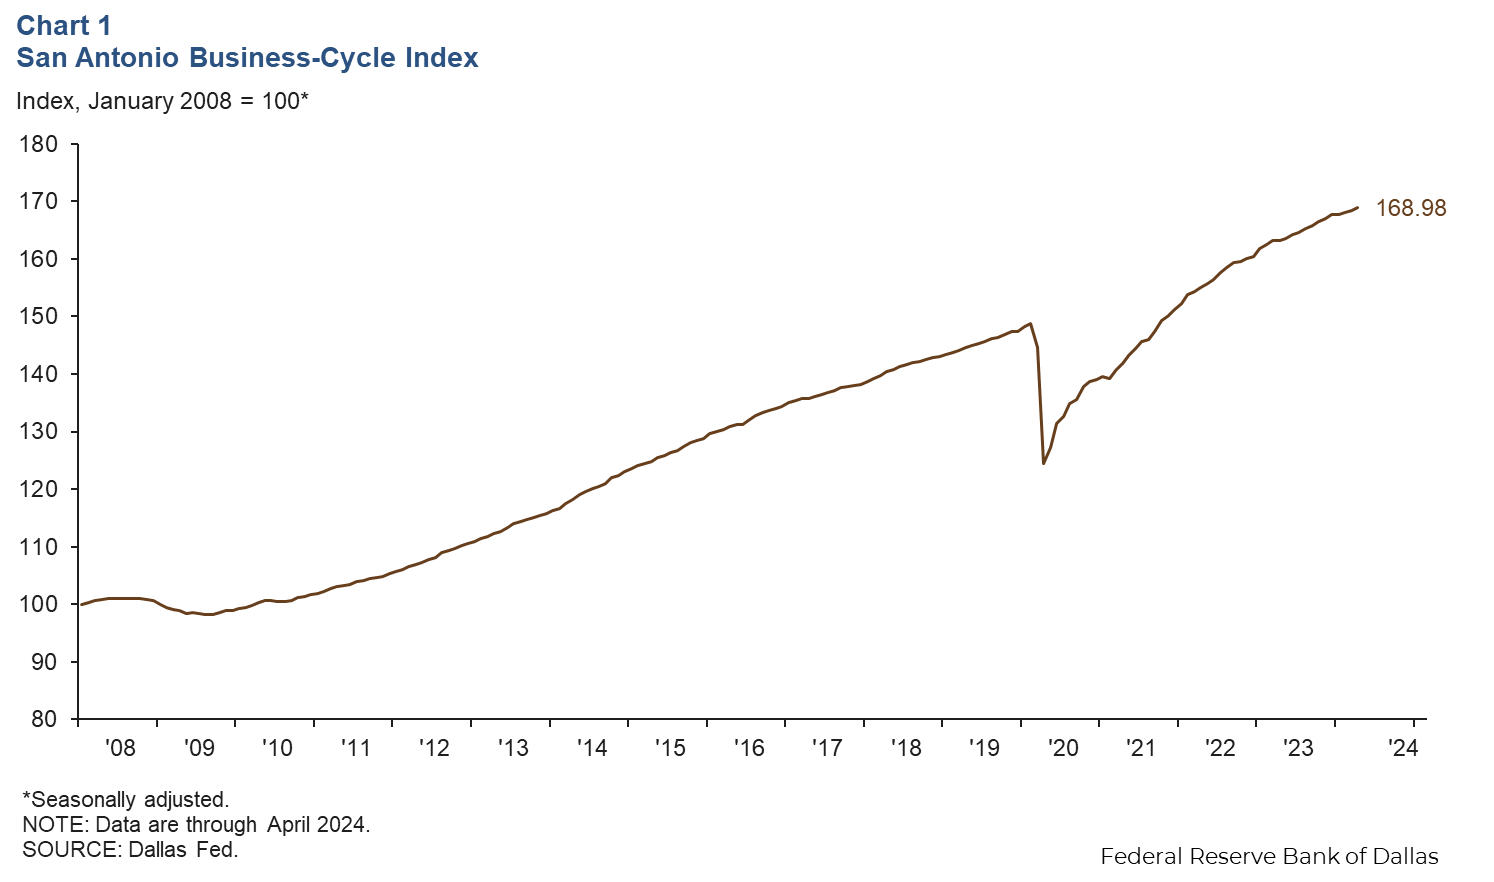
The San Antonio Business-Cycle Index, a gauge of economic conditions in the metro area, increased an annualized 4.4 percent from March to April, significantly faster than the 2.8 percent rise from February to March (Chart 1).
Labor market
Unemployment rate edges down
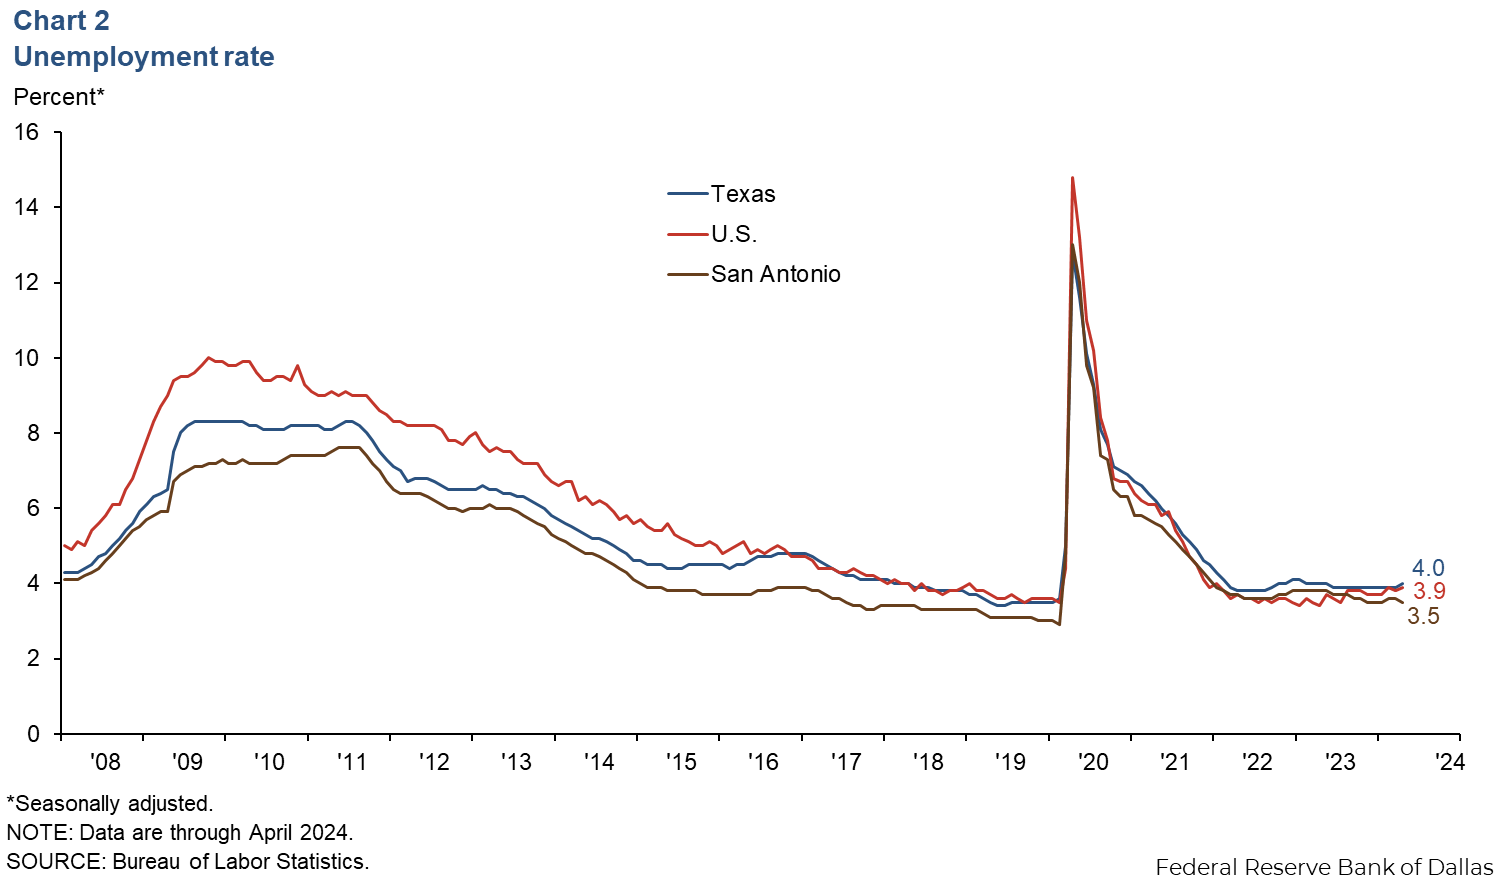
The San Antonio unemployment rate ticked down to 3.5 percent in April (Chart 2). The last time unemployment was this low in San Antonio was in January 2024. The jobless rate was higher in the nation (3.9 percent) and even higher in the state (4.0 percent) in April.
Employment growth picks up
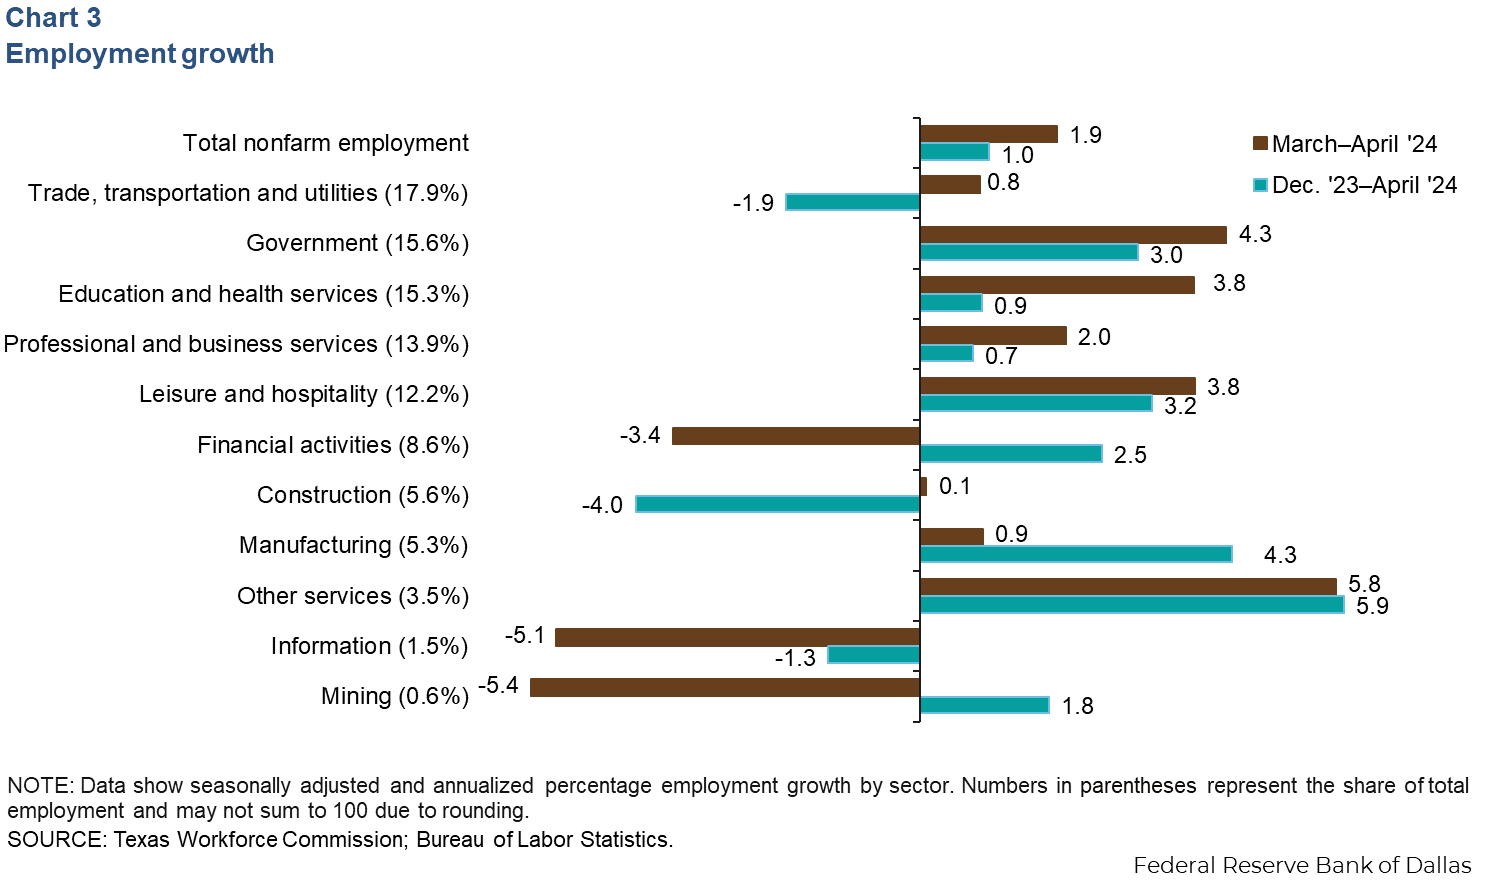
San Antonio payrolls increased an annualized 1.9 percent in April (1,845 jobs) (Chart 3). Job gains were driven by other services (5.8 percent, or 199 jobs), government (4.3 percent, or 647 jobs), education and health services (3.8 percent, or 558 jobs), and leisure and hospitality (3.8 percent, or 455 jobs). All other sectors experienced positive monthly growth except mining (-5.4 percent, or 33 jobs), information (-5.1 percent, or 75 jobs) and financial activities (-3.4 percent, or 292 jobs). Year-to-date total nonfarm employment grew 1.0 percent in San Antonio compared with gains of 2.9 percent in Texas and 1.9 percent in the U.S.
Wages fall
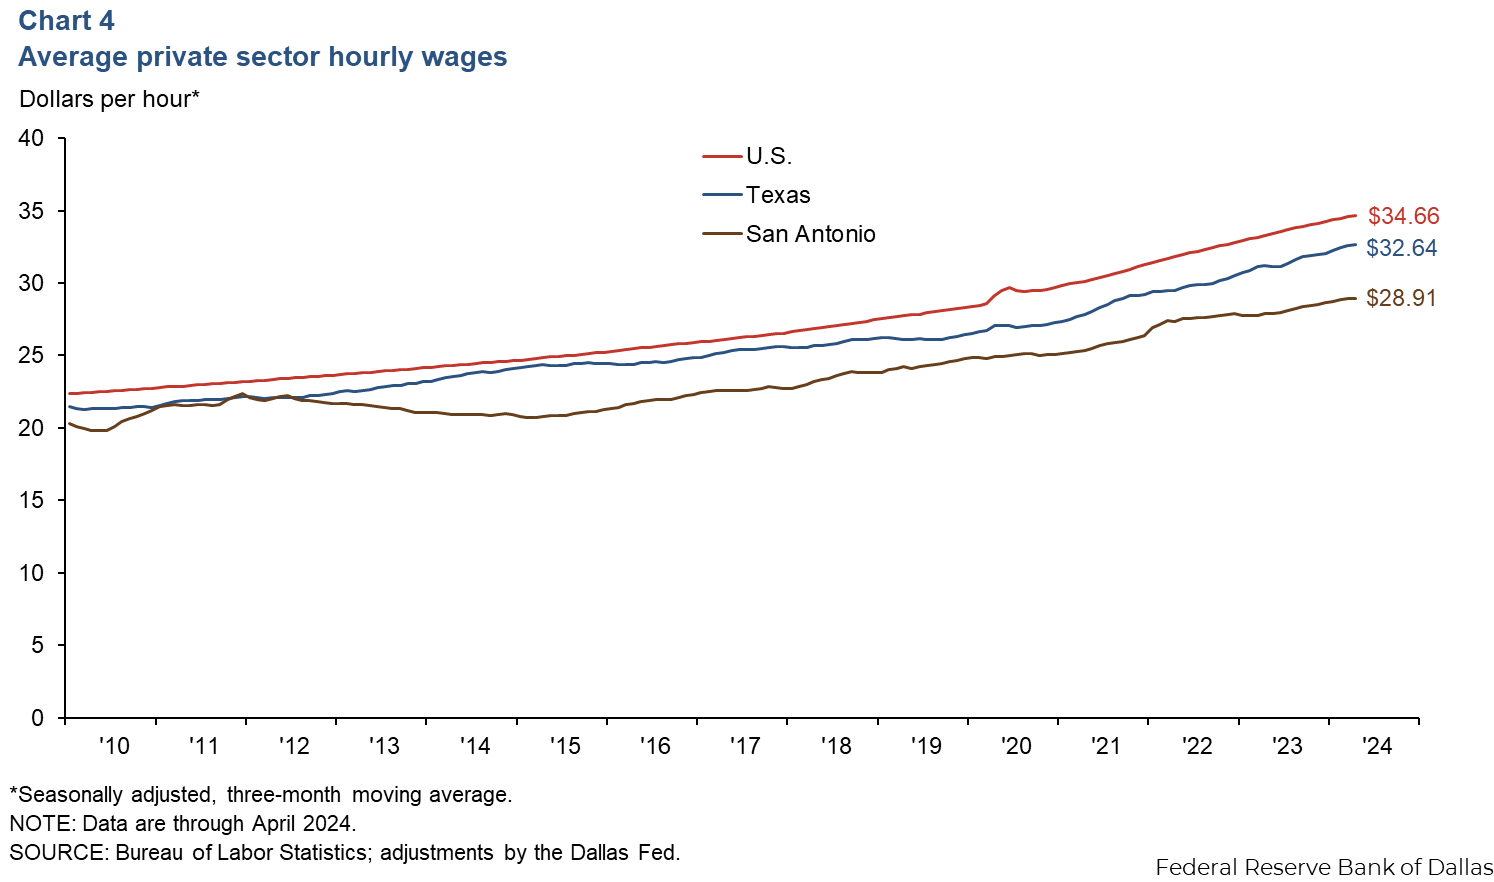
San Antonio wages declined an annualized 1.0 percent in April, while Texas and U.S. wages increased 2.6 percent and 2.8 percent, respectively. The three-month moving average of hourly wages in San Antonio was $28.91, below both the state average of $32.64 and the national average of $34.66 (Chart 4). In the past year, wages in San Antonio have risen 3.7 percent, slower than the increases in Texas (4.6 percent) and the U.S. (4.1 percent).
Retail sales tax revenue
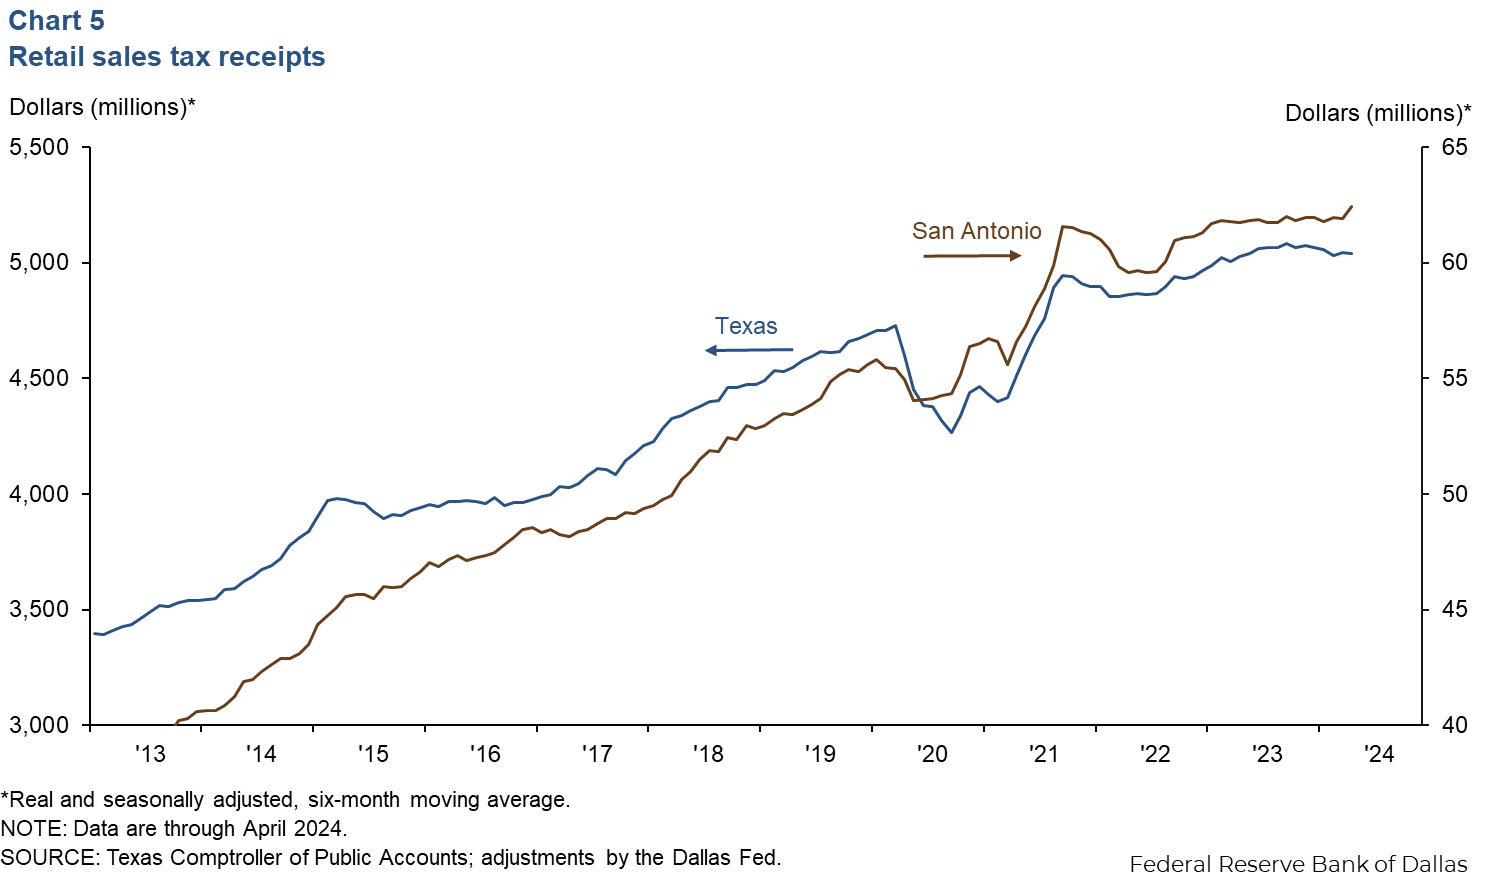
San Antonio’s revenue from sales tax, adjusted for inflation, spiked 11.0 percent in April while state sales tax revenue decreased 1.2 percent (Chart 5). Previous data showed stagnant San Antonio sales tax revenue and growing state revenue. This trend has reversed, where now state sales tax revenue growth has slowed, while San Antonio’s sales tax growth increased. For San Antonio, the six-month moving average grew 1.1 percent year over year in April. State sales tax revenue was up a meager 0.2 percent in April compared with April 2023. This is a decline from the 2.0–3.0 percent year-over-year growth at the end of 2023.
Existing-home sales
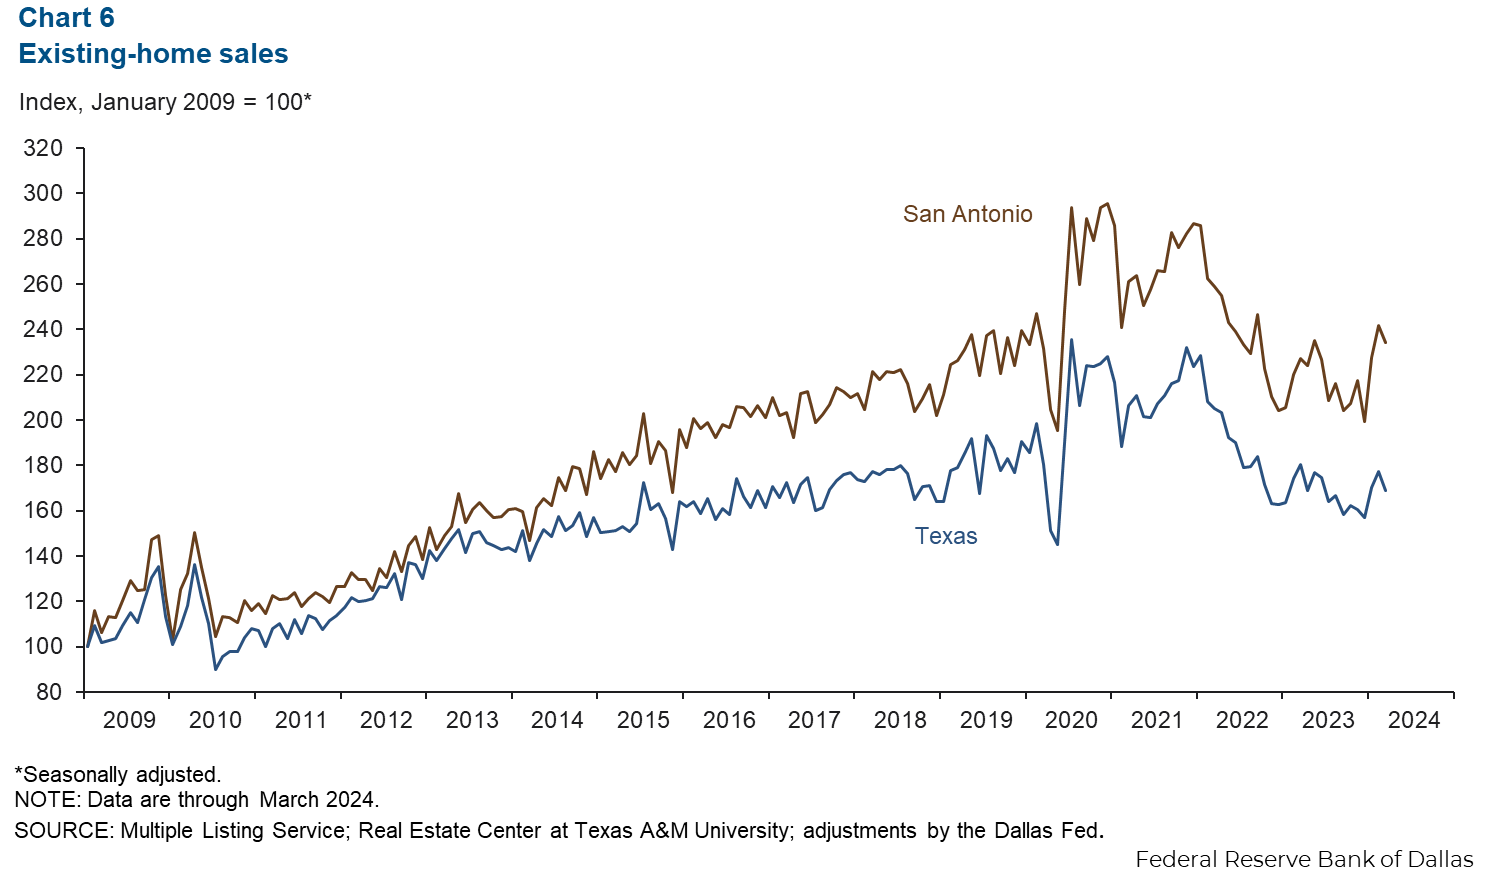
Existing-home sales in San Antonio declined 3.2 percent in March compared with a 4.7 percent decrease statewide (Chart 6). Despite the drop, homes sales are up 18 percent year to date in San Antonio and 7.8 percent in the state. Year-over-year sales are up 3.0 percent in San Antonio and down 6.4 percent in the state.
NOTE: Data may not match previously published numbers due to revisions.
About San Antonio Economic Indicators
Questions or suggestions can be addressed to Mariam Yousuf at Mariam.Yousuf@dal.frb.org. San Antonio Economic Indicators is published every month during the week after state and metro employment data are released.