San Antonio Economic Indicators

| San Antonio economy dashboard (March 2025) | |||
| Job growth (annualized) Dec. '24–March '25 |
Unemployment rate |
Avg. hourly earnings |
Avg. hourly earnings growth y/y |
| 1.0% | 3.8% | $31.65 | 9.0% |
San Antonio payrolls and wages grew in March. Retail sales tax revenue continued to fall on a yearly basis. The unemployment rate rose. Home inventory and prices increased.
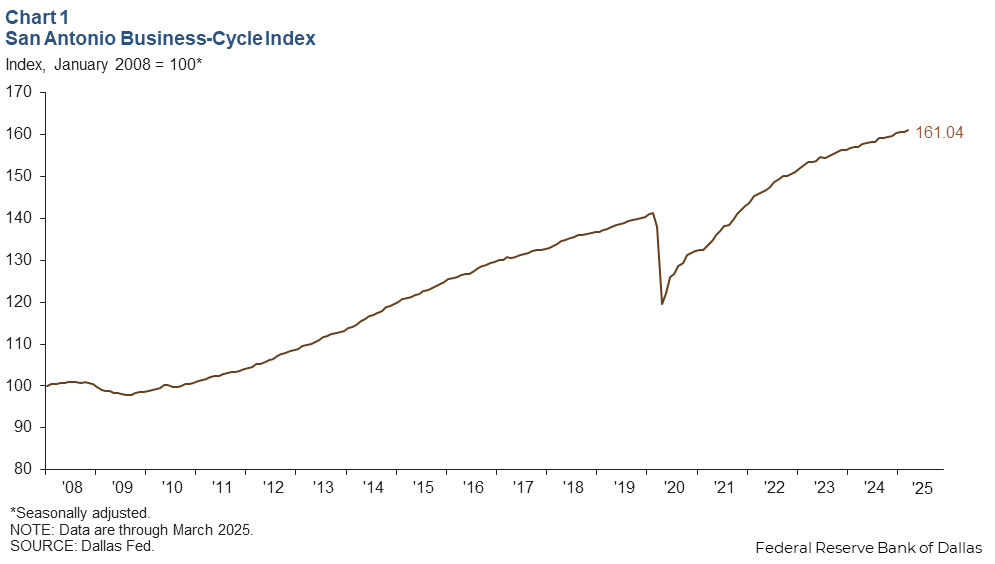
Business-cycle index
The San Antonio Business-Cycle Index, a gauge of economic conditions in the metro area, increased an annualized 2.9 percent in March (Chart 1).
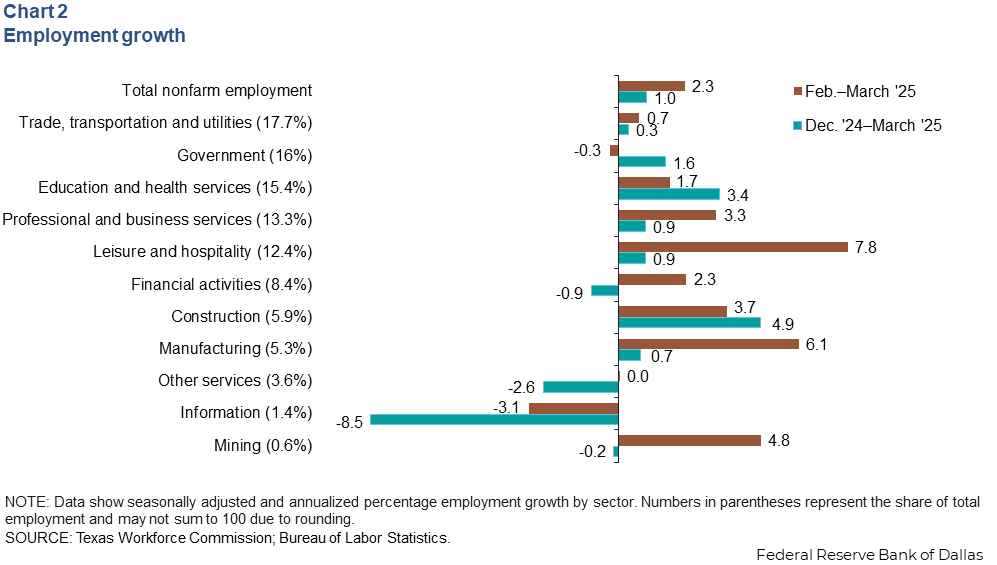
Labor market
Employment growth continues
San Antonio payrolls rose in March, growing an annualized 2.3 percent (2,200 jobs). Payrolls grew 1.0 percent (2,820 jobs) December through March, led by gains in education and health services (3.4 percent, or 1,600 jobs), construction (4.9 percent, or 800 jobs) and government (1.6 percent, or 800 jobs) (Chart 2). The information, other services, financial activities, federal government and natural resources sectors lost jobs. Year over year, total nonfarm employment growth in San Antonio was 1.6 percent, faster than gains in Texas (1.4 percent) and the U.S. (1.2 percent).
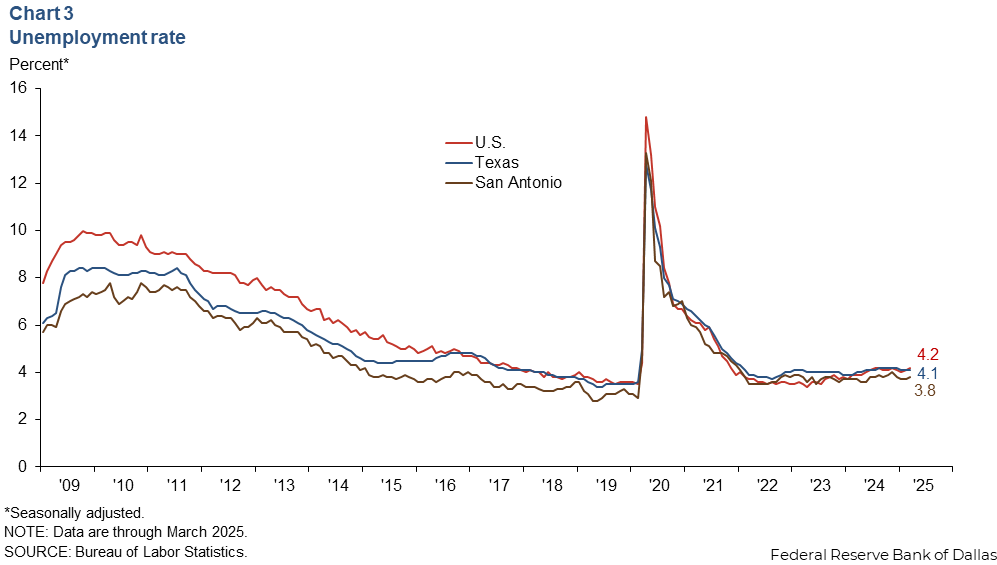
Unemployment rate rises
The San Antonio unemployment rate increased to 3.8 percent in March (Chart 3). The jobless rate in Texas held at 4.1 percent, and the U.S. rate edged up to 4.2 percent.
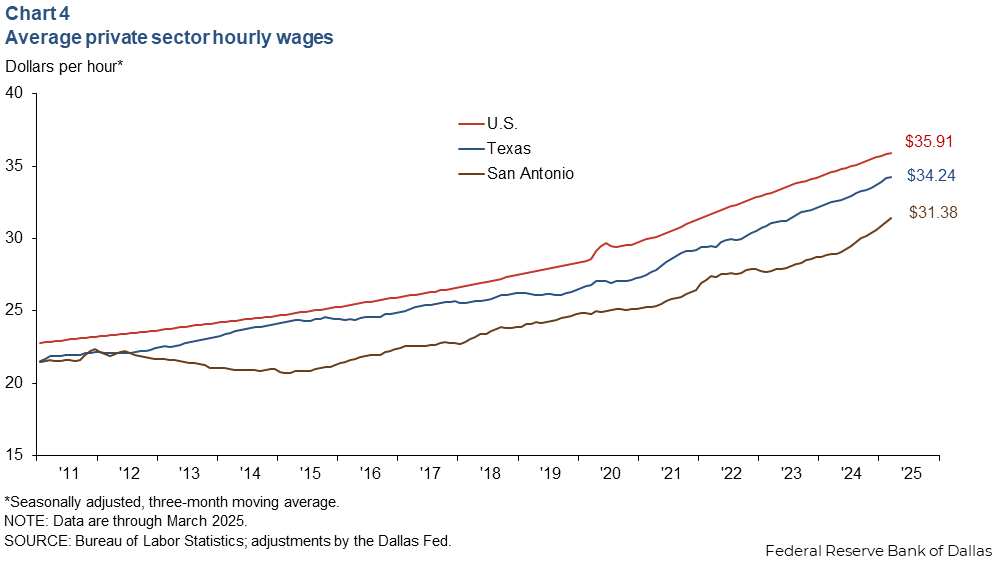
Wages rise
The average hourly wage in San Antonio rose to $31.65 in March from February's $31.51. The three-month moving average of wages grew an annualized 10.4 percent in March, while smoothed wages in the state rose 3.0 percent, and they increased 3.6 percent in the U.S. Smoothed hourly wages in San Antonio were $31.38, below both the state and national averages (Chart 4). Year over year, wages in San Antonio rose 8.5 percent—greater than the increases in Texas (5.3 percent) and the U.S. (3.9 percent).
Consumer spending
Sales tax receipts are a proxy for consumer spending patterns. San Antonio sales tax revenue, adjusted for inflation, rose 1.6 percent in March, and Texas sales tax revenue decreased 1.2 percent (Chart 5). Year over year, San Antonio sales tax revenue decreased 3.1 percent, while the state’s sales tax revenue rose 0.7 percent.
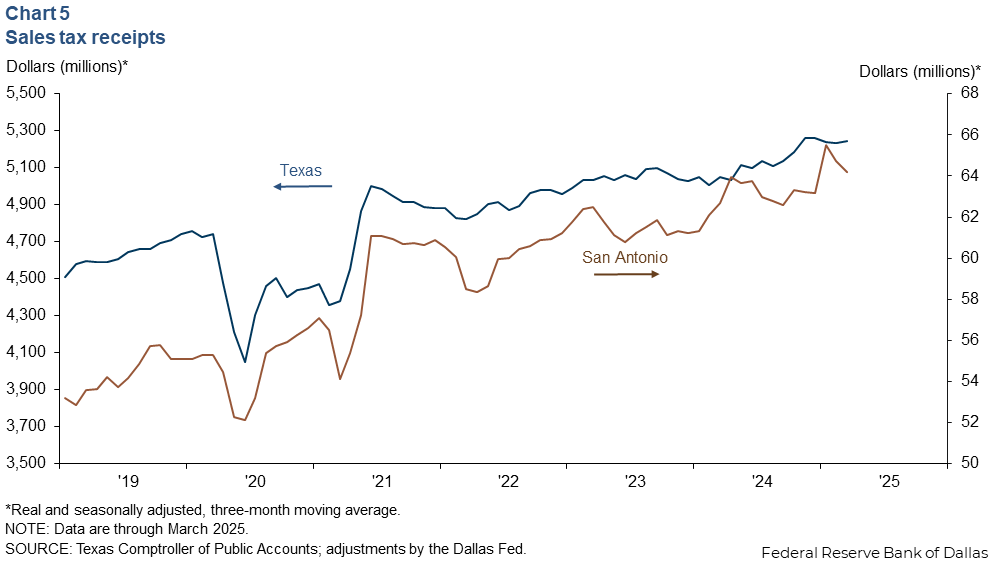
More timely data from Fiserv shows that consumer spending continued to fall in early April, despite San Antonio hosting the NCAA Men’s Final Four.
Housing
The supply of existing homes rose to 5.6 months in March and remained higher than the state’s 5.3 months (Chart 6). This is the fifth month in a row that inventory has risen in the Alamo City. Since October 2012, inventories have remained below six months, which is generally considered a balanced housing market.
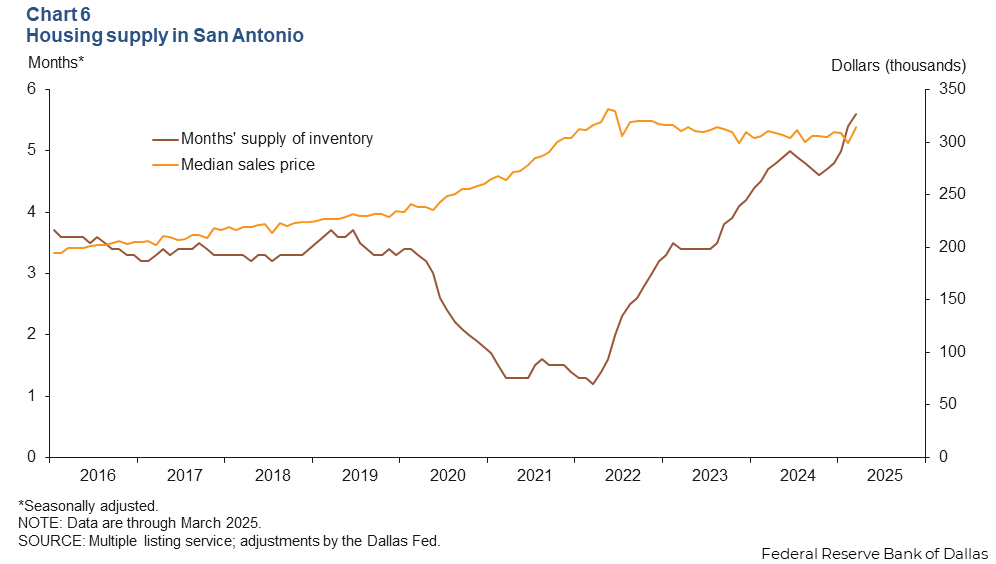
Median home prices rose 5.0 percent in March and 1.3 percent over the past year. Meanwhile, home prices in Texas rose 1.7 percent in March and were up 1.2 percent over the past year.
NOTE: Data may not match previously published numbers due to revisions.
About San Antonio Economic Indicators
Questions or suggestions can be addressed to Ethan Dixon at Ethan.Dixon@dal.frb.org. San Antonio Economic Indicators is published every month during the week after state and metro employment data are released.