San Antonio Economic Indicators

| San Antonio economy dashboard (February 2026) | |||
| Job growth (annualized) Nov. '25–Feb. '26 |
Unemployment rate |
Avg. hourly earnings |
Avg. hourly earnings growth y/y |
| 2.4% | 4.1% | $32.32 | 2.8% |
San Antonio payrolls declined, while the unemployment rate ticked down in February. Wages registered a strong annual increase. Absorption of industrial and office real estate was positive, and vacancy rates declined.
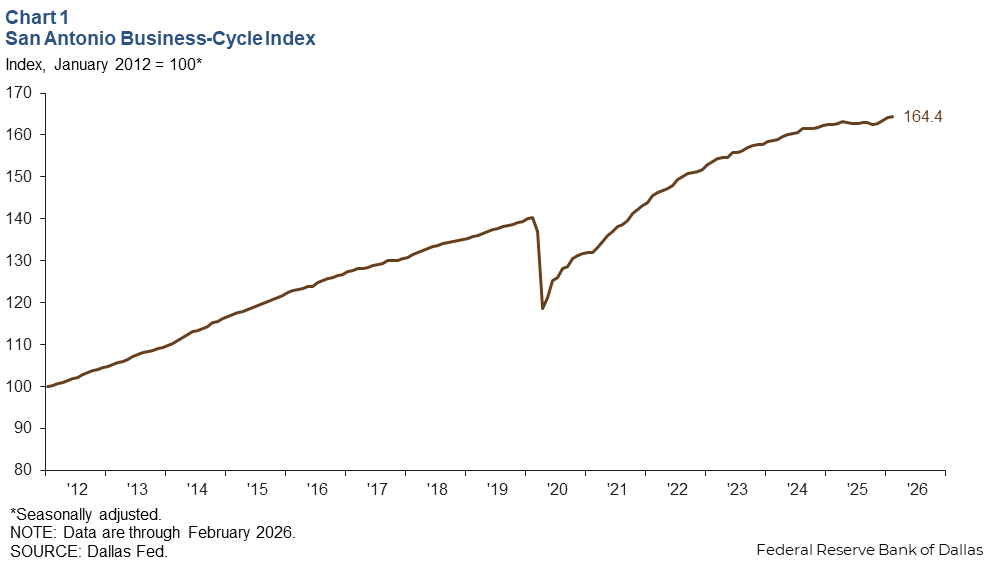
Business-cycle index
The San Antonio Business-Cycle Index, a gauge of economic conditions in the metro area, rose an annualized 1.9 percent in February from January (Chart 1).
Labor market
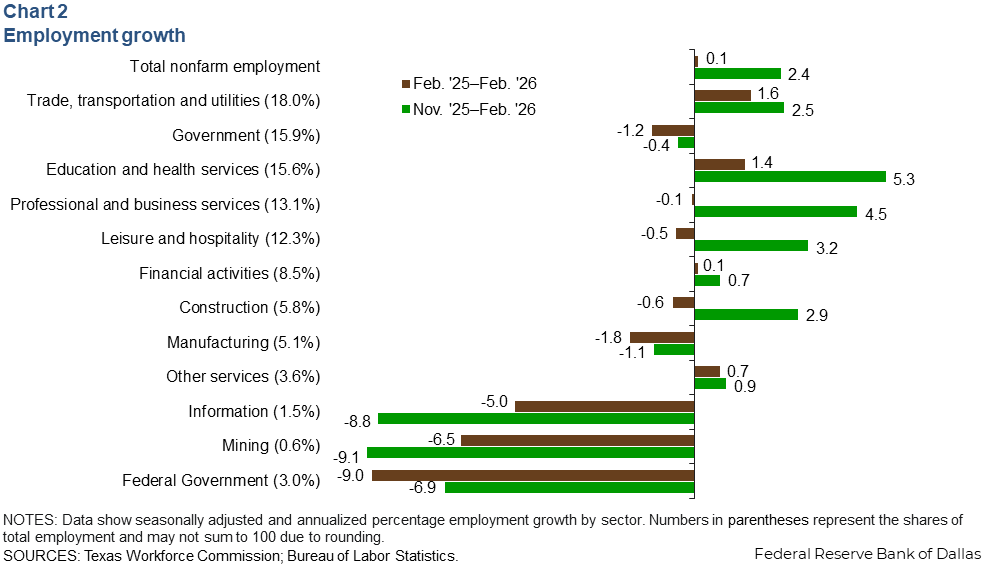
Employment declines
Although San Antonio payrolls declined an annualized 1.0 percent in February from January, payrolls slightly ticked up 0.1 percent compared to February 2025 (Chart 2). Payroll employment rose 2.4 percent (7,000 jobs) from November through February, with the greatest gains in education and health services (5.3 percent, or 2,400 jobs), professional and business services (4.5 percent, or 1,700 jobs), and leisure and hospitality (3.2 percent, or 1,100 jobs). Over the same period, the largest employment declines were in mining (9.1 percent, or 170 jobs), information (8.8 percent, or 400 jobs), and manufacturing (1.1 percent, or 170 jobs).
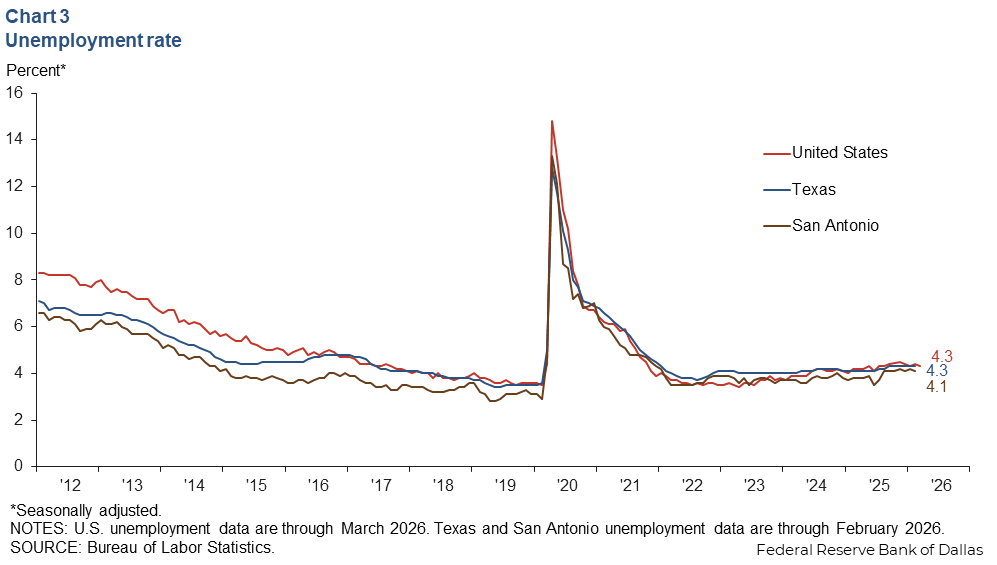
Unemployment rate declines
The San Antonio unemployment rate ticked down to 4.1 percent in February (Chart 3). The jobless rate is higher in Texas (4.3 percent) and the U.S. (4.3 percent).
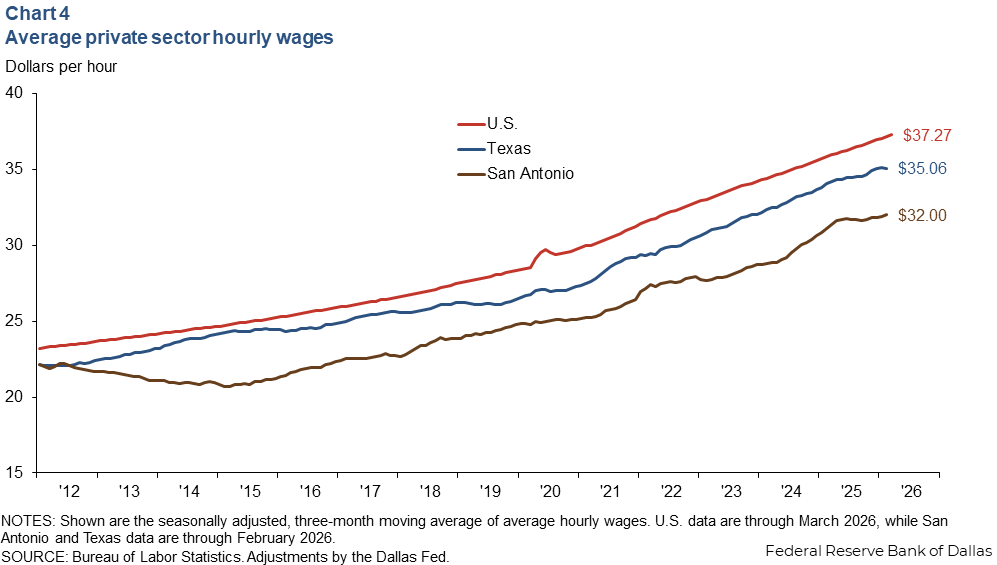
Wages record strong annual increase
The average nominal hourly wage in San Antonio increased to $32.00 in February (Chart 4). Wages are seasonally adjusted and smoothed with a three-month moving average. Year over year, San Antonio wages grew a strong 2.8 percent in February, while wages in Texas rose 2.9 percent in February. U.S. wages grew 3.6 percent in March. Earnings in San Antonio remain lower than the state and nation.
Commercial real estate
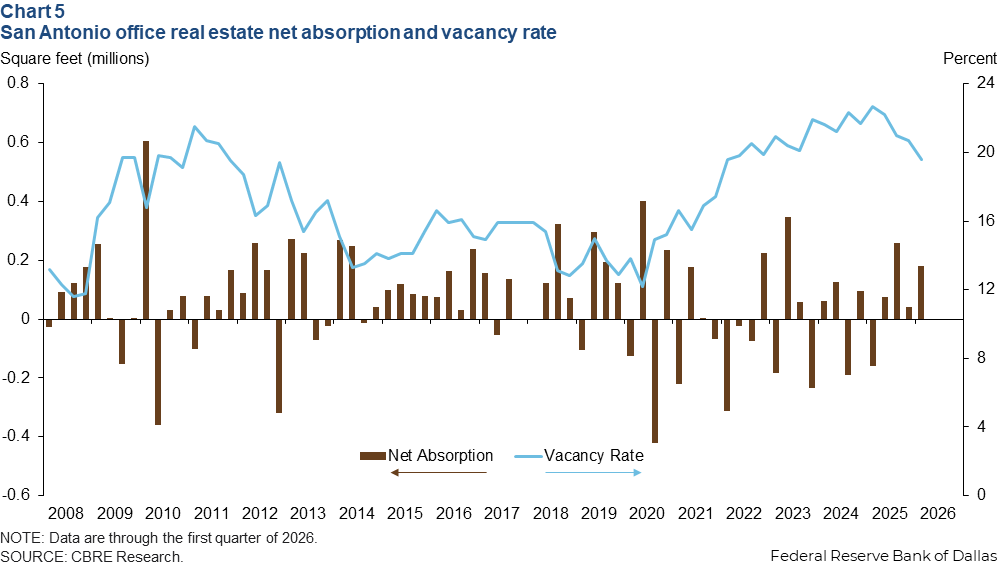
Office vacancy declines
Demand for Class A office space in San Antonio was strong in first quarter 2026. Net absorption was positive for the fourth straight quarter at 179,000 square feet, pulling down the vacancy rate to 19.6 percent after a multiyear high of 22.7 percent in the first quarter of 2025, according to data from CBRE Research (Chart 5). The metro area had 3.3 million square feet of vacant Class A office space at the end of the first quarter.
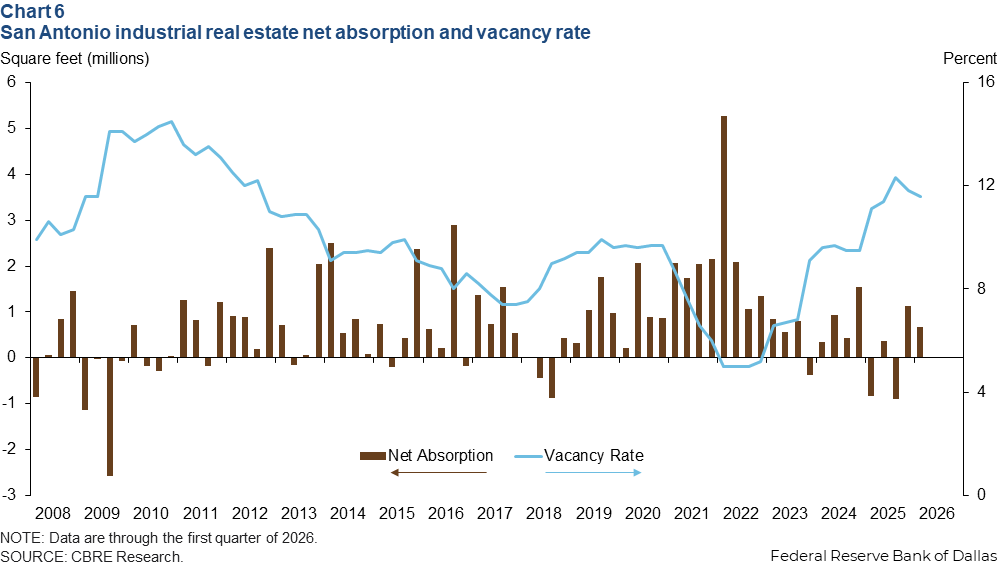
Industrial leasing improves
Positive momentum in industrial leasing continued in the first quarter of 2026. Net absorption was 679,000 square feet, below the fourth quarter of 2025, according to CBRE (Chart 6). The vacancy rate declined to 11.6 percent. The metro area had 19.9 million square feet of vacant industrial space at the end of the first quarter.
NOTE: Data may not match previously published numbers due to revisions.
About San Antonio Economic Indicators
Questions or suggestions can be addressed to Luis Torres. San Antonio Economic Indicators publishes bimonthly after state and metro employment data are released.