Southern New Mexico Economic Indicators

Second Quarter 2022
The Las Cruces economy expanded in May as payroll employment grew and unemployment fell. Monthly trade volumes declined. Growth in New Mexico’s rig count and oil production continued. Potash prices rose further, but copper prices fell.
Labor market
Las Cruces payroll gains solid
Las Cruces employment grew an annualized 1.3 percent, or by 80 jobs, in May (Chart 1). Employment gains were broad based but primarily concentrated in government (120 jobs), professional and business services (70) and leisure and hospitality (50). The only sector that lost jobs in May was trade, transportation and utilities, down 190 positions.
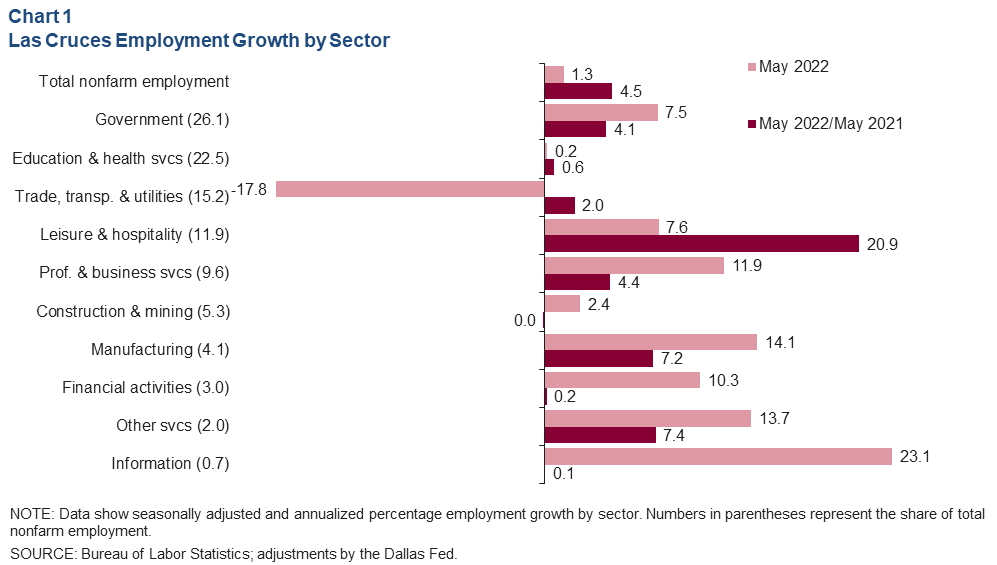
Compared with the same month last year, metro employment is up 4.5 percent, or by 3,260 jobs. Large payroll gains were seen in leisure and hospitality (1,550 jobs) and government (780). Employment was little changed in the financial activities, information, and construction and mining sectors.
Unemployment trends downward
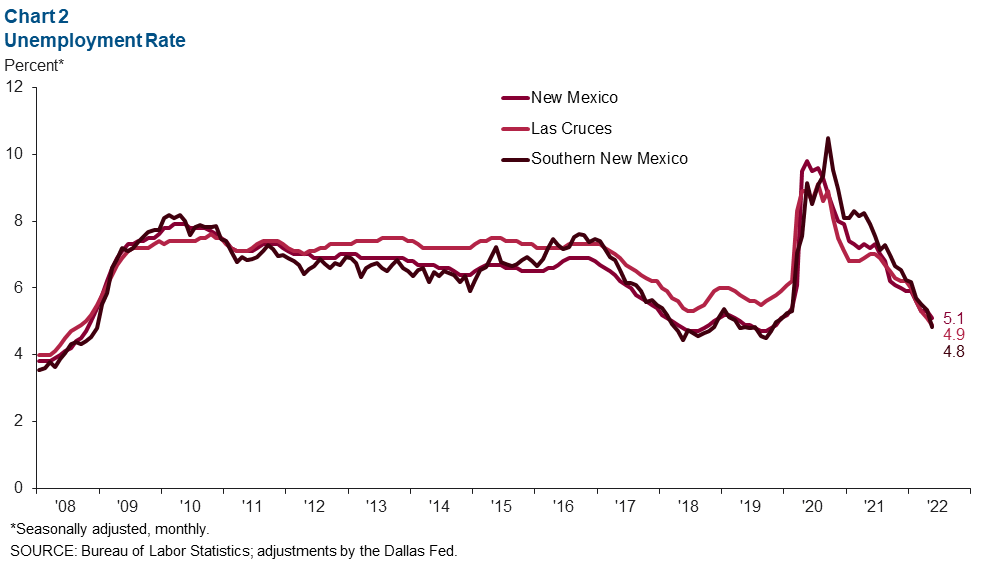
Las Cruces’ unemployment rate fell from 5.1 percent in April to 4.9 percent in May (Chart 2). New Mexico’s jobless rate also fell in May, from 5.3 percent to 5.1 percent. In southern New Mexico overall, the rate also declined, from 5.3 percent to 4.8 percent. Luna County’s unemployment rate remained the highest in southern New Mexico at 11.9 percent, while Curry County’s rate was the lowest at 3.3 percent.
Average weekly earnings rise
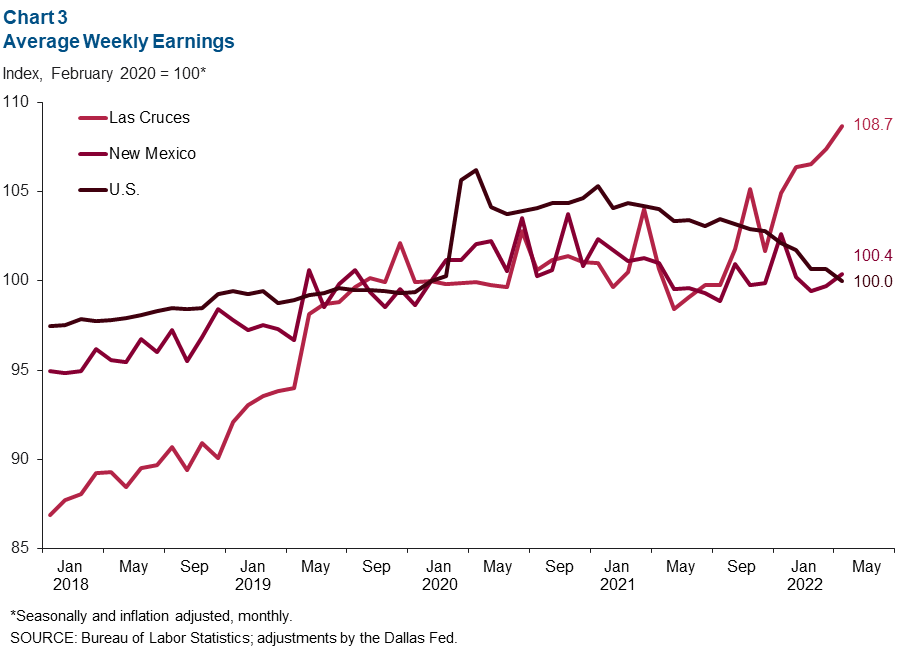
Real average weekly earnings in Las Cruces rose from $820 in May 2021 to $885 in May 2022. The latest figure represents a year-over-year increase of 8 percent and a rise of 8.7 percent since February 2020 (Chart 3). New Mexico’s average weekly earnings were $906 in May 2022, essentially flat from a year ago, while earnings nationally fell 3.9 percent during this same period.
Trade
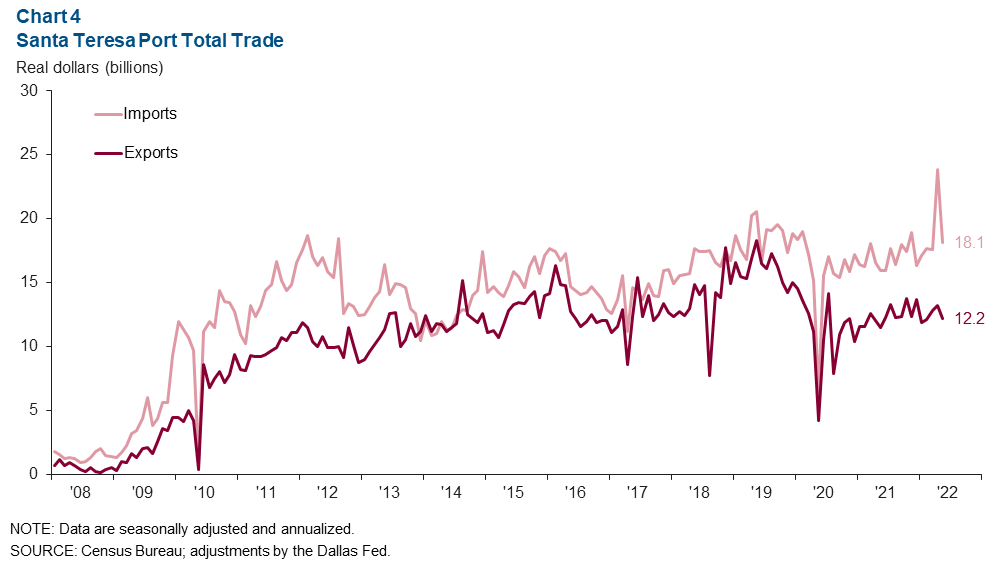
In May, annualized total trade primarily through the Santa Teresa port in southern New Mexico totaled $30.3 billion, 18.3 percent below April’s level but 10.6 percent above the May 2021 total (Chart 4). The monthly decrease followed a record level of imports in April, likely driven by substitution away from El Paso ports to the Santa Teresa port due to a trucking backlog and bridge gridlock. Monthly imports fell 24.1 percent to $18.1 billion in May, while exports reached $12.2 billion, a decrease of 7.9 percent.
Commodity markets
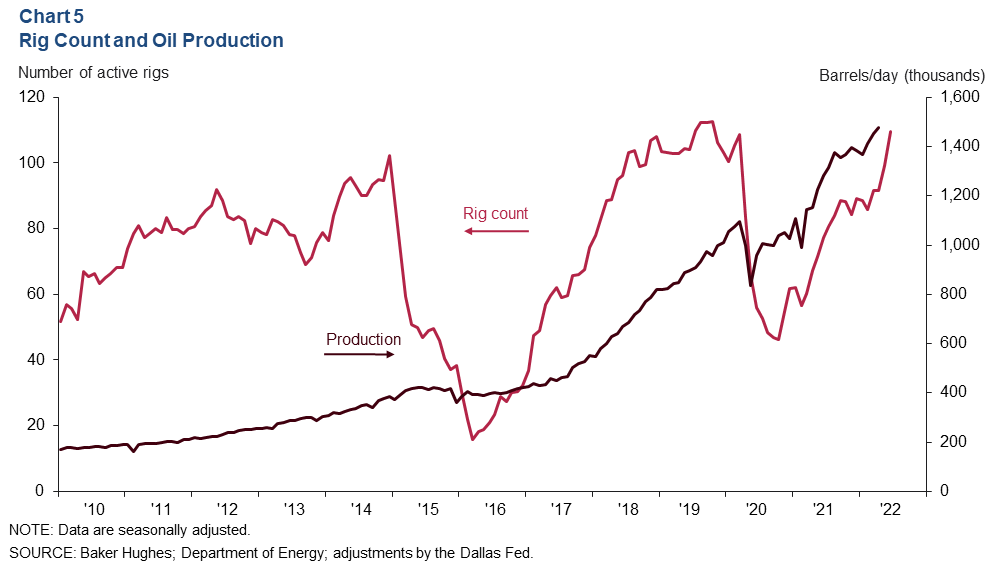
Rig count, oil production climb
The New Mexico rig count rose from 99 in May to 109 in June (Chart 5). Meanwhile, oil production rose 1.7 percent to 1.48 million barrels per day in April and was up 28.5 percent from a year prior.
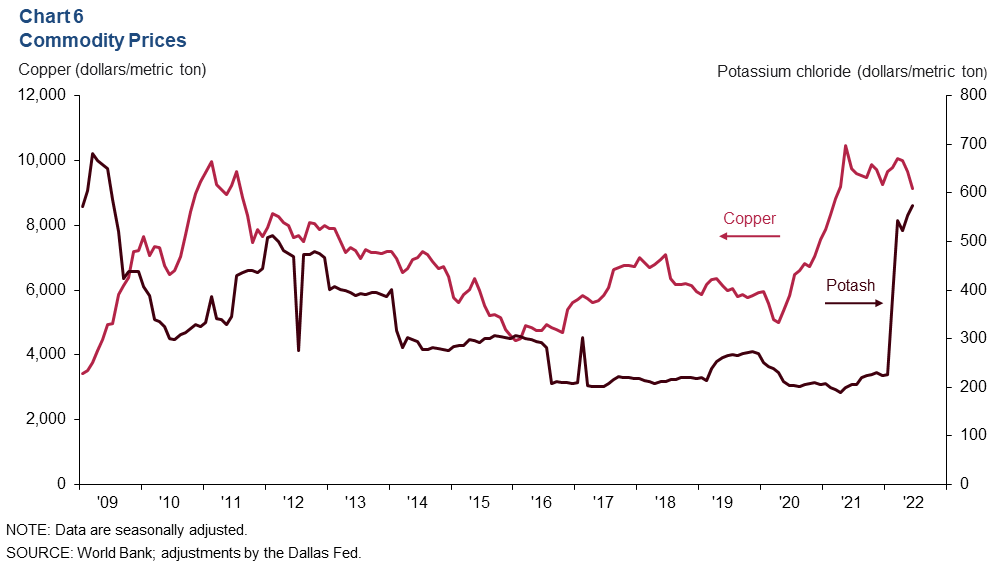
Potash prices soar, copper prices fall
In addition to oil and natural gas, southern New Mexico's economy is dependent on other commodities, such as potash, copper and silver. Potash prices increased dramatically following the Russian invasion of Ukraine, the subsequent sanctions and the rise in food prices, reaching an average of $573.02 per metric ton in June 2022. Potash prices rose 3.5 percent from May and nearly tripled from June 2021 (Chart 6). Copper prices fell from $9,672 per metric ton in May to $9,142 in June and were down 6.4 percent year over year.
NOTES: Data may not match previously published numbers due to revisions. All New Mexico counties within the Federal Reserve’s Eleventh District are counted as part of southern New Mexico. Las Cruces is excluded from southern New Mexico to better gauge unemployment levels outside the region’s largest population center.
About Southern New Mexico Economic Indicators
Questions or suggestions can be addressed to Keighton Hines at Keighton.Hines@dal.frb.org. Southern New Mexico Economic Indicators is released quarterly.