Southern New Mexico Economic Indicators

| Las Cruces economy dashboard, March 2025 | |||
| Job growth (annualized) Dec. '24–March '25 |
Unemployment rate |
Avg. hourly earnings |
Avg. hourly earnings y/y |
| 1.5% | 4.8% | $24.37 | -5.6% |
The Las Cruces labor market grew moderately in the first quarter of 2025. Unemployment held steady in March, though local unemployment remains higher than the state and nation. Crude oil production ticked up in February while the rig count was flat. Prices for locally produced commodities such as copper and potash increased in March. Import values through the Port of Santa Teresa spiked in February while exports were steady.
Labor market
Las Cruces employment expands
Employment in Las Cruces grew at an annualized 1.5 percent in the first quarter of 2025 (Chart 1). Construction and mining and education and health services posted the strongest job growth. Government and leisure and hospitality, both large portions of the local labor market, also grew robustly. Meanwhile, trade, transportation and utilities, professional and business services, and the smaller manufacturing and finance sectors experienced job losses.
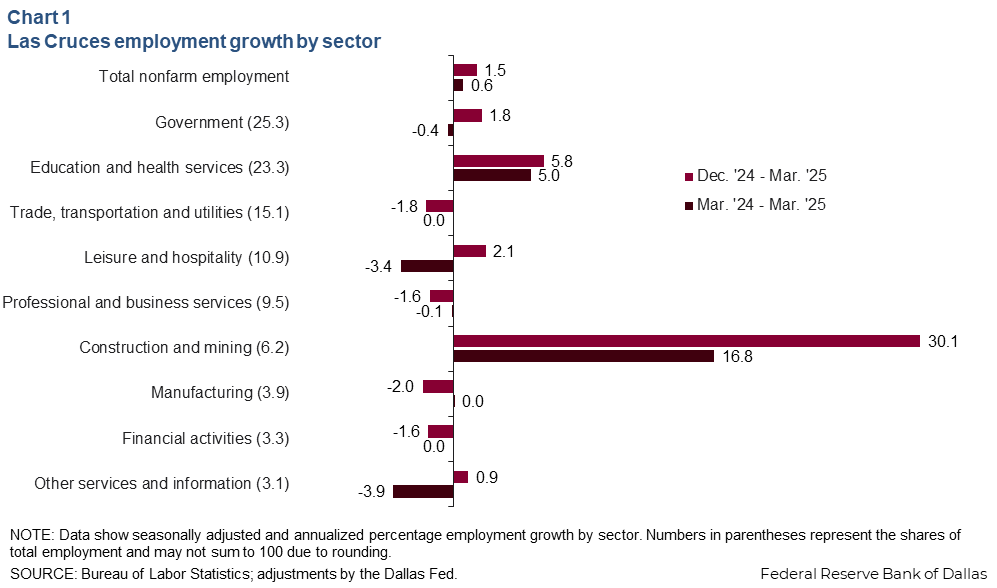
Year over year, Las Cruces employment grew 0.6 percent (500 jobs). Growth leaders included construction and mining, which grew 16.8 percent (700 jobs), and education and health, which grew 5.0 percent (900 jobs). However, payrolls were largely flat in many sectors, including the large government and trade, transportation and utilities sectors. The sharpest declines were in other services and information, which shed 3.9 percent of its employment (-100 jobs), and leisure and hospitality, which declined 3.4 percent (-300 jobs).
Unemployment little changed
Unemployment in Las Cruces in March was 4.8 percent, little changed from December’s 4.9 percent (Chart 2). However, unemployment in the metro area was higher than both the state and nation. In March, New Mexico’s unemployment rate was 4.3 percent, unchanged from December. National unemployment was 4.2 percent in March.

Commodities
Oil production flat
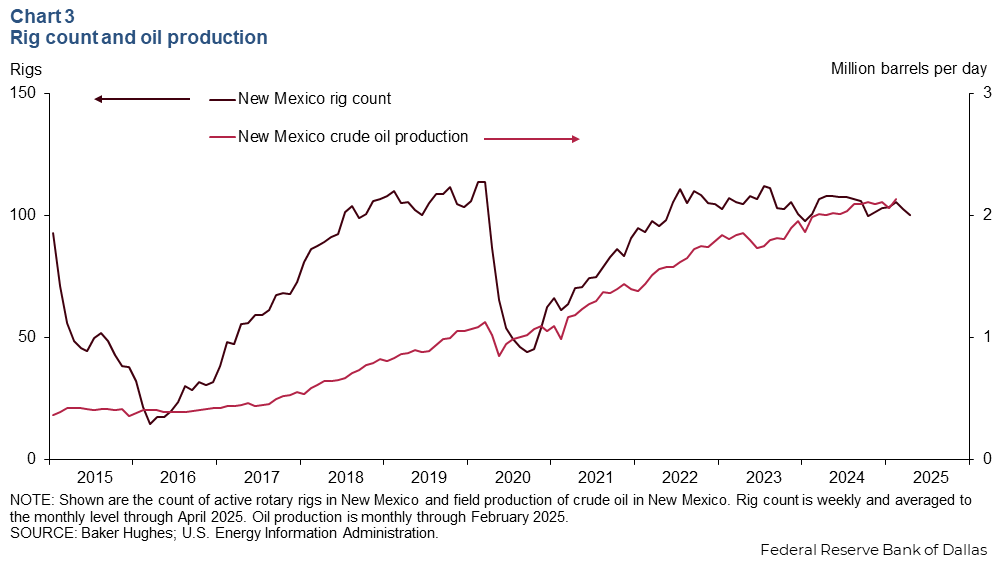
Crude oil production in New Mexico was 2.1 million barrels per day in February 2025 (Chart 3). This is unchanged from October 2024. Since February 2024, crude production in the state expanded 7.5 percent with growth slowing toward the end of the year. The rig count fell to 100 active rotary rigs in April 2025, down from 108 in April 2024.
Copper and potash prices tick up
In addition to oil and natural gas, southern New Mexico also produces commodities such as potassium chloride and copper. Potassium chloride is a form of potash, which is commonly used in fertilizer. The price of potassium chloride rose to $334.65 per metric ton in March from $312.03 in December 2024 (Chart 4). Copper prices also increased to $9,322.28 per metric ton in March from $9,022.59 in December.
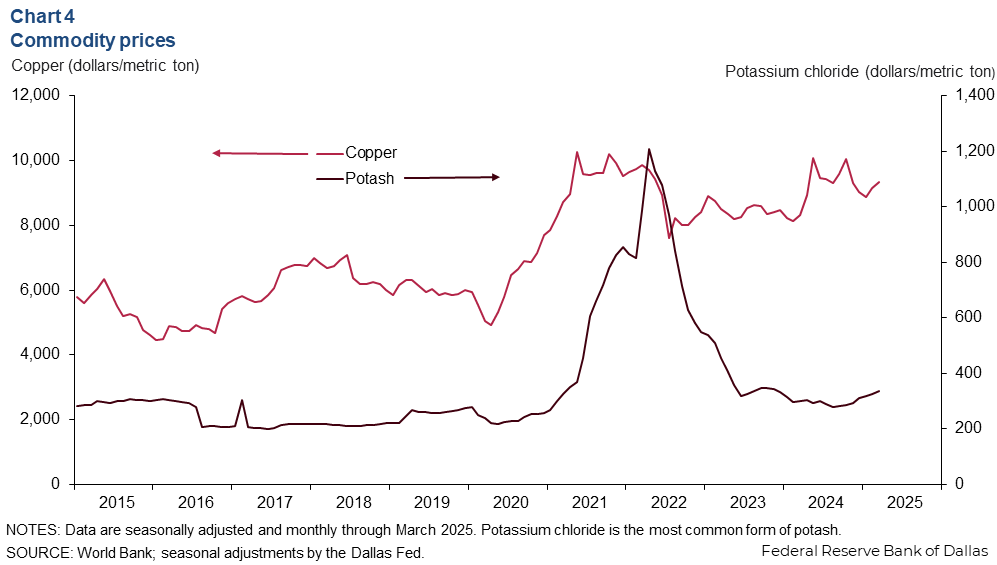
Year over year, potassium chloride prices are up 11.4 percent, and copper prices are up 12.0 percent.
Santa Teresa imports spike
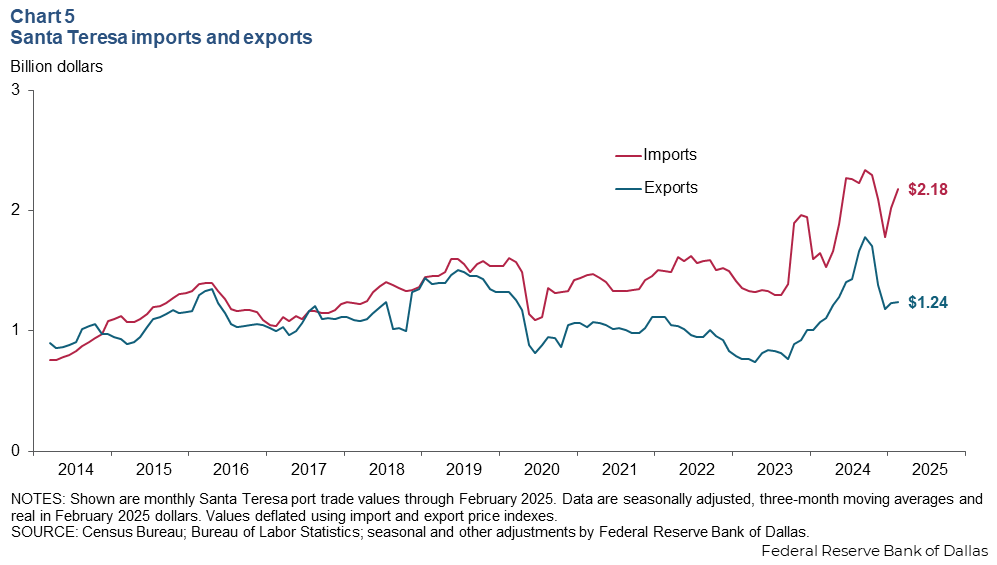
Smoothed imports through the Port of Santa Teresa rose to $2.18 billion in February from $1.7 billion in December 2024 (Chart 5). Contacts have noted that the pickup in trade activity at the beginning of the year could be a result of firms making purchases ahead of tariffs being implemented. Export activity was flat over that time. Export values through Santa Teresa were $1.2 billion in February, unchanged from December 2024. Year over year import values were up 31.8 percent, while export values were up 15.2 percent.
NOTES: Data may not match previously published numbers due to revisions. All New Mexico counties within the Federal Reserve’s Eleventh District are counted as part of southern New Mexico.
About Southern New Mexico Economic Indicators
Questions or suggestions can be addressed to Robert Leigh at Robert.Leigh@dal.frb.org. Southern New Mexico Economic Indicators is released quarterly.