Southern New Mexico Economic Indicators

| Las Cruces economy dashboard, March 2026 | |||
| Job growth (annualized) Dec. '25–Mar. '26 |
Unemployment rate (Feb. 2026) |
Avg. hourly earnings |
Avg. hourly earnings y/y |
| 0.5% | 5.4% | $25.23 | 2.2% |
Employment in Las Cruces grew moderately from March 2025 to March 2026. More recently, employment grew at a milder pace from December 2025 through March 2026, and wages declined slightly over the same time period. The unemployment rate increased over the three months ending in February. Copper prices increased to new highs in April, and potash prices declined slightly over the three months ending in March.
Labor market
Employment grows moderately year over year
Employment in Las Cruces grew 1.3 percent (1,100 jobs) from March 2025 to March 2026 (Chart 1).
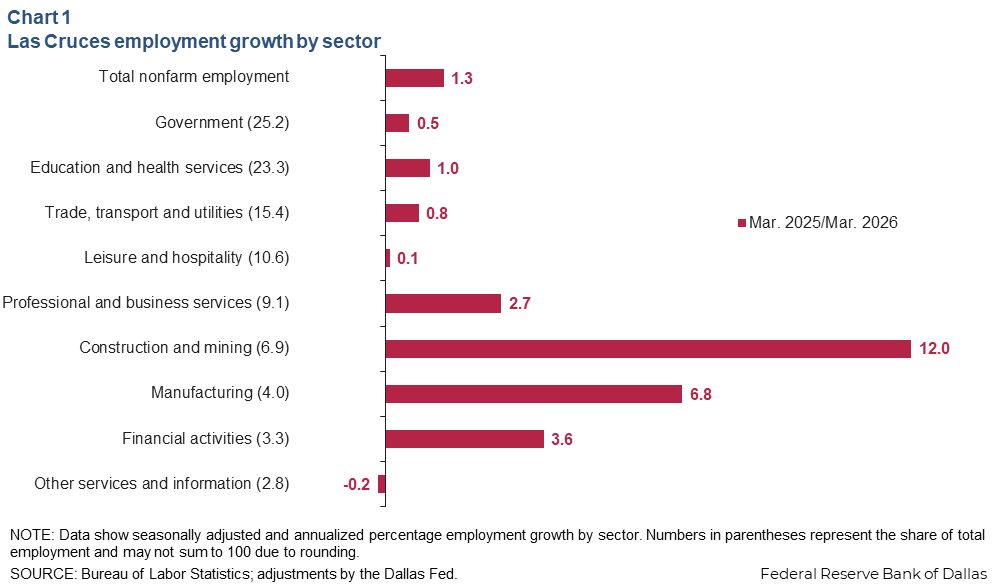
Employment growth was driven by gains in construction and mining (620 jobs), manufacturing (210 jobs), and education and health services (190 jobs).
Unemployment ticks up
The unemployment rate in Las Cruces increased to 5.4 percent in February from 5.0 percent in November 2025 (Chart 2). New Mexico’s unemployment rate increased to 4.7 percent from 4.3 percent over the same time. U.S. unemployment decreased to 4.3 percent in March from 4.4 percent in December 2025.
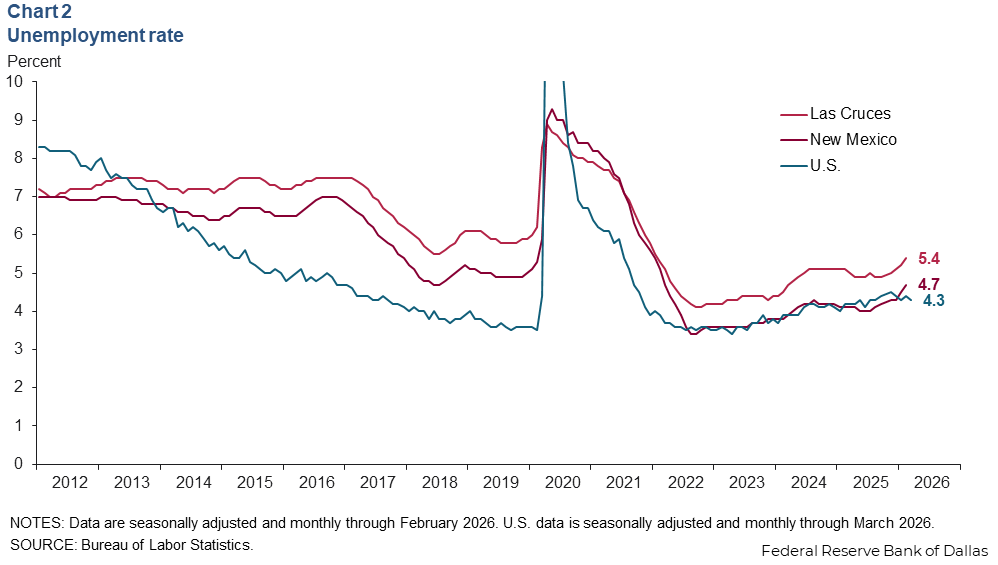
Year over year, unemployment in Las Cruces has increased from 5.1 percent in February 2025.
Wages decline
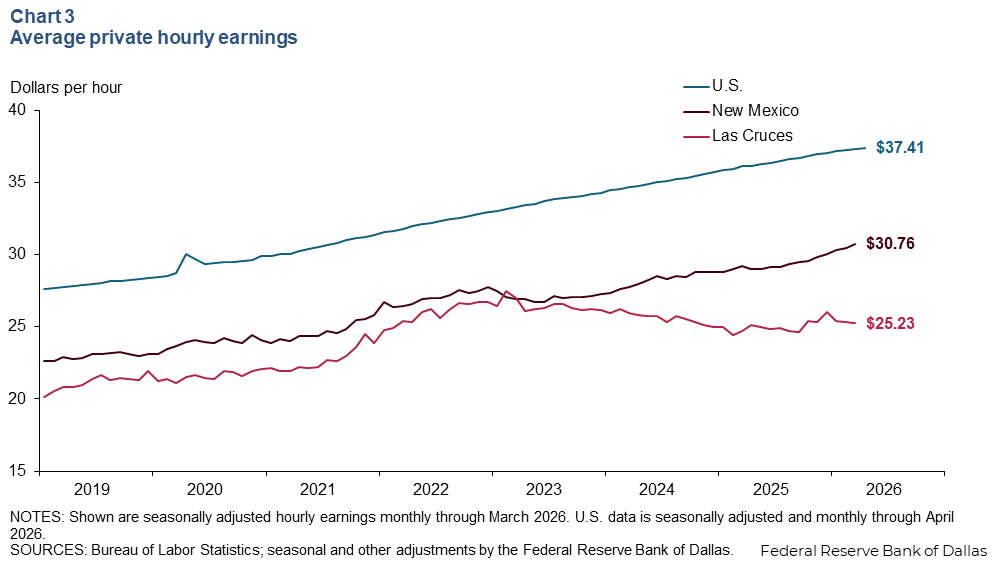
Average nominal hourly wages declined slightly to $25.23 in March from $26.06 in December 2025, a 3.2 percent decrease (Chart 3). Year over year, wages in Las Cruces increased 2.2 percent. Average hourly wages in New Mexico were $30.76 per hour in March. The national average hourly wage was $37.41 per hour in April.
Energy and commodities
Crude oil production increases
New Mexico’s production of crude oil increased to 2.3 million barrels per day (mb/d) in February 2026 (Chart 4). This is a recovery from a pullback in oil production that occurred from October 2025 through January 2026 when crude production fell from 2.3 mb/d to 2.1 mb/d. The rig count in New Mexico was 101 in April, unchanged from three months prior.
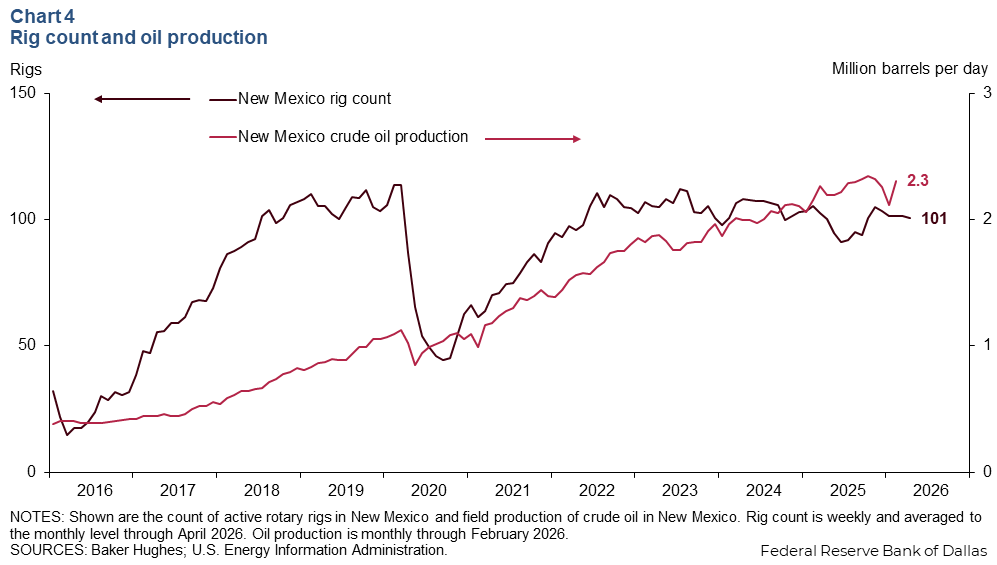
Current high oil prices may provoke a modest increase in crude oil production by year end, but this is highly dependent on producer confidence that high oil prices will persist.
Copper prices reach new highs
In addition to oil and natural gas, southern New Mexico also produces commodities such as potassium chloride and copper. The three-week moving average of copper spot prices increased to $5.94 the week of April 24 from $5.62 the week of March 27 (Chart 5). Year over year, copper prices have increased 29.6 percent.
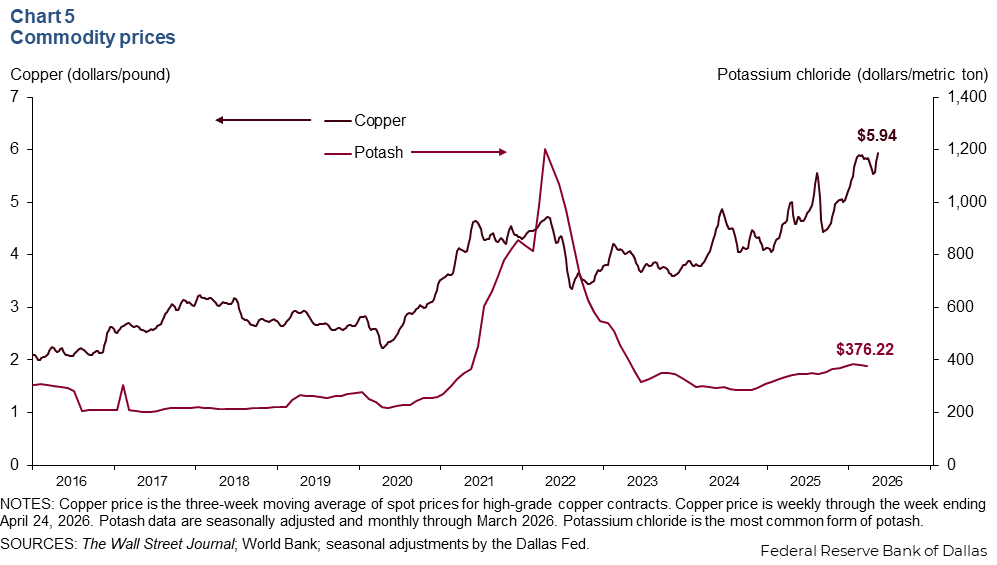
Potassium chloride is a form of potash and is commonly used in fertilizer. Potassium chloride prices ticked down to $376.22 per metric ton in March from $378.45 in December 2025. Year over year, potash prices have increased 12.8 percent.
Notes
Data may not match previously published numbers due to revisions. All New Mexico counties within the Federal Reserve’s Eleventh District are counted as part of southern New Mexico.
NOTE: Data may not match previously published numbers due to revisions.
About Southern New Mexico Economic Indicators
Questions or suggestions can be addressed to Robert Leigh. Southern New Mexico Economic Indicators is released quarterly.