Texas Economic Indicators

Texas economic growth remained robust in February. The state posted strong job gains, and unemployment remained low. The Texas Leading Index ticked down following several months of strong growth. Home inventories remained low, and home sales rose in the month, while indicators of residential construction were mixed.
Labor Market
Employment Growth Solid
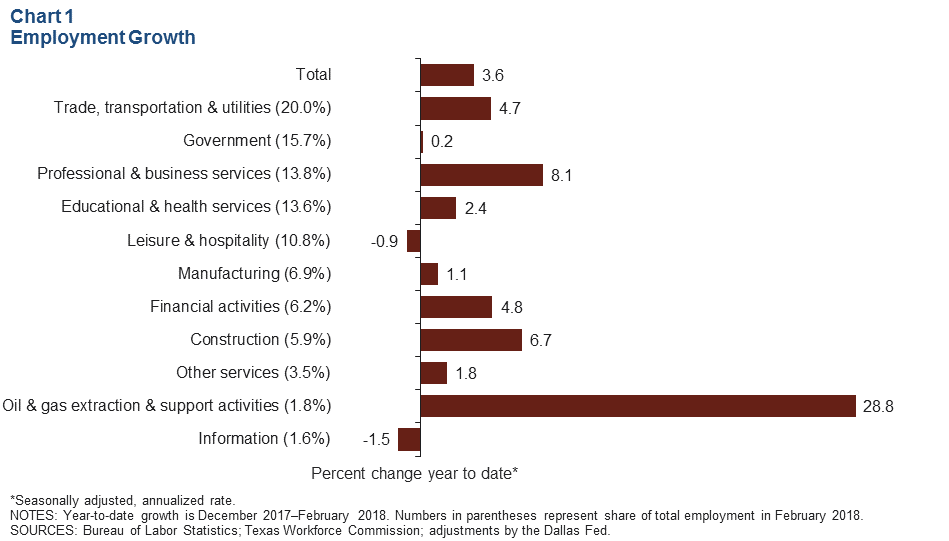
Texas employment expanded an annualized 3.2 percent in February after posting an upwardly revised 4.0 percent growth rate in January. The Dallas Fed’s Texas Employment Forecast suggests 3.4 percent job growth in 2018 (December/December).
Employment in almost all sectors has expanded through February (Chart 1). Payrolls in the energy sector skyrocketed 42.3 percent in February following 16.6 percent growth in January. The industry has grown an annualized 28.8 percent so far this year, up from 12.7 percent expansion in 2017. The leisure and hospitality, government and information sectors all shed employment by more than 3 percent in February after expanding in January.
Payrolls expanded in all major metros in both January and February. Jobs in Austin soared 7.2 percent in February, the strongest increase among the major metros. San Antonio posted 1.6 percent job growth in the month, the slowest among the major metros.
Unemployment Remains Low
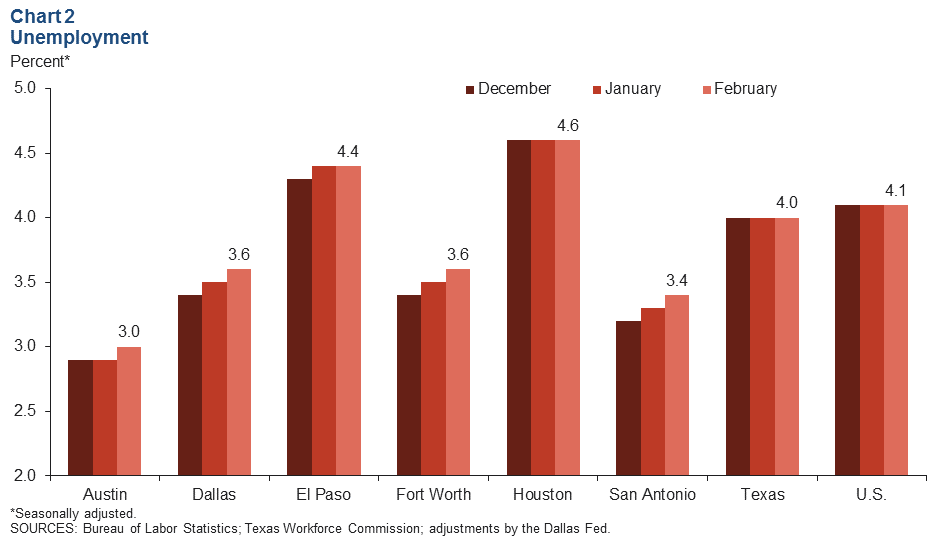
The Texas unemployment rate held steady at 4.0 percent for the third consecutive month in February, near a four-decade low (Chart 2). Unemployment ticked up in Austin, Dallas, Fort Worth and San Antonio last month but was stable in El Paso and Houston.
Texas Leading Index
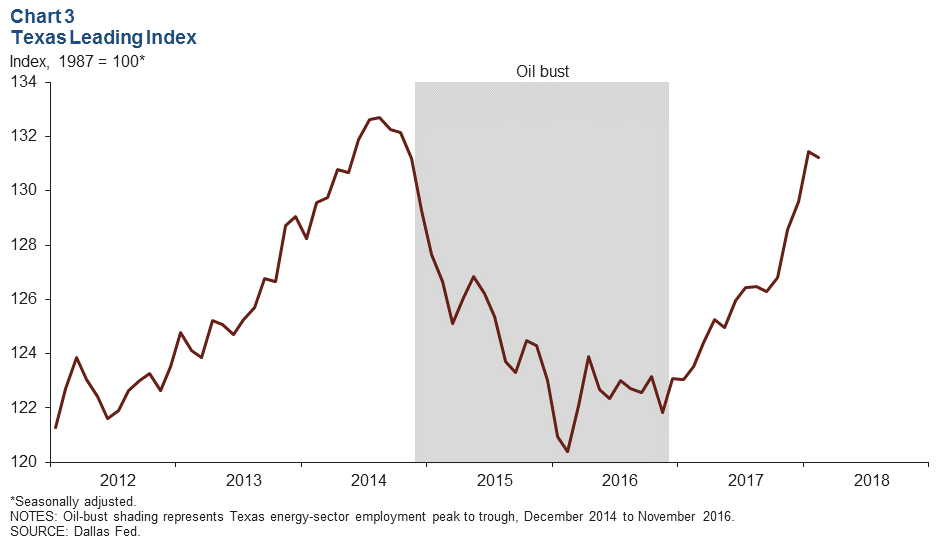
The Texas Leading Index, a composite of eight indicators that tend to change direction before the overall economy does, sheds light on the future of the state’s economy. In February, the estimated value of the index dipped 0.2 percent following four months of expansion, but its three-month growth was 2.1 percent (Chart 3). The Texas Leading Index is 1.1 percent below its oil-boom peak in August 2014.
Population Change
For every 1,000 Texas residents in 2016, there were an additional 14.3 residents in 2017 (Chart 4). Natural increase, measured as births minus deaths, accounted for 7.5 of these new residents, net international migration accounted for 4.0 residents, and net domestic migration accounted for 2.8 residents.
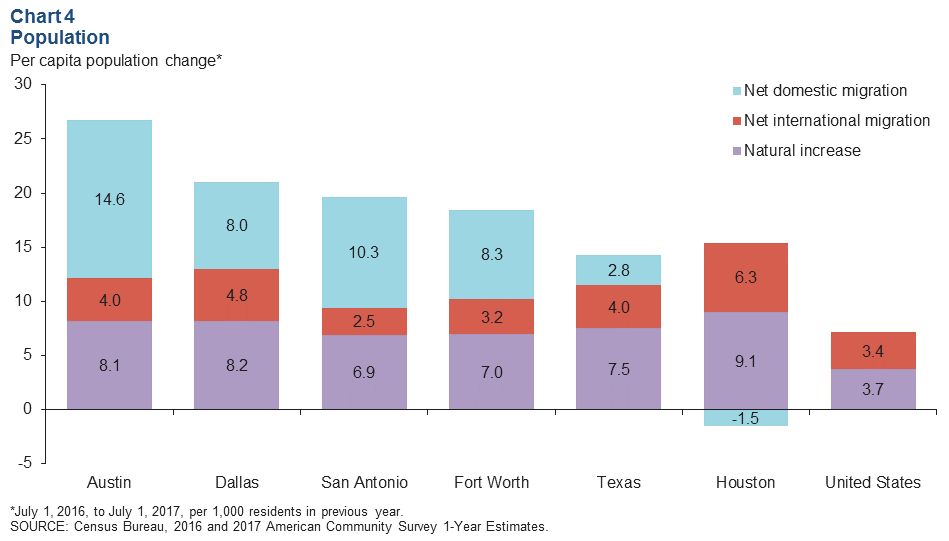
Austin’s population growth of 26.8 new residents per 1,000 existing residents was the highest per capita population increase among the major Texas metros in 2017. The increase was driven by strong net domestic migration. Houston had the highest per capita natural increase and net international migration among the major metros, though it lost domestic migrants on net during the year. All the major Texas metros had higher rates of natural increase than the U.S., and all but San Antonio and Fort Worth had higher rates of net international migration.
Housing Market
Home Inventories Hold Steady at Record-Low Levels
Texas and U.S. home inventories are both at historic lows, well below the six months of inventory considered balanced (Chart 5). Texas home inventories reached a new low of 3.4 months’ supply in January and held steady in February. U.S. home inventories reached a low point of 3.6 months in November and ticked up to 3.7 months in February. Among major Texas metros, Fort Worth had the lowest supply at 1.9 months, while Houston had the highest at 3.6 months.
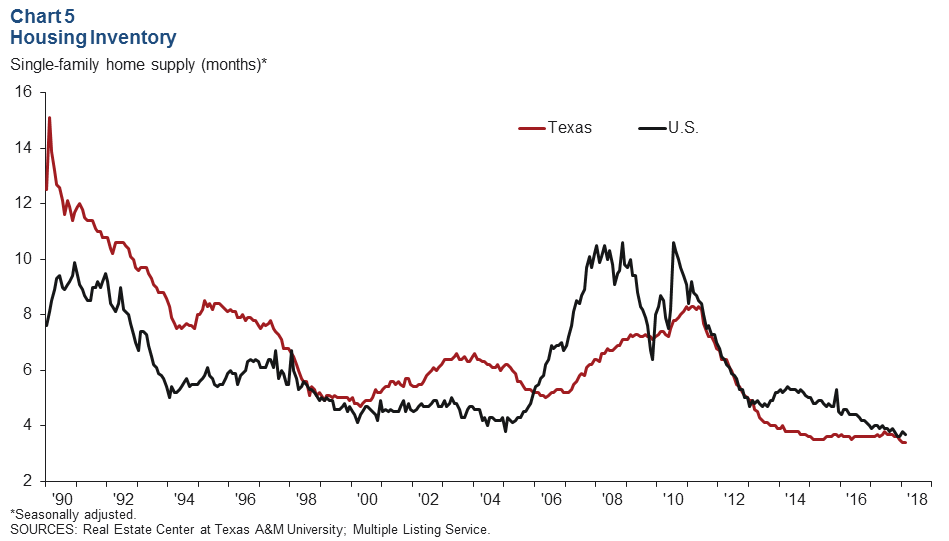
Texas’ existing-home sales rose 2.7 percent in February and have grown 2.1 percent year to date compared with the same period in 2017. The median existing-home sales price in Texas inched up 0.3 percent and was 2.9 percent above year-ago levels in February.
Residential Construction Activity Mixed
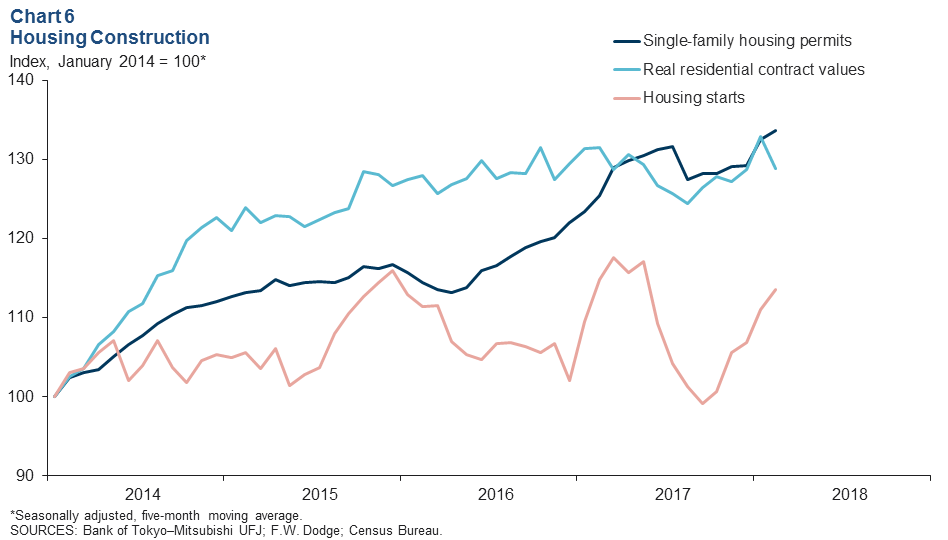
Indicators of Texas housing construction activity varied in February (Chart 6). The five-month moving average of single-family housing permits edged up 0.9 percent in the month, and total permits issued so far in 2018 are 5.2 percent higher than the same period in 2017. The five-month moving average of housing starts expanded 2.2 percent in the month; however, year to date, there have been 11.9 percent fewer housing starts than the same period in 2017. The five-month moving average of residential construction contract values dropped 3.1 percent in the month; year to date, the total value is 1.3 percent lower than the same period last year.
NOTE: Data may not match previously published numbers due to revisions.
About Texas Economic Indicators
Questions can be addressed to Stephanie Gullo at stephanie.gullo@dal.frb.org. Texas Economic Indicators is published every month on the Monday after Texas employment data are released.