Texas Economic Indicators

January 27, 2020
The Texas economy continued to grow in December, with payrolls expanding at an above-average pace. The unemployment rate increased for the first time since January 2019. The Texas Leading Index fell, and single-family home inventories tightened. Construction contract values ticked down. Migration to Texas between July 2018 and July 2019 increased.
Labor Market
Job Growth Solid in December
Texas employment grew an annualized 2.6 percent in December, following a downwardly revised 3.8 percent in November (Chart 1). Growth remains above Texas’ long-run average pace of 2.1 percent. U.S. payrolls also expanded during the month, though at less than half the pace of Texas.
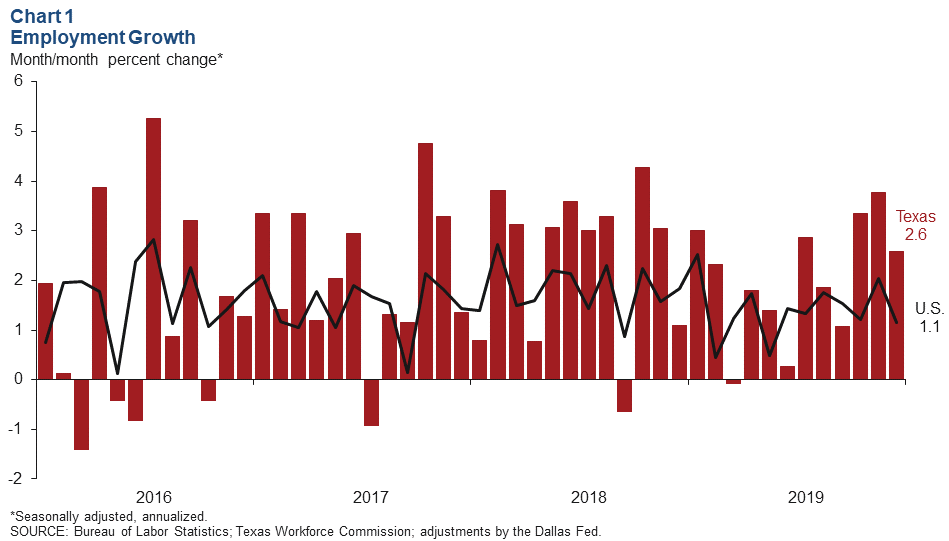
December job growth was strongest in Austin and Dallas, expanding at an annualized rate of 8.4 percent and 6.2 percent, respectively. All other major metros posted modest growth in the month except Fort Worth, which shed jobs.
Unemployment Inches Up
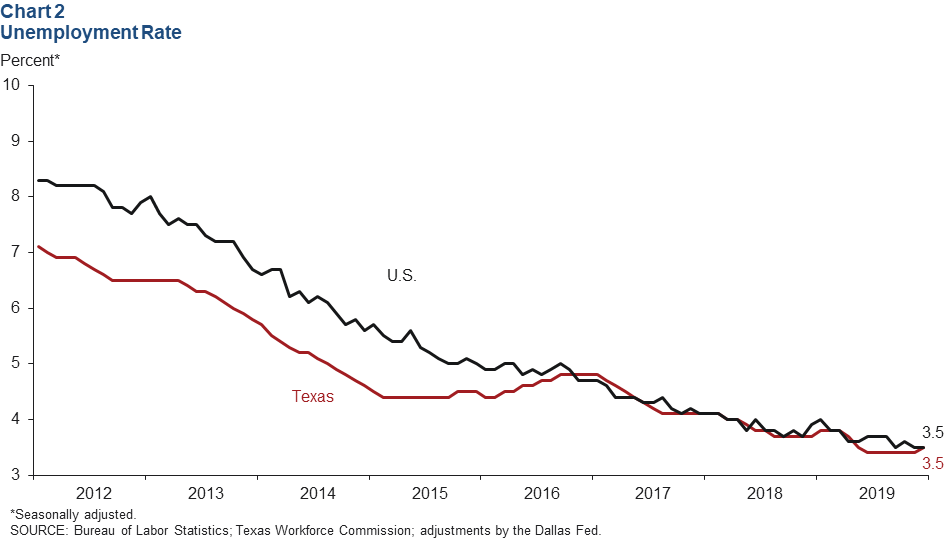
The Texas unemployment rate edged up to 3.5 percent after holding steady at 3.4 percent for six months, while the U.S. unemployment rate stayed flat at a 50-year low of 3.5 percent (Chart 2).
Unemployment fell by roughly 0.1 percentage points in most major metros except McAllen, where it ticked up 0.1 percentage points.
Texas Leading Index
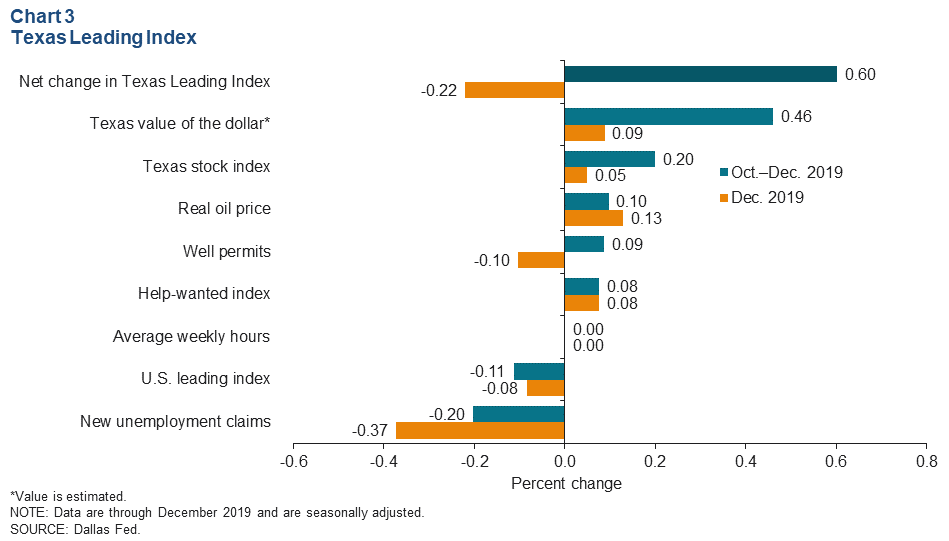
The Texas Leading Index, which is used to estimate the Dallas Fed’s Texas Employment Forecast, sheds light on the future of the state's economy. After increasing 0.8 percent in November, the index fell 0.2 percent in December. The three-month change, however, held steady at 0.6 percent (Chart 3). In December, new unemployment claims, well permits and the U.S. leading index were drags on the Texas Leading Index, while average weekly hours made no significant contribution. All other components boosted the index.
Real Estate
Home Inventories Tighten in December
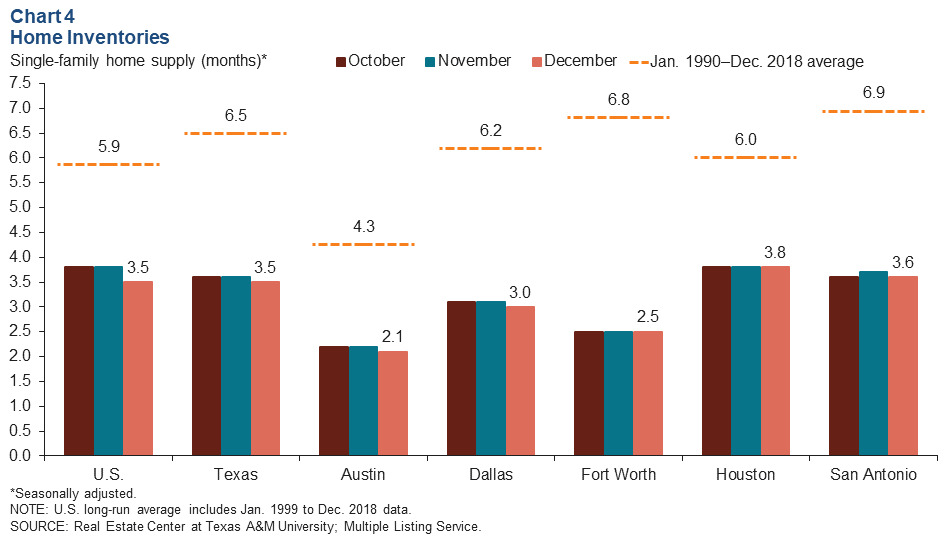
Single-family home inventories fell to 3.5 months of supply in the U.S. and Texas in December (Chart 4). Inventories in most Texas major metros also dipped last month, with the exception of Fort Worth and Houston, which held steady at 2.5 months and 3.8 months, respectively. Inventories are below their long-run averages in the U.S. and Texas and its major metros—partly due to solid demand.
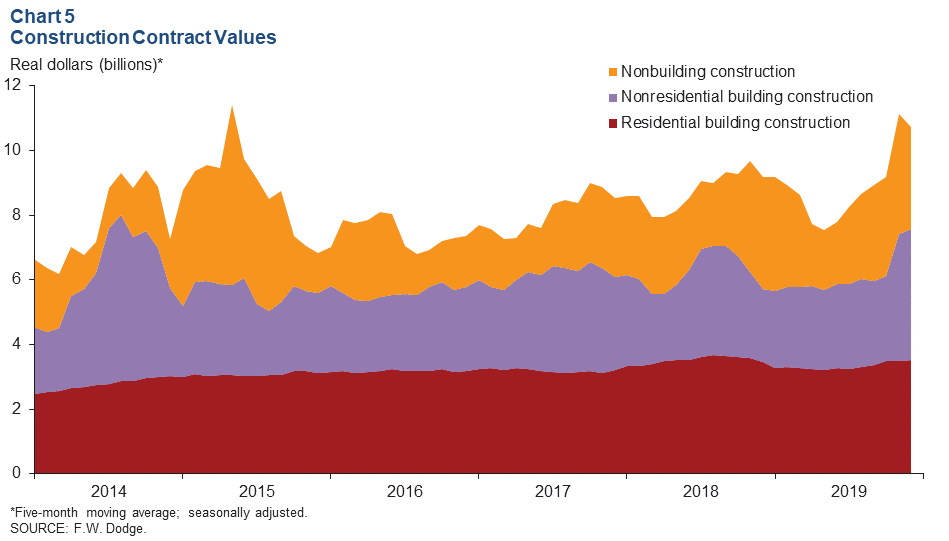
Total Construction Contract Values Grow Robustly at Year-end
The five-month moving average of construction contract values slipped 3.7 percent in December, following strong gains in November (Chart 5). This dip is due to the 15.6 percent decline in nonbuilding construction values in December, following 21.6 percent growth in November. In 2019, total construction values in Texas increased 4.2 percent relative to their 2018 values. The majority of this increase came from the 19.1 percent growth in nonresidential building construction. Nonbuilding construction remained mostly flat with 0.4 percent growth over the year, and residential building construction slipped 4.3 percent. Total construction amounts in December were 28.6 percent higher than the long-run average of $6.2 billion.
Migration
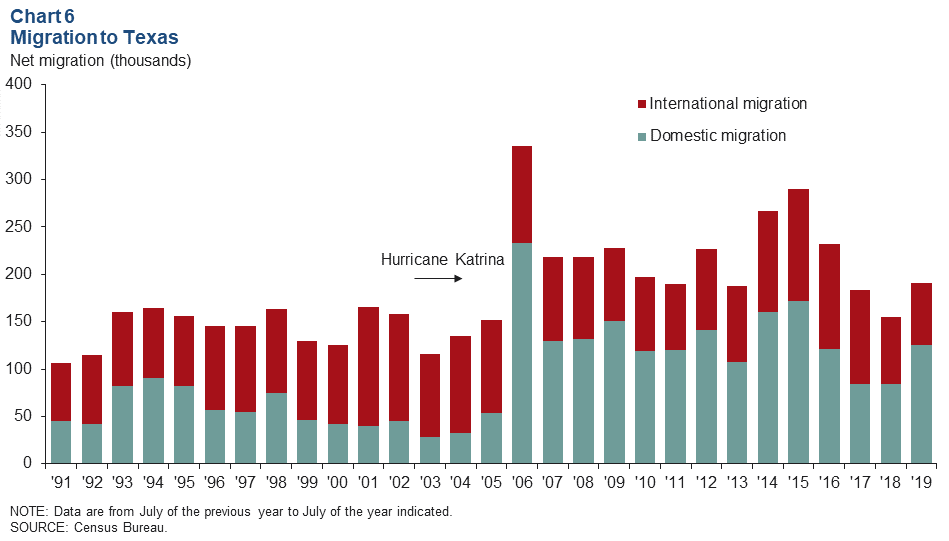
From July 2018 to July 2019, Texas grew by 367,000 people, with more than half the increase stemming from migration from other states (domestic) or other countries (international) (Chart 6). The other large contributor to net growth in the state during that period was natural increase— births minus deaths—which added 176,000 people. Net domestic migration to Texas climbed 50.0 percent from July 2018 to July 2019 to 126,000, while net international migration slipped 8.7 percent to 65,000—its lowest level since 1991. Overall, Texas has consistently benefited from net in-migration. Domestic in-migration has outpaced international almost every year since 2006 with the exception of 2017. In 2006, Texas saw its largest spike in net domestic migration as many people affected by Hurricane Katrina relocated from Louisiana to Texas.
NOTE: Data may not match previously published numbers due to revisions.
About Texas Economic Indicators
Questions can be addressed to Carlee Crocker at carlee.crocker@dal.frb.org. Texas Economic Indicators is published every month on the Monday after Texas employment data are released.