Texas Economic Indicators

July 21, 2020
The Texas economy showed continued signs of recovery in June, as payrolls grew, and the unemployment rate dipped. High-frequency data, however, point to weakening activity since mid-June. Oil prices rose, and natural gas prices slipped slightly in the week ending July 17. Texas exports dropped for the third month in a row in May. Construction contract values in Texas recovered slightly in May but dipped again in June.
Labor Market
Texas Job Recovery Concentrated in Service Sector
Texas employment grew a nonannualized 1.5 percent in June after upwardly revised growth of 2.9 percent in May (Chart 1). Texas employment has partially recovered since plummeting in March and April, with growth concentrated in the service-providing sector. Still, service-providing employment in June was 6.1 percent below its peak in February. The recent growth suggests that many service-sector workers who were laid off or furloughed in March and April were back to work in May and June. High-frequency data suggest that this trend is reversing as establishments reduce capacity or close again following a statewide surge in COVID-19 cases and hospitalizations. Employment in the goods-producing sector saw a less-severe decline in April, followed by weak growth in May and a slight contraction in June. Goods-producing employment in June was 6.3 percent below its peak in February.
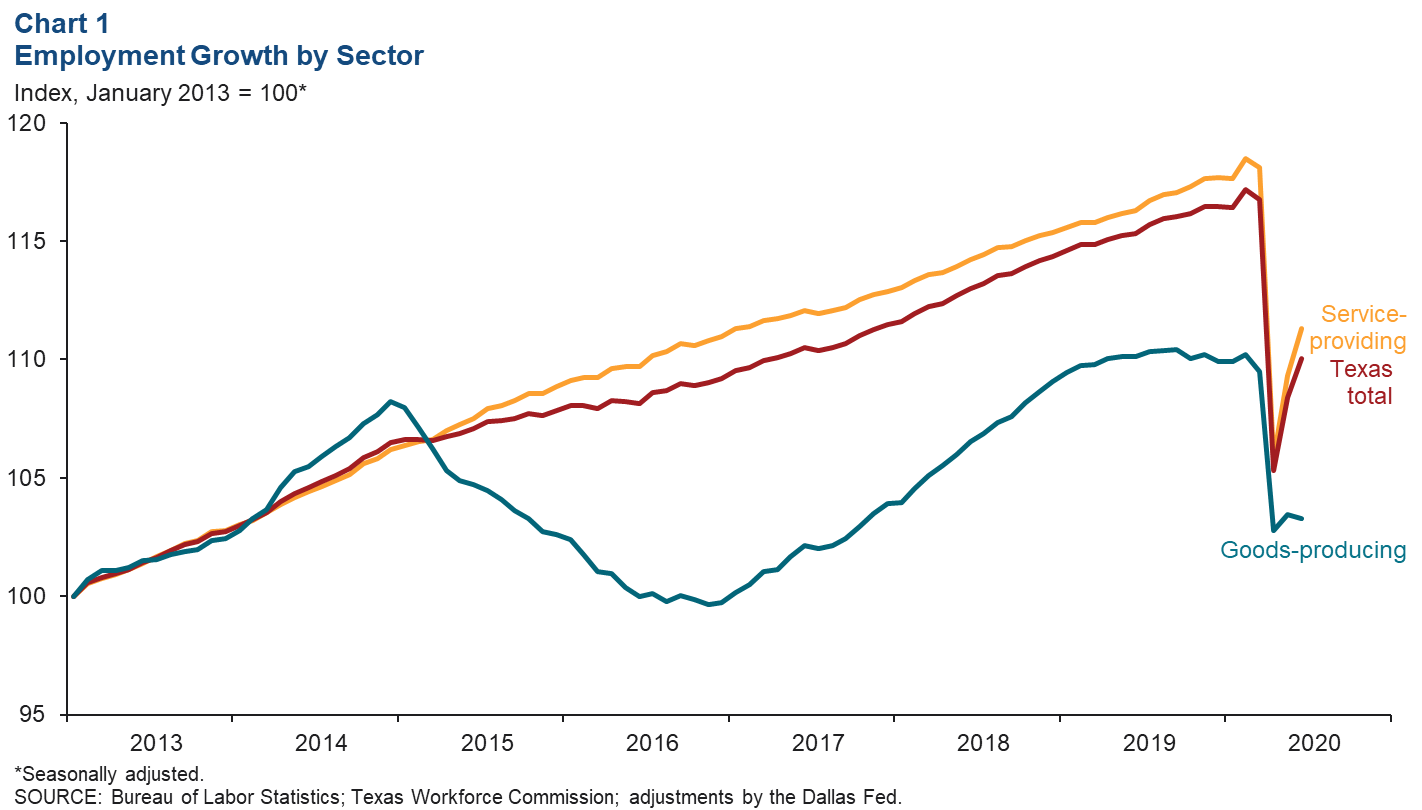
U.S. payrolls also grew in June, climbing a nonannualized 3.6 percent after upwardly revised growth of 2.1 percent in May. The Texas unemployment rate ticked down to 8.6 percent in June, and the U.S. rate fell to 11.1 percent.
Texas Job Growth Slower than the Nation
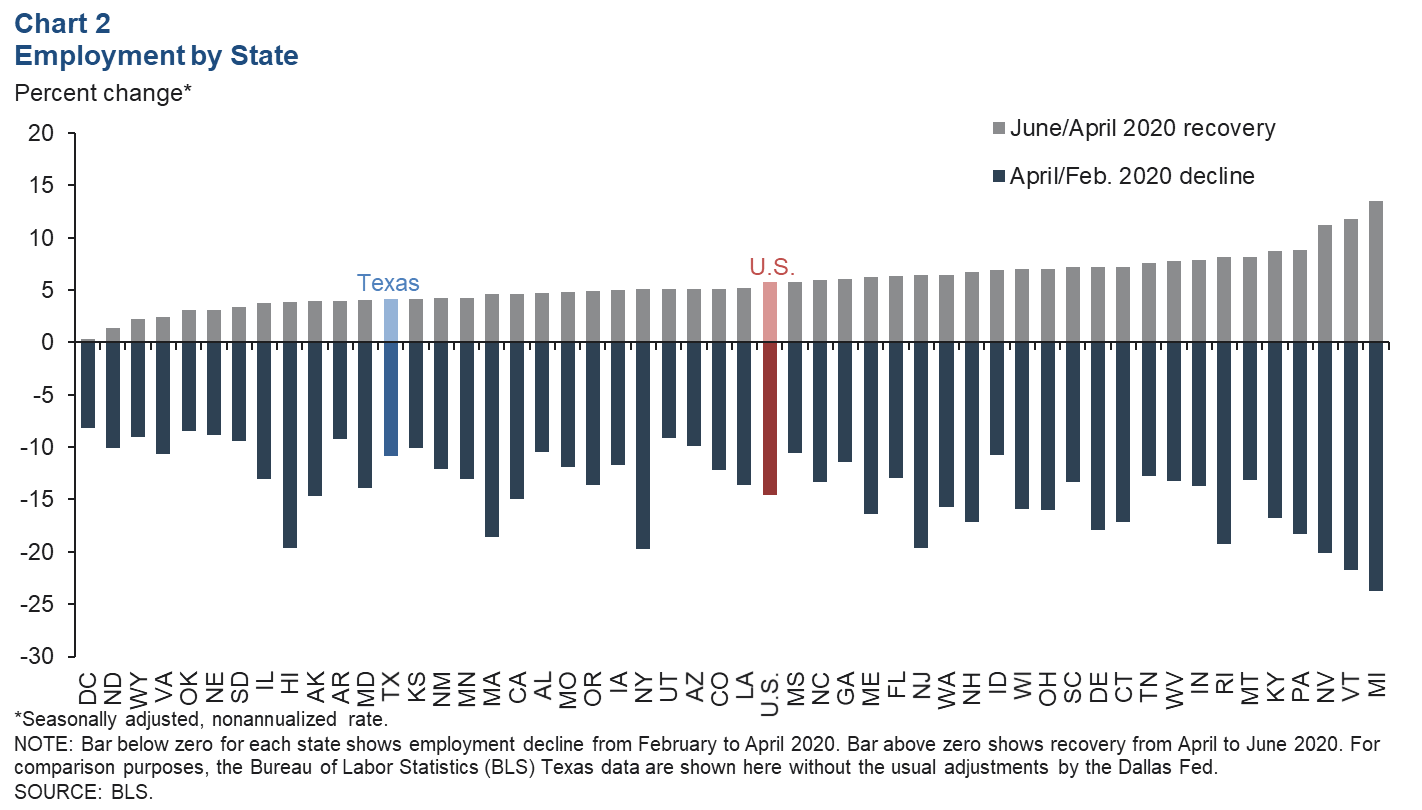
Employment contracted in Texas from February to April, though declines were less severe compared with other states (Chart 2). After the two-month decline, Texas’ job recovery from April through June has been slower than the national average. Most of the country saw a similar pattern of contraction and growth from February to June, outside of Hawaii and the District of Columbia, where employment fell in May.
Texas Business-Cycle Index
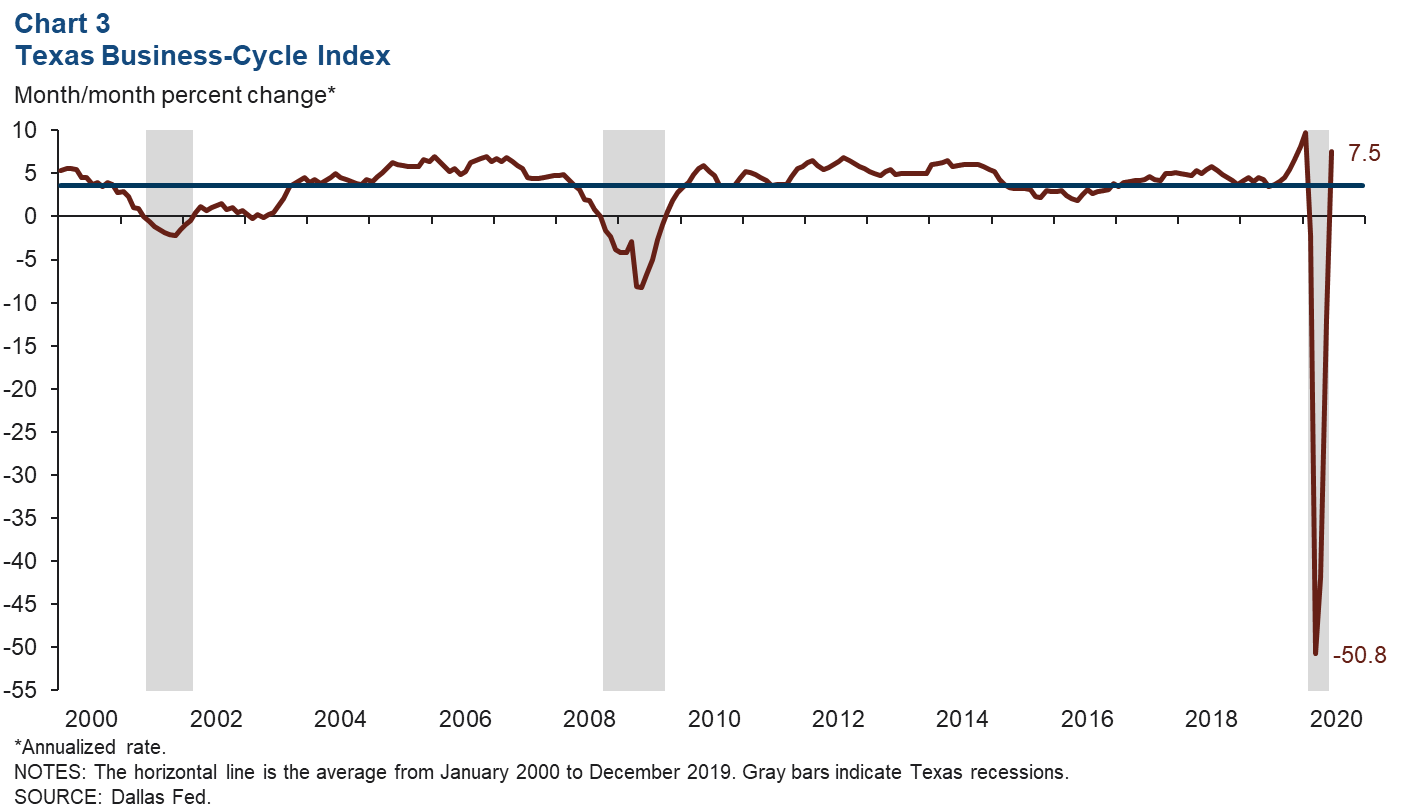
The Texas Business-Cycle Index, a composite of the unemployment rate, state payroll employment and gross state product, measures underlying economic activity in the state. Heightenend uncertainty due to the COVID-19 pandemic followed by an economic shutdown beginning in mid-March led to unprecedented declines in the index, sharper than those seen in the dot-com bubble or the Great Recession (Chart 3). The rate of contraction peaked in March when the index slipped 50.8 percent. The index continued to decline in April and May, though at a slower pace. In June, the index grew for the first time since January; however, it remains 7.4 percent below year-ago levels.
Energy
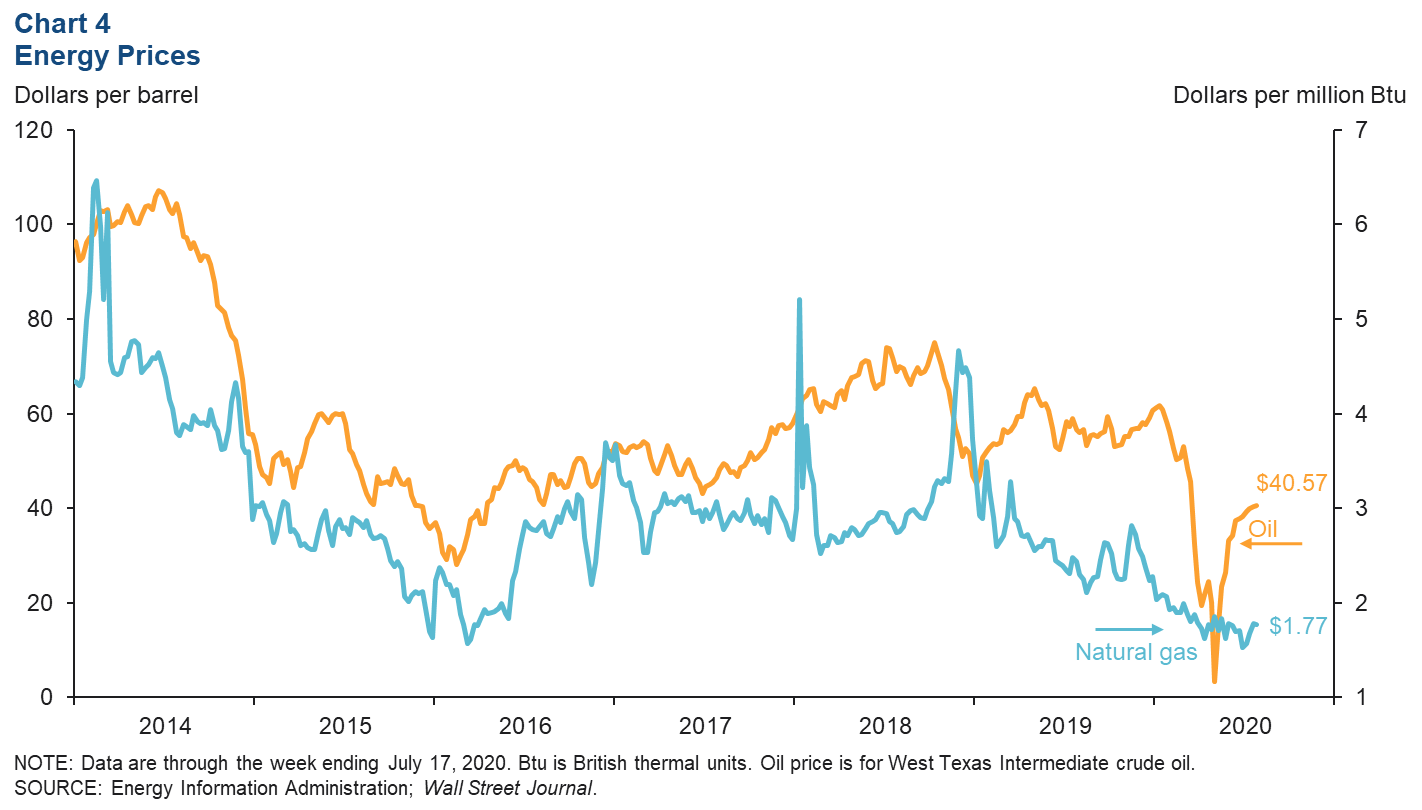
At the onset of the coronavirus pandemic, oil prices consistently fell, while the number of people diagnosed with COVID-19 rose around the world. In late April, however, oil prices bottomed out and then began to recover, even as the COVID-19 case count continued to increase steadily (Chart 4). Oil prices recovered throughout May and have stablilized since. Natural gas prices have trended down over the long term before the COVID-19 pandemic. Since the outbreak, however, prices have hovered just under $2 per million British thermal units. In the week ending July 17, prices ticked down.
Exports
Texas exports in May fell for the third month in a row, sliding 18.2 percent (Chart 5). Hardest hit were manufacturing exports, followed by mining, which fell 19.6 percent and 17.8 percent, respectively. Agriculture exports grew modestly, climbing 4.7 percent. When compared with the impact of the Great Recession on exports in 2008–09, this pandemic has caused a much sharper decline in mining, manufacturing and total exports, while agriculture exports have been less impacted.
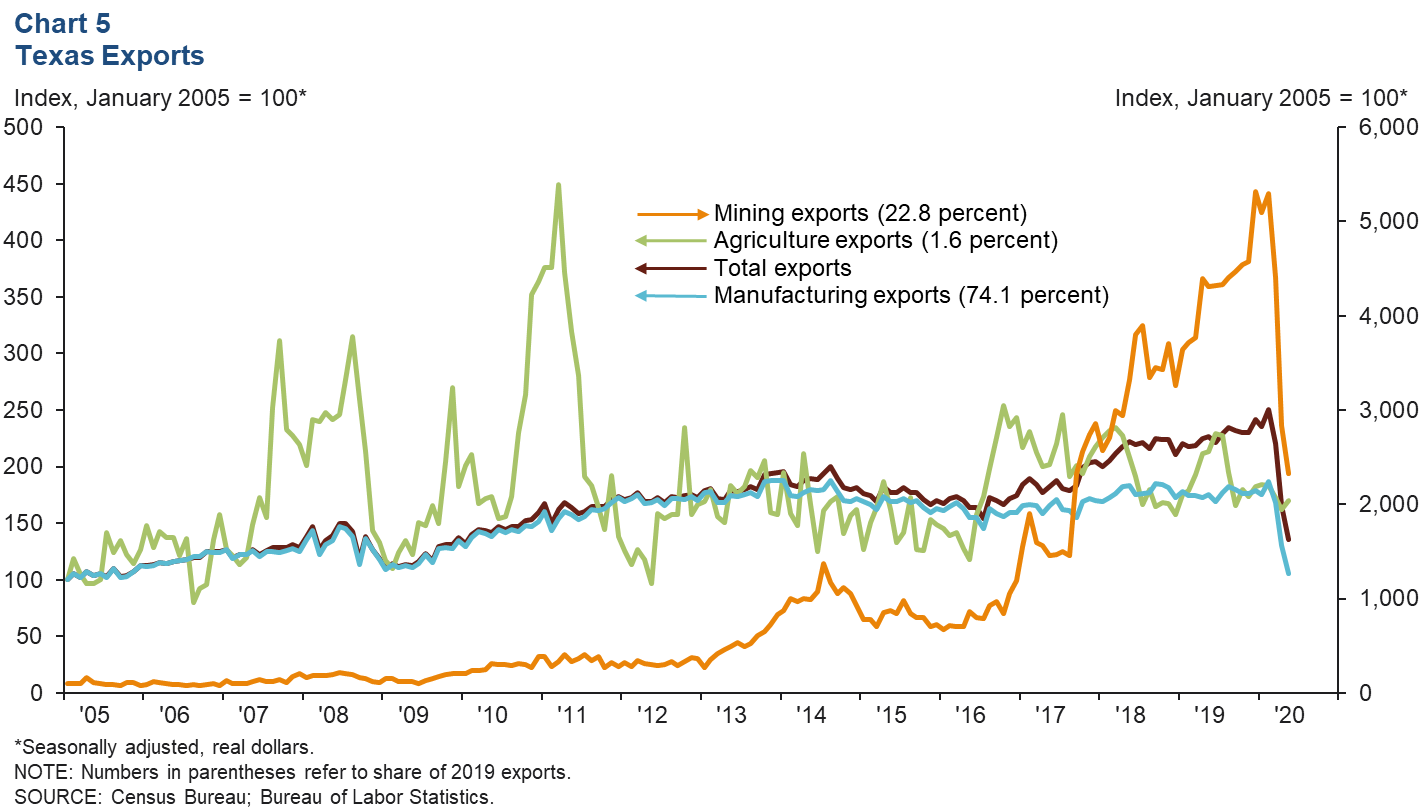
The May decline in Texas exports was mostly broad based except for exports to China, which increased 76.0 percent. U.S. exports also fell in May, though the 8.5 percent decline was more muted relative to Texas.
Construction
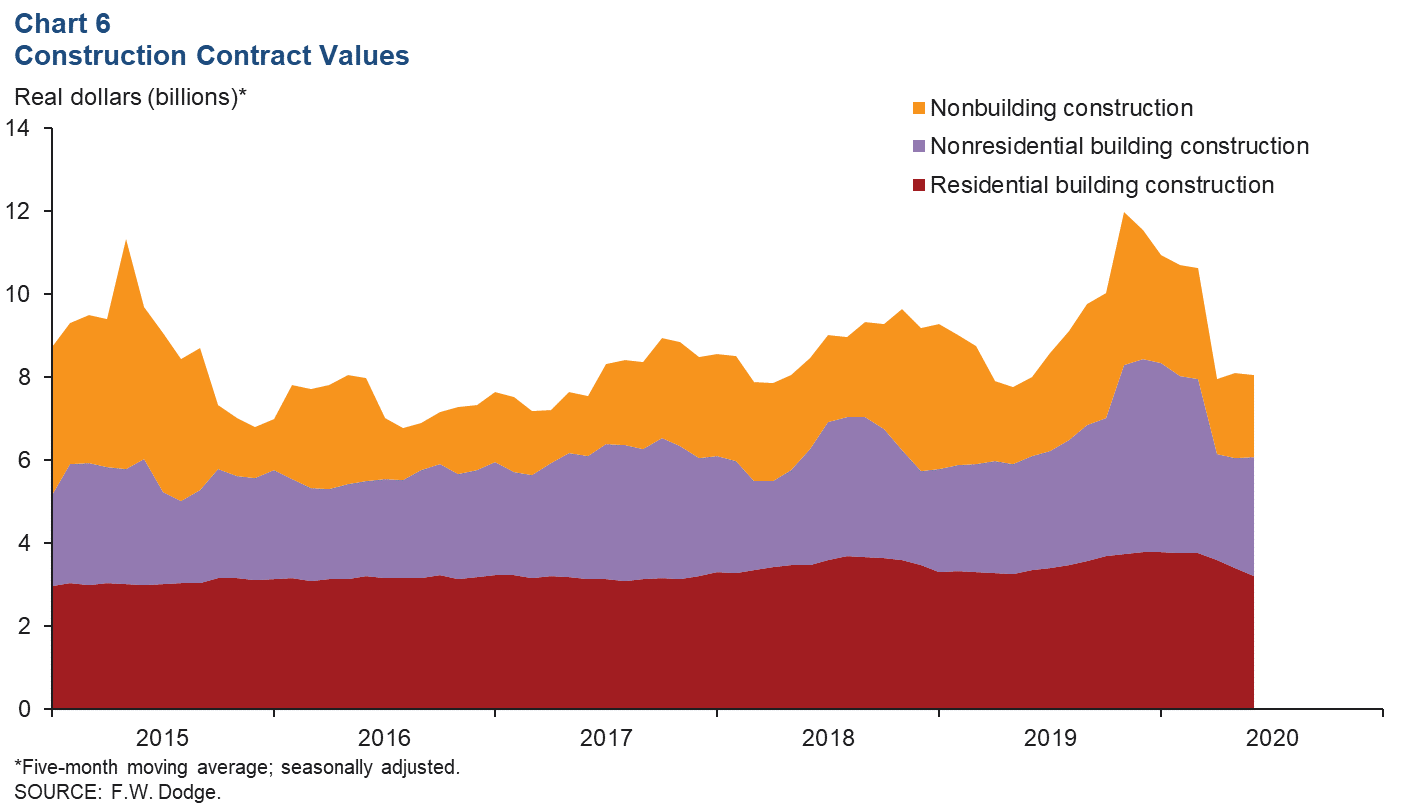
The five-month moving average of Texas total construction saw its steepest decline in April since late 1975 but recovered slightly in May and inched down in June (Chart 6). The growth in May was due to increases in nonresidential and nonbuilding construction contract values, which more than offset the contraction in residential building. In June, declines in nonbuilding and residential construction were a drag on total contract values. Despite growth in the five-month moving average of nonresidential building construction in June, year-to-date values were 3.6 percent lower than the same period in 2019. Through June, residential and nonbuilding construction contract values were below 2019 levels by 0.1 percent and 0.8 percent, respectively.
NOTE: Data may not match previously published numbers due to revisions.
About Texas Economic Indicators
Questions can be addressed to Carlee Crocker at carlee.crocker@dal.frb.org. Texas Economic Indicators is published every month on the Monday after Texas employment data are released.