Texas Economic Indicators

August 25, 2020
The Texas economy showed continued signs of expansion in July, though the pace slowed from June’s robust growth. Payrolls across the state edged up and the unemployment rate dipped. The Texas Leading Index continued to grow. Service and retail revenue indexes contracted in July as the COVID-19 pandemic lingered, while the manufacturing production index inched up, according to the Texas Business Outlook Surveys. Texas exports rose in June, though not enough to result in an increase in the three-month moving average, and in early August, overall credit and debit card spending had largely recovered from its steep decline in March.
Labor Market
Employment Growth Mixed Across Metros
Texas employment rose a nonannualized 0.2 percent in July after posting downwardly revised growth of 1.2 percent in June (Chart 1). The July growth was not universal; both Houston and San Antonio shed jobs in July. Austin and El Paso saw growth of 1.2 percent and 0.9 percent, respectively. U.S. employment grew a nonannualized 1.3 percent in July, outpacing Texas growth for the second month in a row.
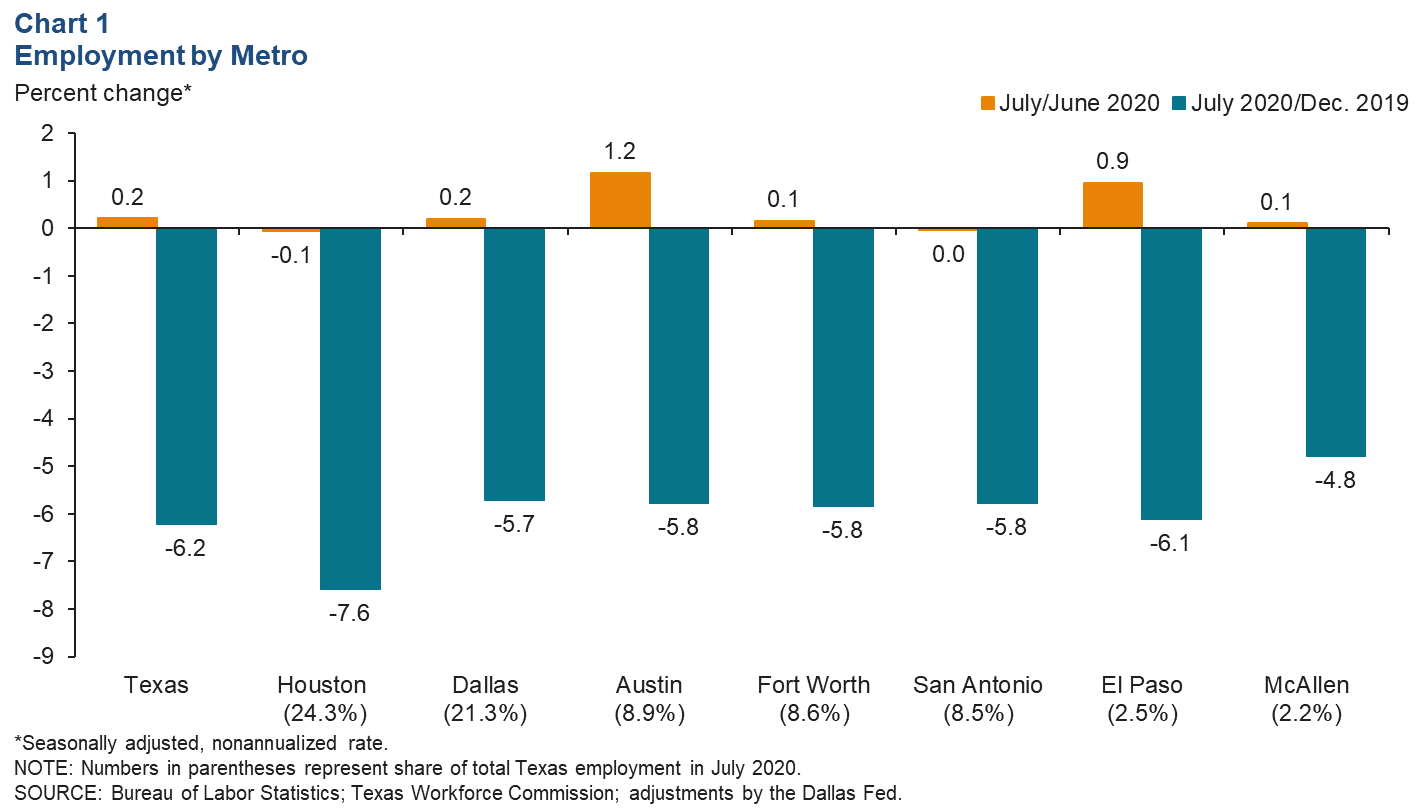
In Texas, employment in government grew the most, climbing a nonannualized 1.8 percent in July. Education and health services, professional and business services, financial activities and other services also added jobs. Trade, transportation and utilities, leisure and hospitality, manufacturing, construction and information all shed jobs. Employment contracted most sharply in oil and gas, which declined a nonannualized 1.1 percent.
Unemployment Continues to Fall
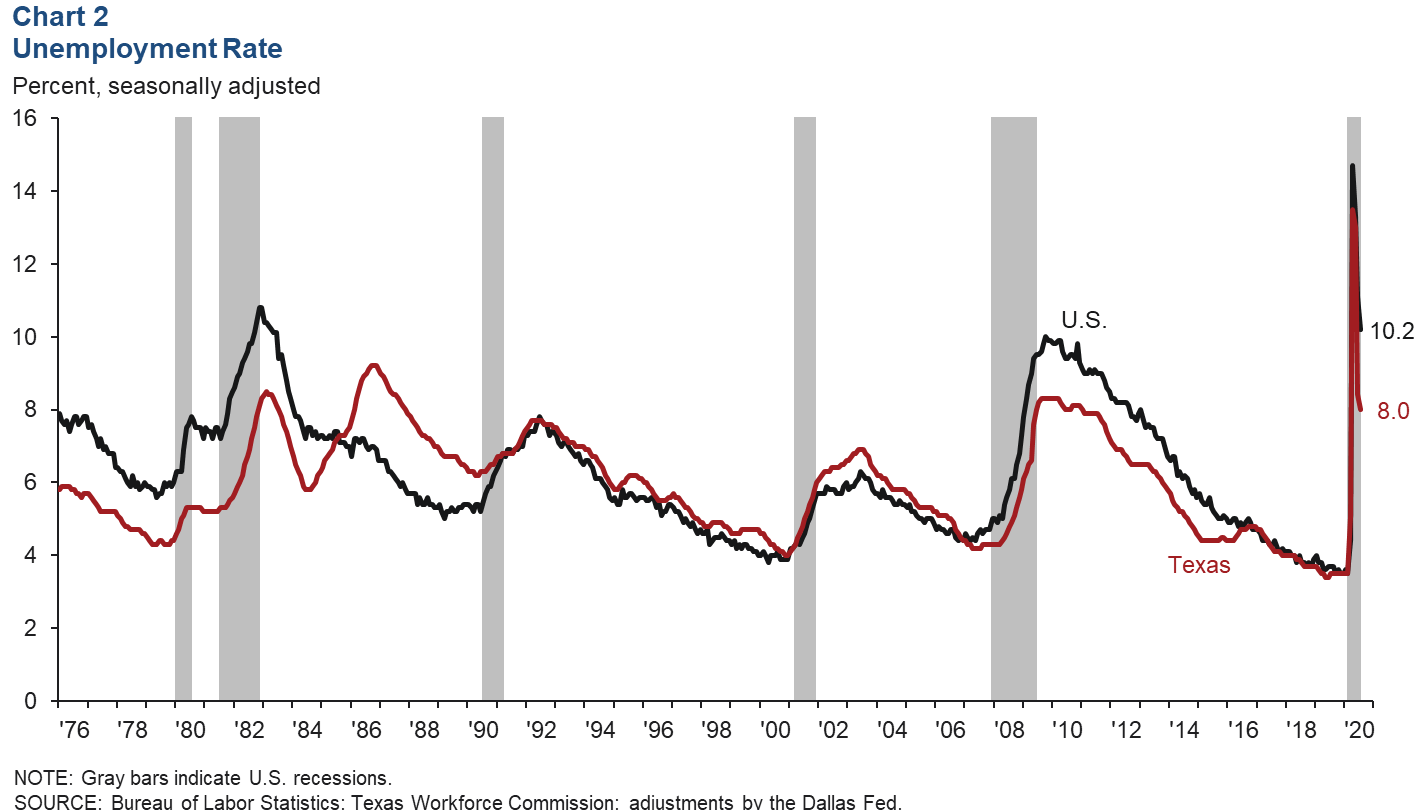
The Texas unemployment rate ticked down to 8.0 percent in July, continuing its recovery from a record high in April (Chart 2). U.S. unemployment also continued to decline in July and remains above the Texas rate at 10.2 percent. The rate of decline for both Texas and U.S. unemployment has slowed since June, particularly in Texas, which saw a 4.6 percentage-point decline in June followed by a 0.4 percentage-point drop in July. An increase in Texas initial unemployment claims in the week ending Aug. 15 suggests that the decline in the unemployment rate may continue to slow.
Texas Leading Index
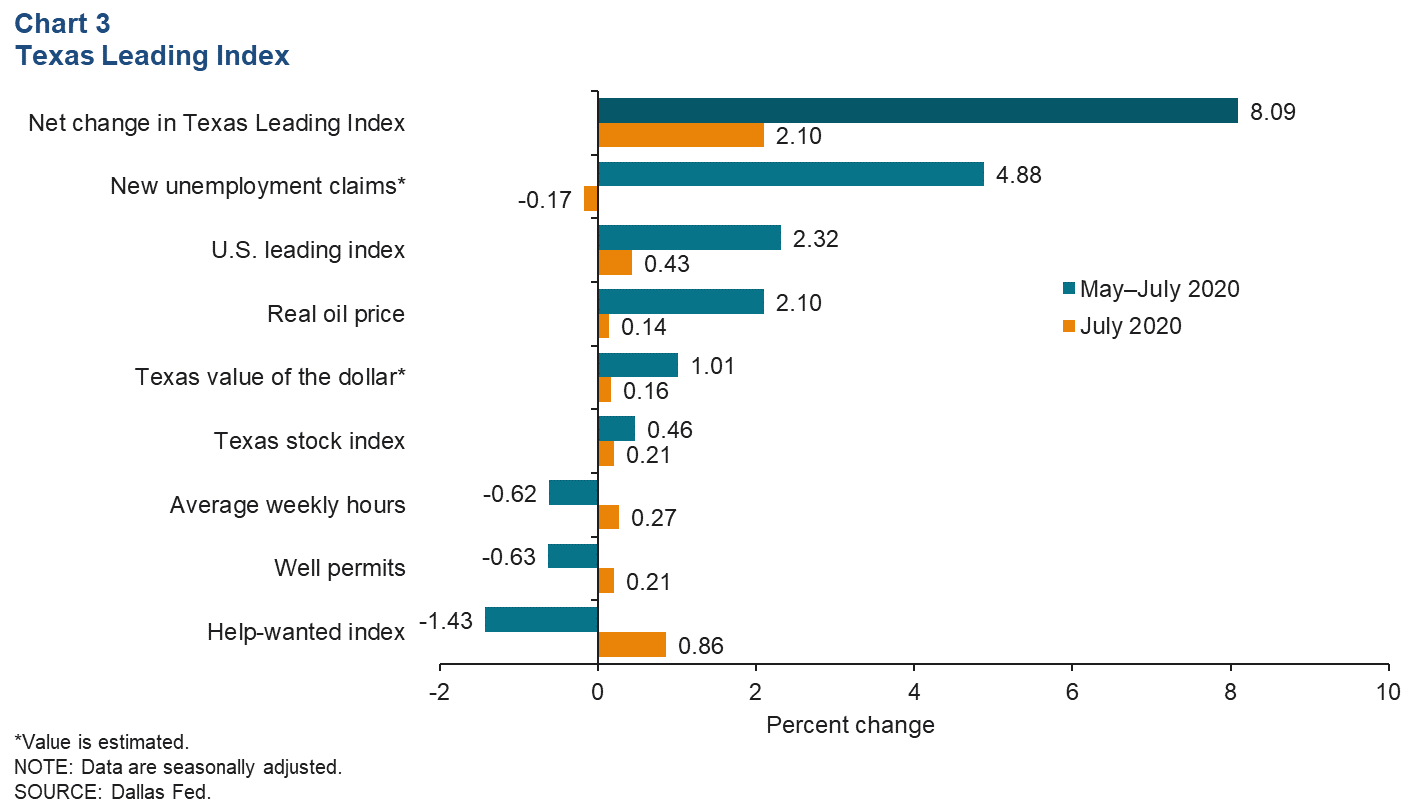
The Texas Leading Index, which is used to estimate the Dallas Fed’s Texas Employment Forecast, sheds light on the future of the state's economy. After declining for three months earlier this year, the index grew robustly from May to July (Chart 3). In July, only new unemployment claims were a drag on the index; all other components contributed positively. For the three months through July, average weekly hours, well permits and the help-wanted index all contracted. However, their drag was more than offset by the other components, especially new unemployment claims, which had strong positive contributions in May and June.
Texas Business Outlook Surveys
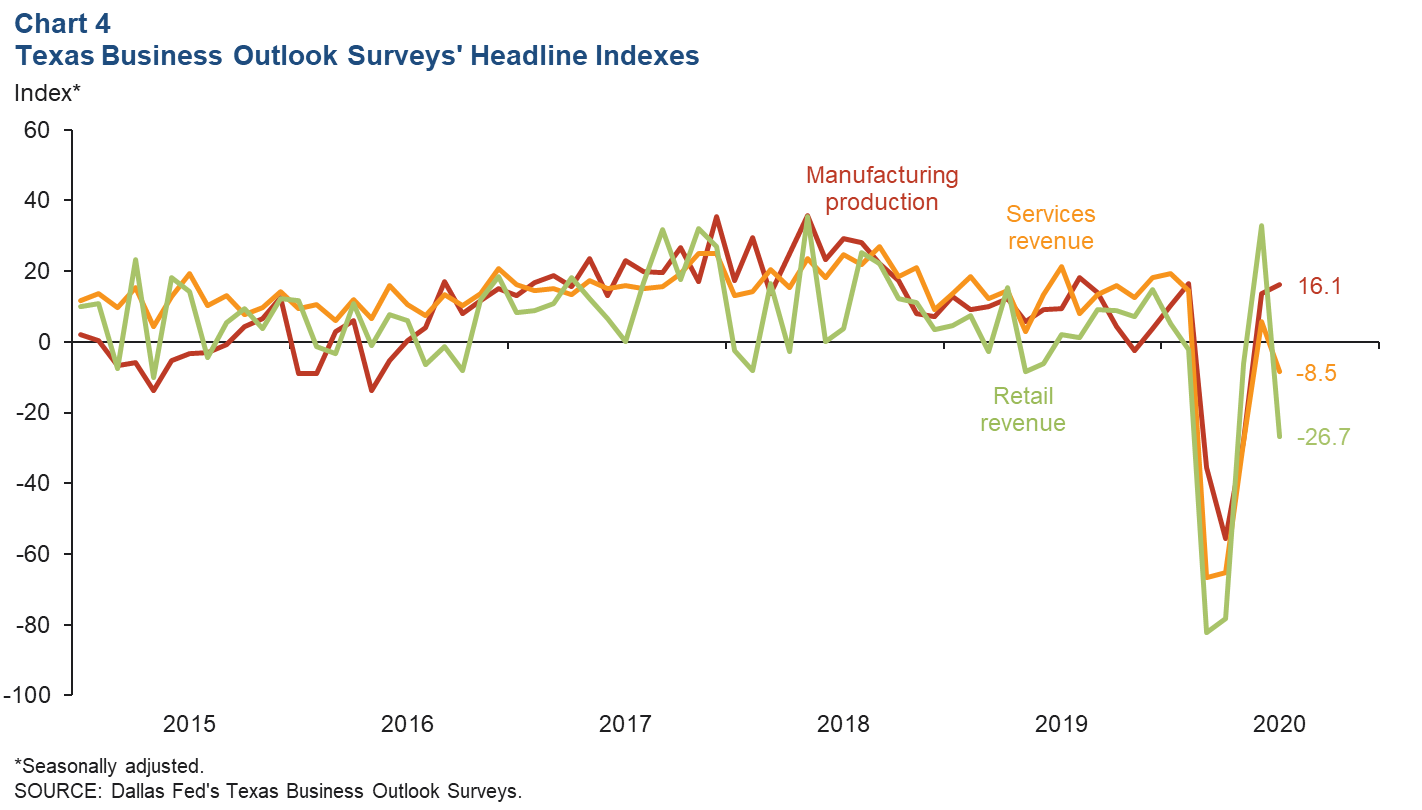
Activity in the service sector fell, while manufacturing saw continued growth, according to firms responding to the Texas Business Outlook Surveys in July (Chart 4). For manufacturers, this signaled the second month in a row of growing production following three months of steep declines. The current index of 16.1 falls in line with the February reading earlier this year, before pandemic-driven business shutdowns were ordered. A positive reading means more respondents indicated an increase than indicated a decrease. In the service and retail sectors, the positive revenue readings in June were followed by contraction in July. Nonessential-business closures due to COVID-19 were relaxed in June but partially reinstated starting in early July.
Exports
Texas exports rose in June, though the three-month moving average continued to decline for the fourth month in a row (Chart 5). Texas exports through June are 11.5 percent below the same period in 2019. So far in 2020, exports to nearly all of Texas’ major trading partners trail last year’s levels except for exports to China and Europe. U.S. exports also rose in June, but year-to-date exports to all major trading partners lag behind 2019 levels.
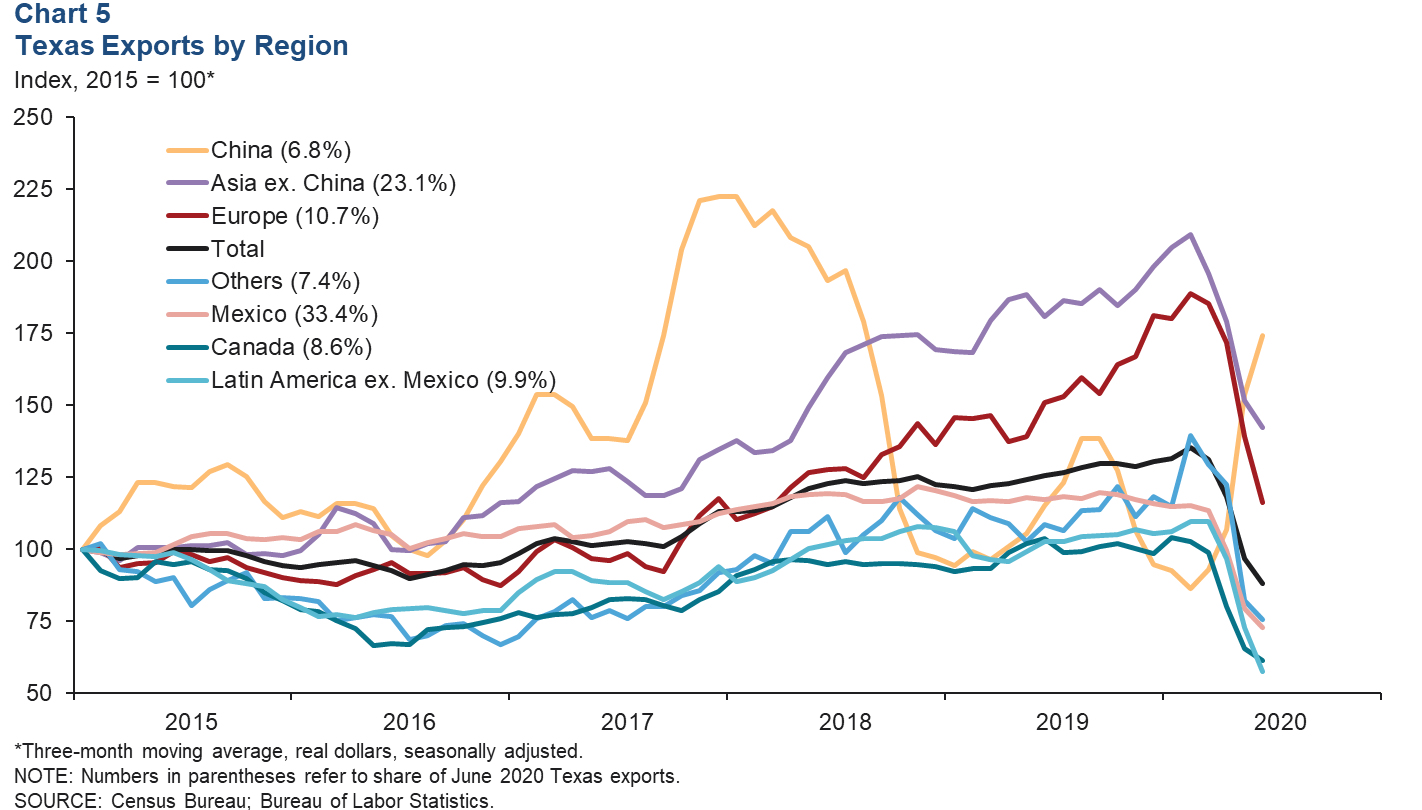
In June, both Texas and U.S. agriculture exports dipped, while mining and manufacturing exports ticked up. Year-to-date exports in all three sectors remain below 2019 levels through June.
Consumer Spending
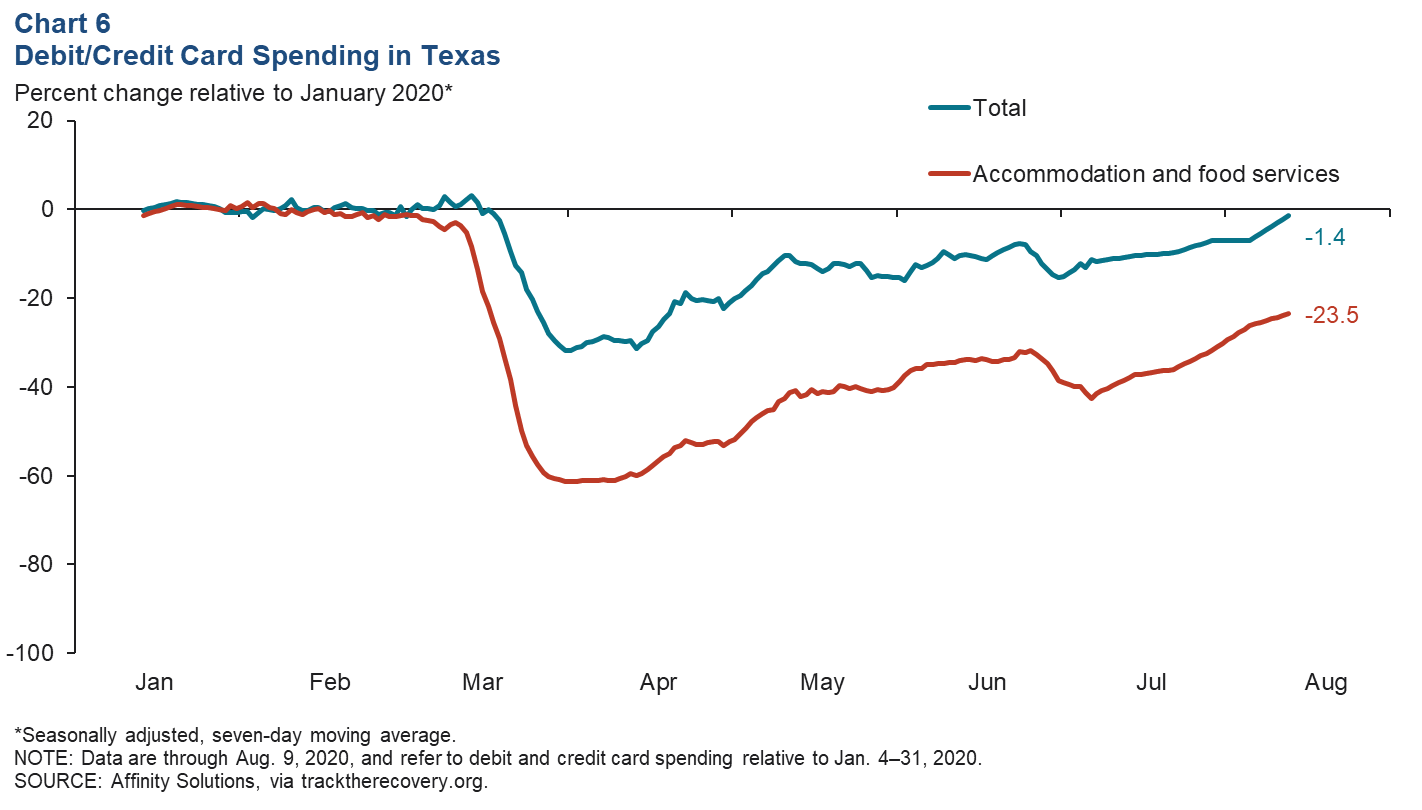
After plummeting in the wake of the March economic shutdown, consumer spending in Texas has slowly improved relative to January 2020 (pre-COVID) levels (Chart 6). Particularly impacted during the shutdown was spending in the accommodation and food services sector. The recovery in consumer spending stagnated and began to reverse in late June and early July as COVID-19 cases surged in the state. Since then, growth has been steady both overall and in accommodation and food services. Total debit and credit card spending in the state was only 1.4 percent below January spending on Aug. 9, while accommodation and food services spending remained 23.5 percent below.
NOTE: Data may not match previously published numbers due to revisions.
About Texas Economic Indicators
Questions can be addressed to Carlee Crocker at carlee.crocker@dal.frb.org. Texas Economic Indicators is published every month on the Monday after Texas employment data are released.