Texas Economic Indicators

March 16, 2021
The Texas economy showed signs of a slowing expansion in January as payroll employment growth softened and unemployment claims remained elevated. Respondents to the Texas Business Outlook Surveys indicated positive outlooks. Texas exports increased in January, and retail sales grew at year-end, though they remained below December 2019 levels. A growing share of Texans reported that it is difficult to pay usual household expenses, according to the latest Census Bureau Household Pulse Survey.
Labor market
Employment growth slows
Texas employment grew a nonannualized 0.3 percent in January after climbing a downwardly revised 0.5 percent in December (Chart 1). January marks the ninth month in a row for payroll expansion in the state since jobs sank in March and April due to the COVID-19 pandemic. Job growth nationwide picked up in the first two months of the year. Payrolls shrank at year-end before climbing 0.1 percent and 0.3 percent in January and February, respectively.
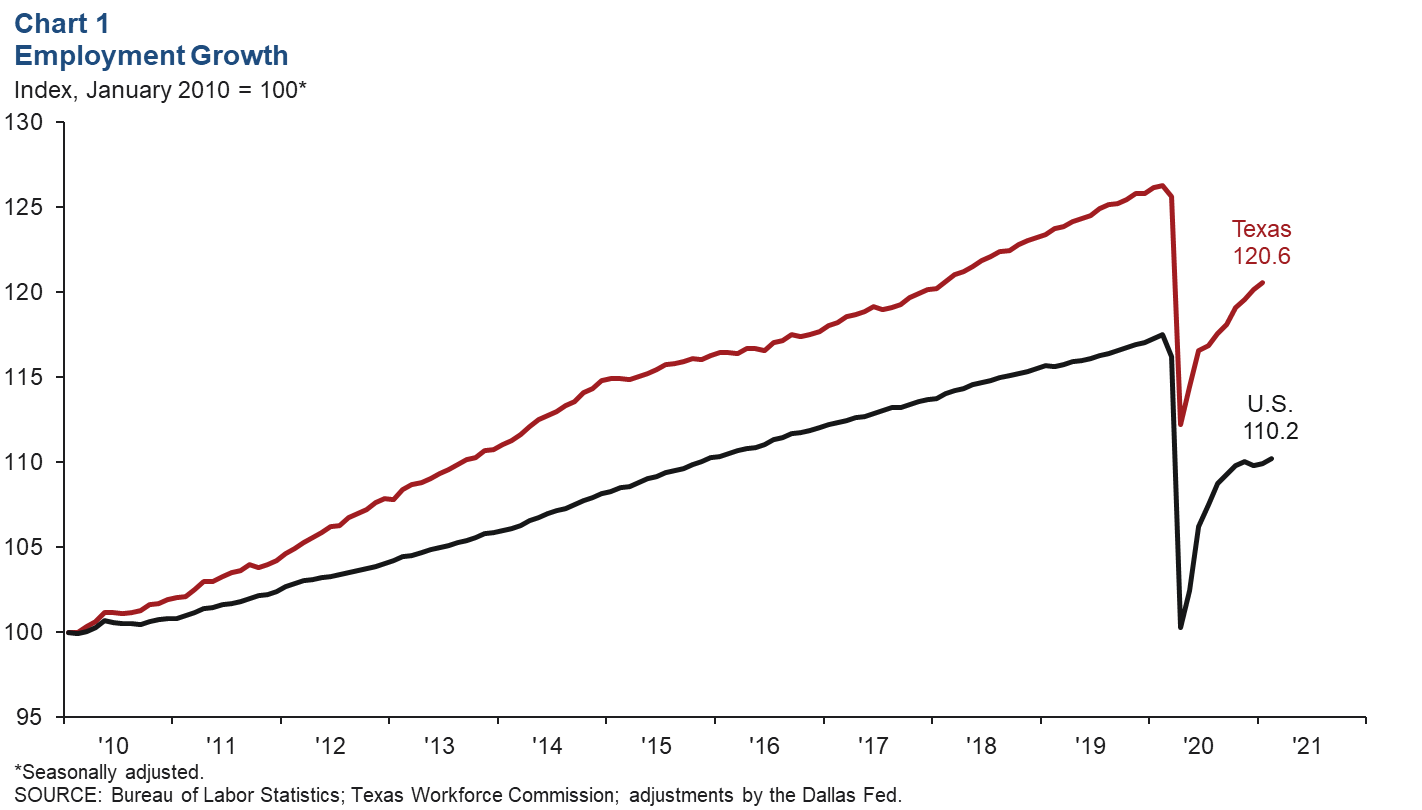
Texas job growth was strongest in the oil and gas sector, which rose a nonannualized 2.3 percent in the first month of the year. Government and manufacturing employment slipped 0.1 percent each, and educational and health services held steady. All other sectors saw growth in January.
Unemployment insurance claims remain elevated
Unemployment claims in Texas have slowly recovered from their initial rise last spring but remain more than seven times their prepandemic level (Chart 2). Unemployment claims nationally are more than 10 times their prepandemic level. High claims numbers have persisted in part because of the availability of pandemic aid that includes unemployment insurance outside of the usual state programs, emergency unemployment compensation and extended benefits. These programs were extended to the first week of September with latest COVID-19 relief bill.
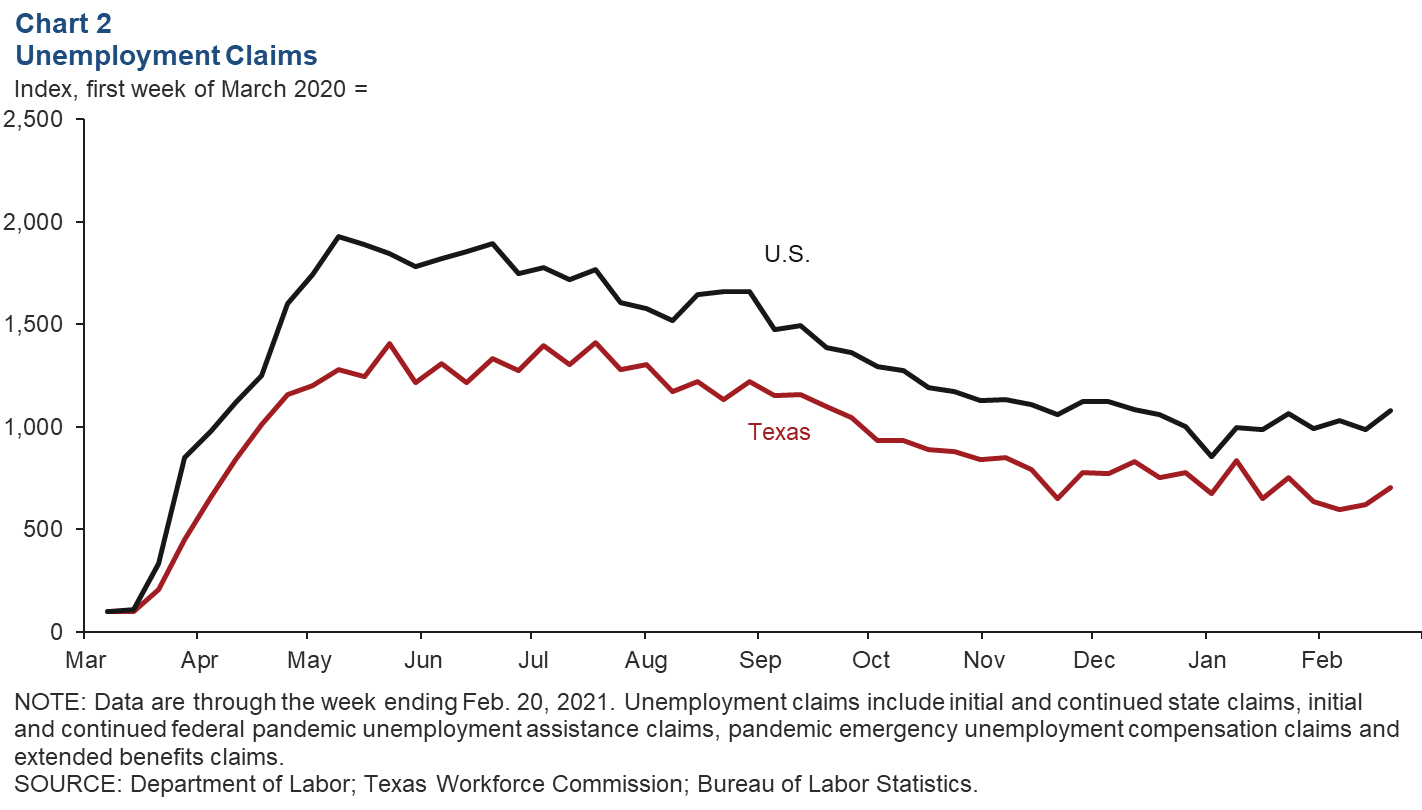
The Texas unemployment rate fell slightly in January, from 6.9 percent to 6.8 percent. The national rate declined to 6.3 percent in January before sliding further to 6.2 percent in February.
Texas Business Outlook Surveys
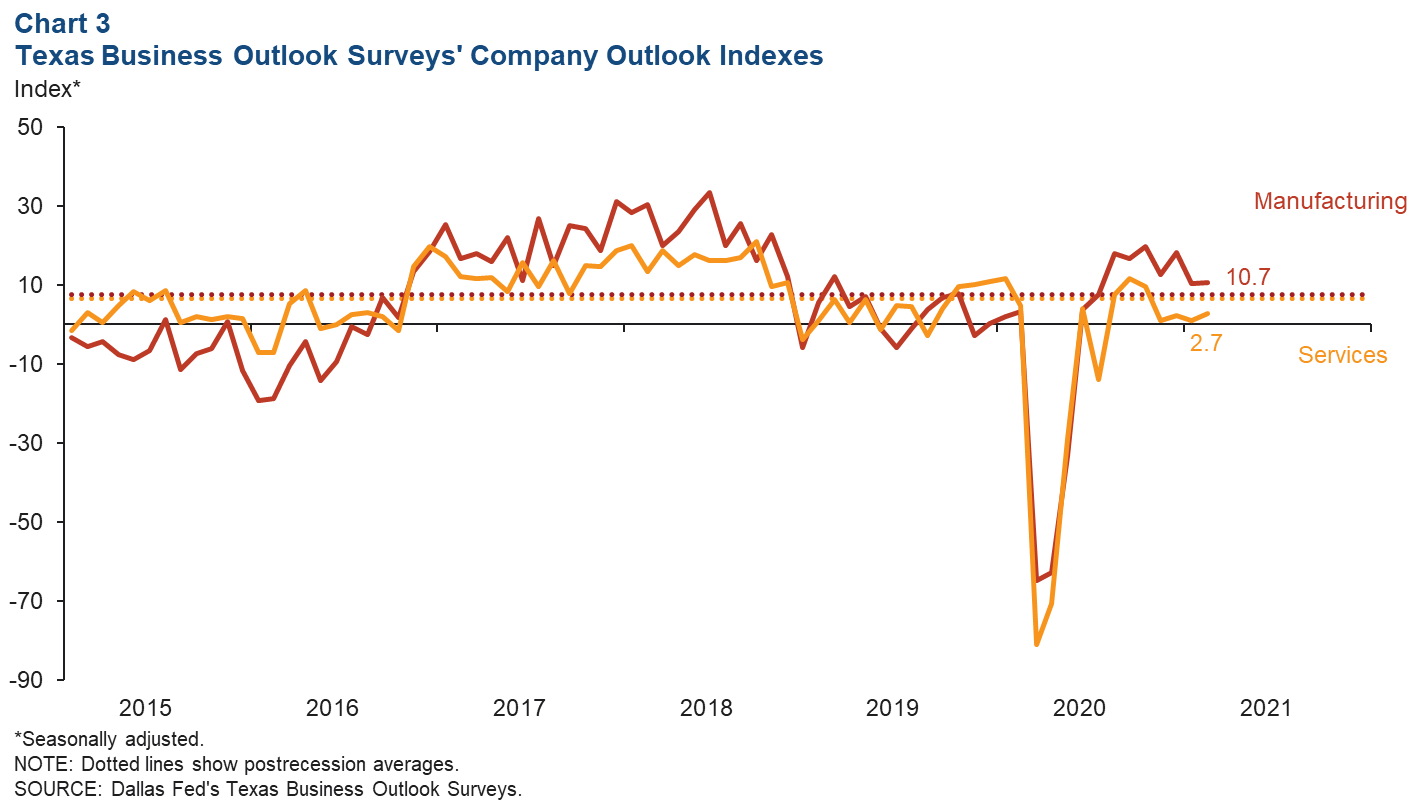
After reporting bleak outlooks at the onset of the pandemic, respondents to the Texas Business Outlook Surveys had neutral to positive net outlooks in the latter half of last year (Chart 3). The manufacturing sector outlook has been above average since July 2020, while the service sector outlook briefly rose above the postrecession average last fall before more recently falling to muted but positive readings. Outlooks dampened for both sectors in January before ticking back up in February. The manufacturing outlook, though below readings late last year, is still more optimistic than it was through most of 2019. The outlook for the service sector—whose performance is more closely tied to the mobility and engagement of the population—is expected to improve as the number of vaccinations continues to rise.
Exports
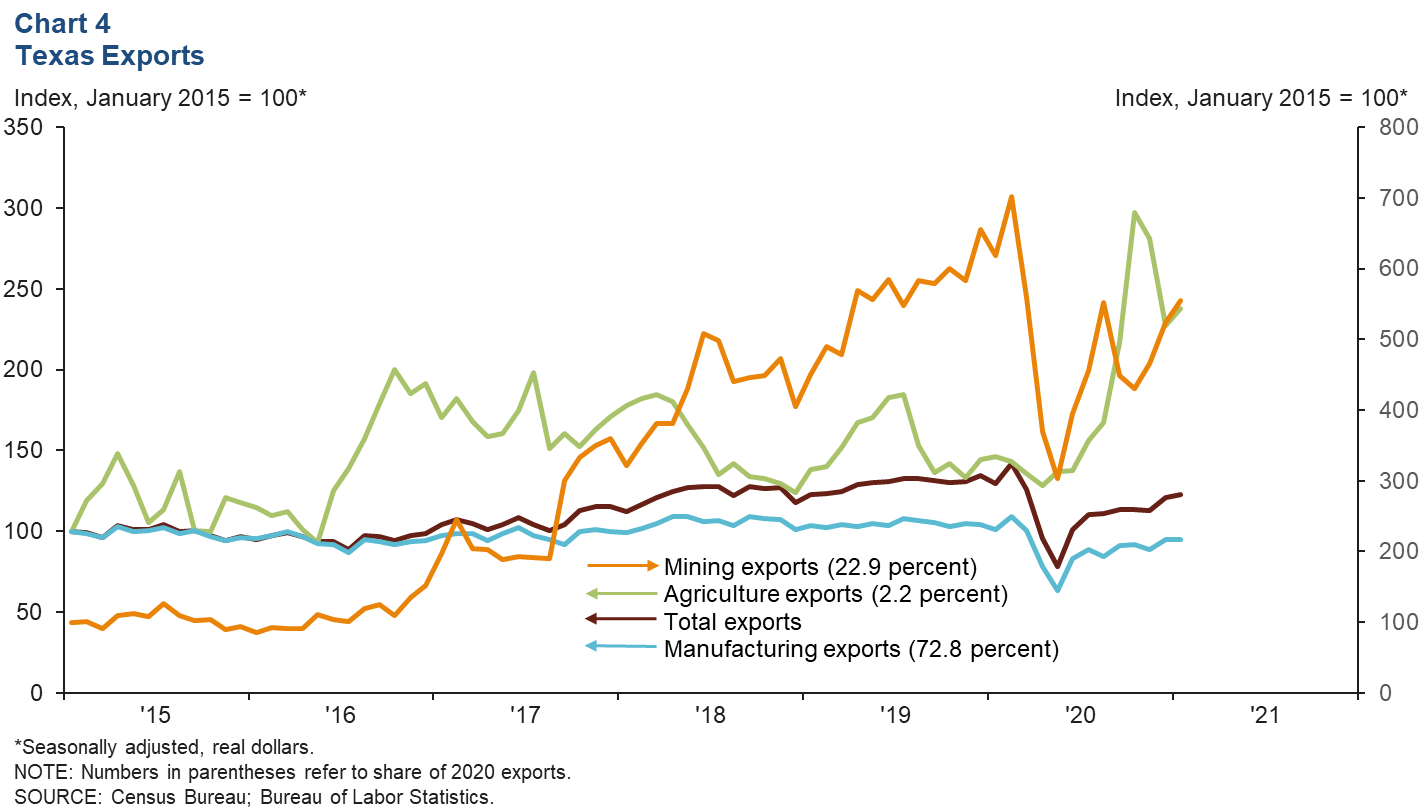
Texas exports have slowly recovered after last spring’s pullback, ticking up in January 2021 (Chart 4). The trajectory of statewide exports has been largely driven by manufacturing exports, which made up 72.8 percent of total exports in 2020. Despite this steady recovery, January 2021 total and manufacturing exports remained 13.5 and 12.9 percent, respectively, below their February prepandemic levels. Mining exports have been much more volatile and were 21.0 percent below their prepandemic levels as of January 2021. While agriculture exports saw a minor decline in the first four months of 2020, they more than doubled from that point through October. They retreated somewhat after that but climbed again in January to 66.4 percent above their February 2020 level.
Retail sales
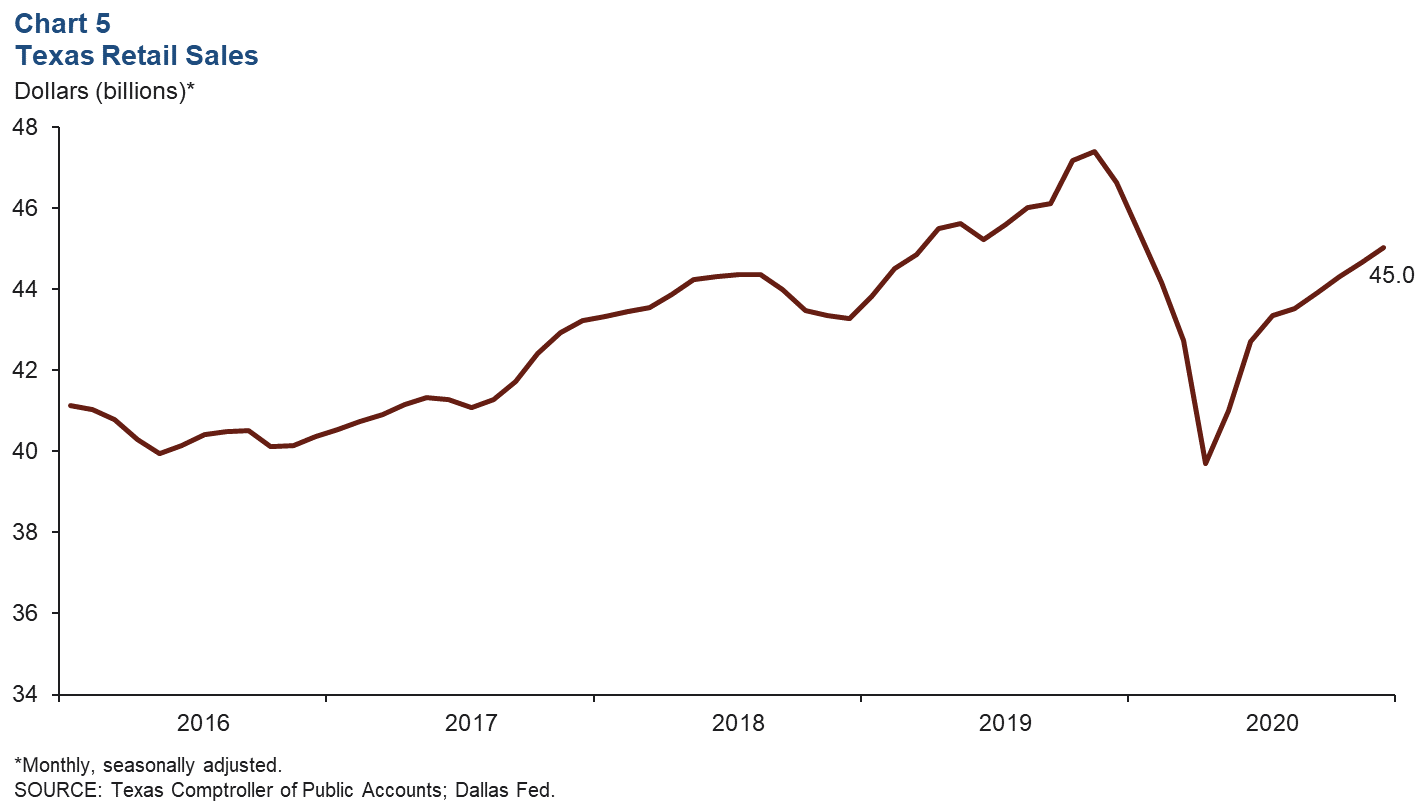
Even though online sales rose in spring 2020, total retail sales in Texas plummeted from January to April as many retail businesses shut down due to the pandemic response (Chart 5). In the latter half of the year, total sales picked up and were 3.5 percent below year-ago levels as of December 2020. Sales in December, though below record-high sales at the end of 2019, were greater than year-end sales in any other preceding year since the beginning of the series in 1990.
Household expenses
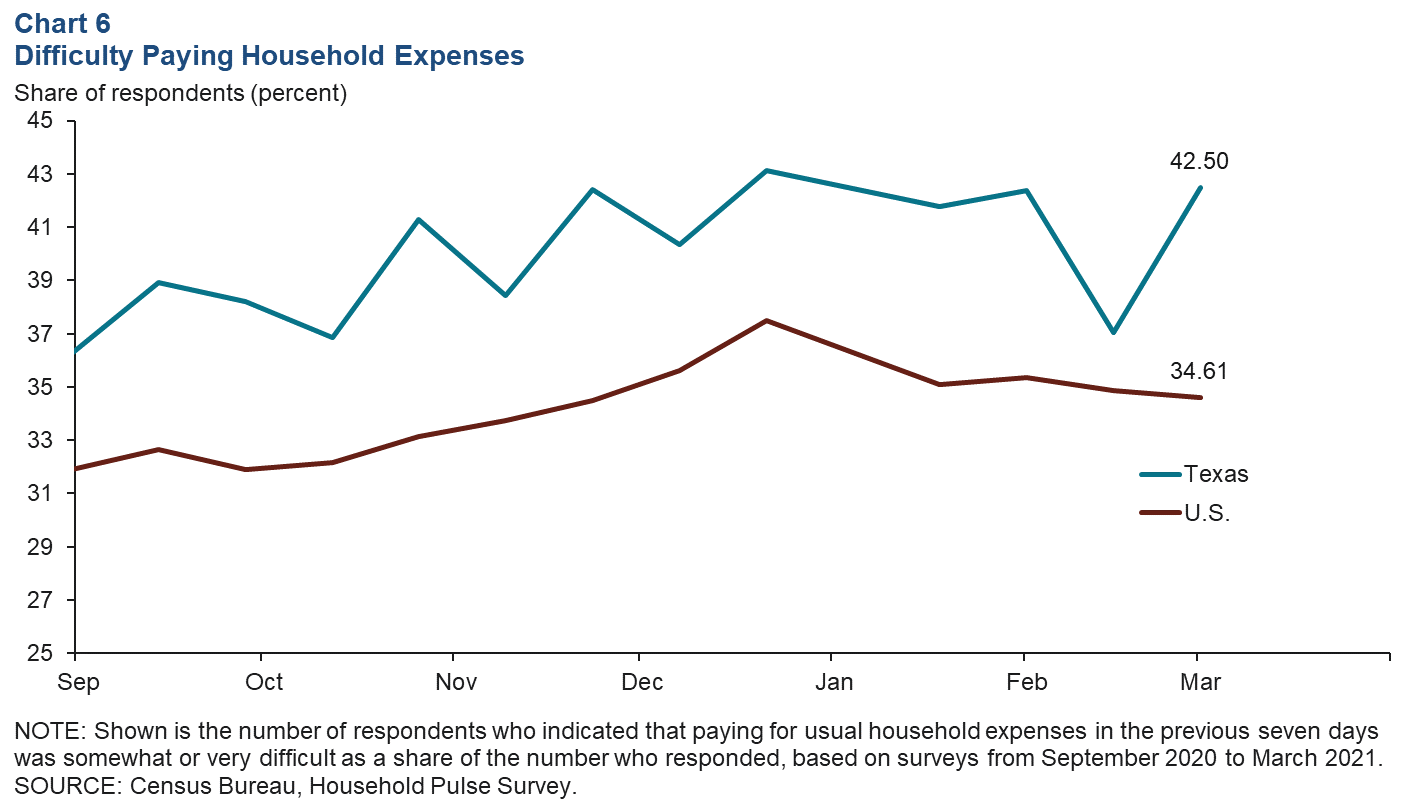
Texans responding to the Household Pulse Survey have indicated more difficulty than the national average in paying for usual household expenses since the survey began asking that question last fall (Chart 6). The statewide measure peaked toward the end of December. In mid-February, Winter Storm Uri hit Texas, causing an extended crisis that began with widespread power outages. The share of Texans reporting it difficult to pay usual household expenses fell during that week but spiked in the survey that followed two weeks later.
NOTE: Data may not match previously published numbers due to revisions.
About Texas Economic Indicators
Questions can be addressed to Carlee Crocker at carlee.crocker@dal.frb.org. Texas Economic Indicators is published every month on the Monday after Texas employment data are released.