Texas Economic Indicators

December 21, 2021
The Texas economic recovery continued in November, with payrolls growing strongly in all sectors and the unemployment rate declining. The November Texas Business Outlook Surveys (TBOS) indicated that price pressures are at or near all-time highs. Overall, credit and debit card spending remained above prepandemic levels. Texas exports rose in October, and consumer loan delinquencies broadly declined in November.
Labor Market
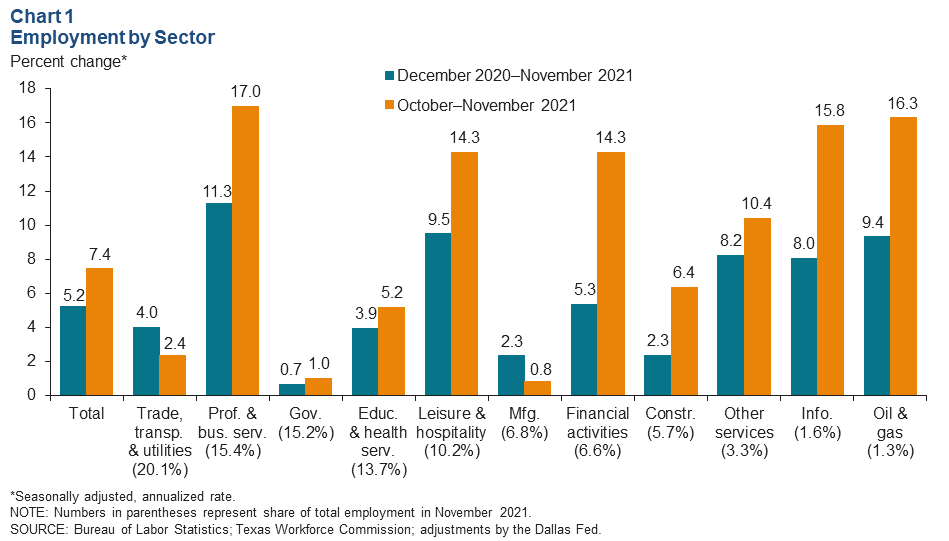
Employment Growth Robust in All Sectors
Texas employment expanded an annualized 7.4 percent in November after growing an upwardly revised 4.5 percent in October (Chart 1). All sectors saw healthy job growth in November, with professional and business services seeing the fastest growth at an annualized 17.0 percent, followed closely by oil and gas and information services employment. Through November, Texas has added jobs at a 5.2 percent rate—an increase of 590,000 positions. Payrolls in professional and business services saw the strongest year-to-date growth at 11.3 percent, followed by healthy gains of 9.5 percent in leisure and hospitality, 9.4 percent in oil and gas, and 8.2 percent in other services. The Dallas Fed’s Texas Employment Forecast predicts 5.3 percent job growth this year (December/December).
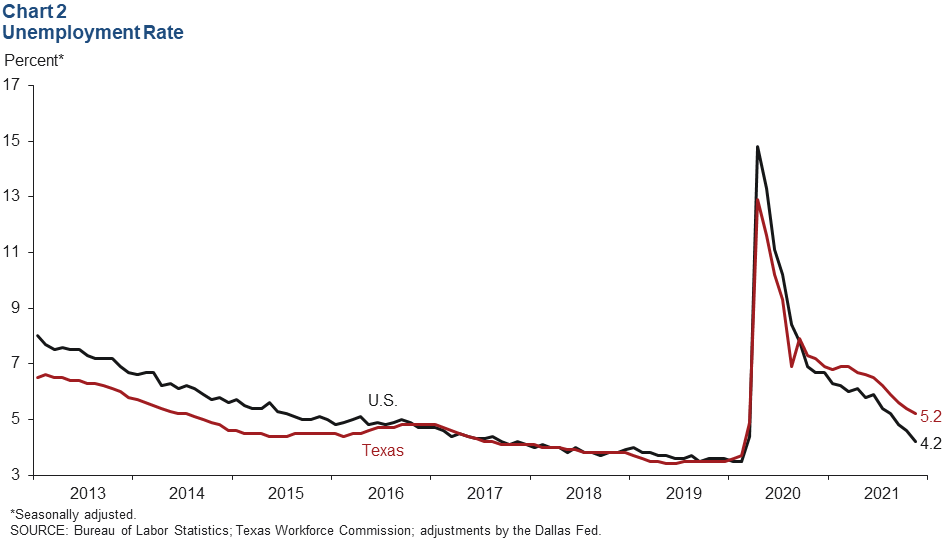
Unemployment Rate Dips
The Texas unemployment rate declined from 5.4 percent in October to 5.2 percent in November (Chart 2). Meanwhile, the U.S. jobless rate ticked down from 4.6 percent to 4.2 percent. The statewide unemployment rate has steadily fallen since April and is currently at its lowest level since the onset of the COVID-19 pandemic in March 2020.
Texas Business Outlook Surveys
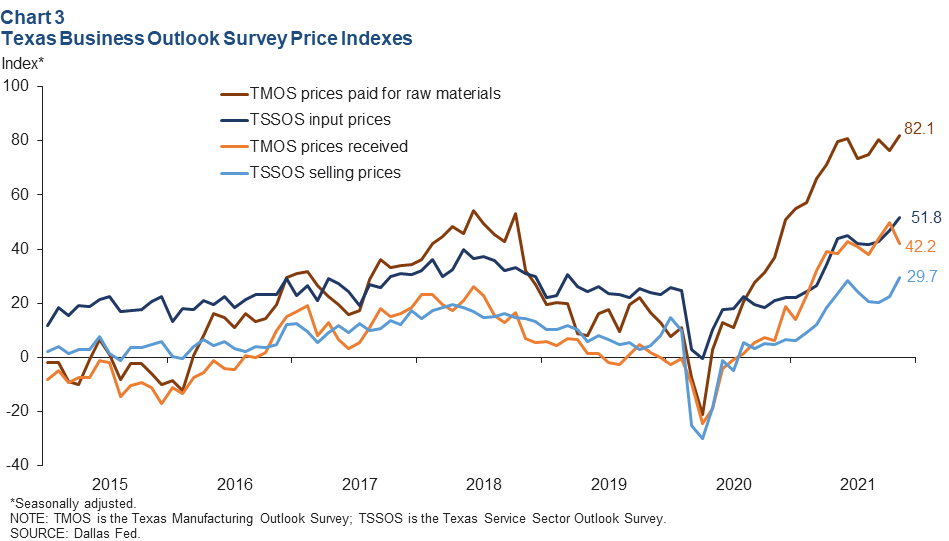
The TBOS manufacturing and service sector price indexes remained highly elevated, reflective of a continued above-average pace of expansion (Chart 3). In November, the indexes for manufacturing raw materials prices and service sector input and selling prices reached historic highs. Specifically, the manufacturing raw materials price index rose 5.8 points to 82.1, the service sector input price index rose 4.8 points to 51.8, and the service sector selling price index rose seven points to 29.7. The prices received for finished goods index fell by 7.6 points to 42.2 but remained near recent highs. Outlooks were mixed, and uncertainty remained elevated.
Texas Exports
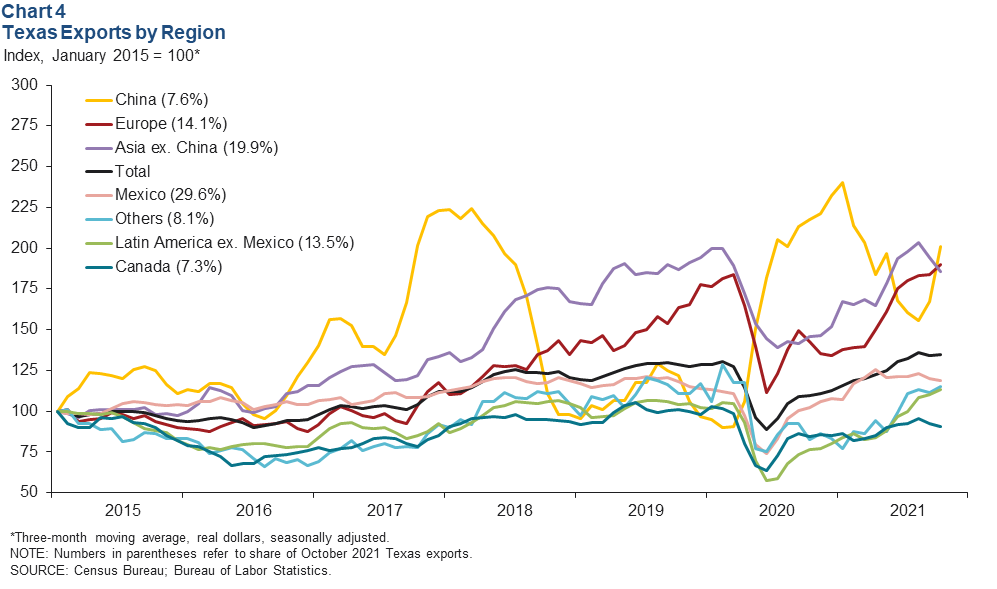
In October, the three-month moving average of Texas exports climbed 0.3 percent (Chart 4). The three-month average of Texas exports to China saw vigorous growth of 20.2 percent in October, while exports to Europe and the rest of Latin America rose 3.4 and 2.7 percent, respectively. Through October, Texas exports to most major regions were up relative to 2020, with Texas exports to Mexico, its largest trading partner, and to the rest of Latin America soaring nearly 25 percent.
Consumer Spending
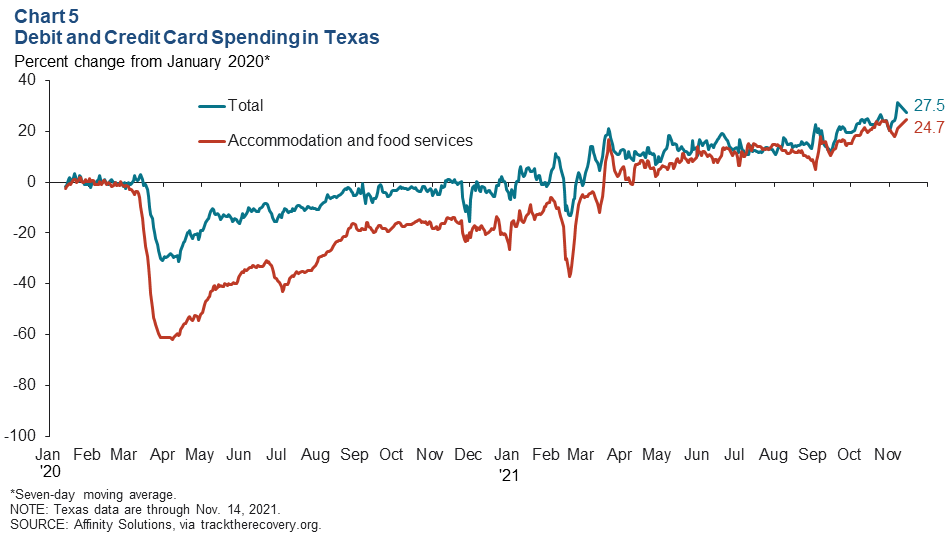
Relative to January 2020 levels, consumer spending in Texas has steadily improved overall and also in accommodation and food services (Chart 5). Since March 2021, consumer spending in Texas has remained above prepandemic levels. As of Nov. 14, total debit and credit card spending in the state was 27.5 percent above January 2020 levels, and accommodation and food services spending reached a new high of 24.7 percent.
Consumer Loan Delinquencies
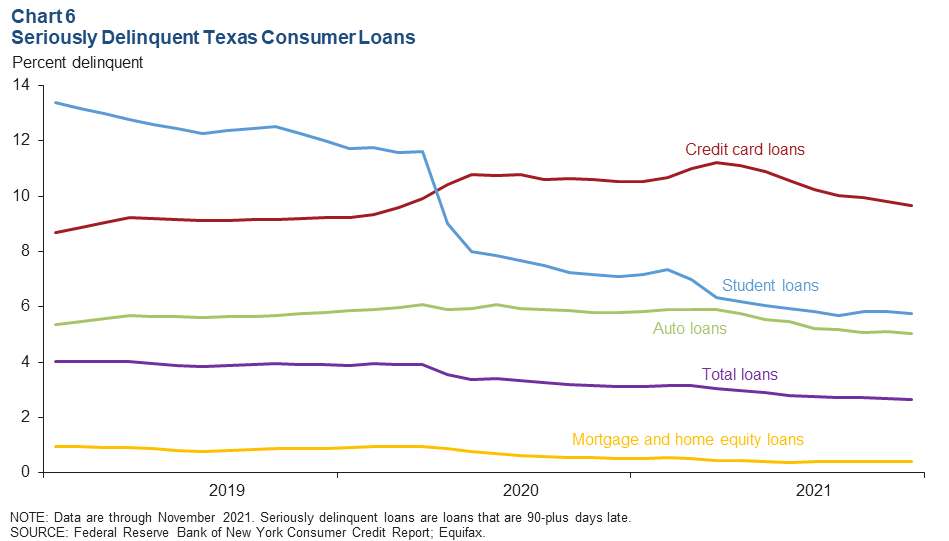
Overall delinquency rates for consumer loans in Texas decreased in November (Chart 6). Credit card delinquencies, which fell from 9.8 percent in October to 9.6 percent in November, remain the highest among the four types of consumer loans and slightly above prepandemic levels. Delinquency rates for student, auto and mortgage and home-equity loans continued to dip, remaining below prepandemic levels. Student loan delinquencies, which have steadily declined amid the administrative forbearance, edged down to 5.8 percent. Auto loan delinquencies slightly declined to 5.0 percent. Mortgage and home-equity loan delinquency rates inched down to 0.4 percent and remained the lowest among the four consumer loan types.
NOTE: Data may not match previously published numbers due to revisions.
About Texas Economic Indicators
Questions can be addressed to Laila Assanie at Laila.Assanie@dal.frb.org and Mytiah Caldwell at Mytiah.Caldwell@dal.frb.org. Texas Economic Indicators is published every month during the week after state and metro employment data are released.