Texas Economic Indicators

May 24, 2022
The Texas economy expanded further in April. Payroll employment growth increased, and initial unemployment claims remained at low levels. The Texas Business-Cycle Index rose but at a decelerating rate. The April Texas Business Outlook Surveys (TBOS) indicated that perceptions of general business activity are waning. Growth in oil and natural gas prices was strong in mid-May. Consumer loan delinquencies ticked up in the first quarter.
Labor market
Employment growth increases
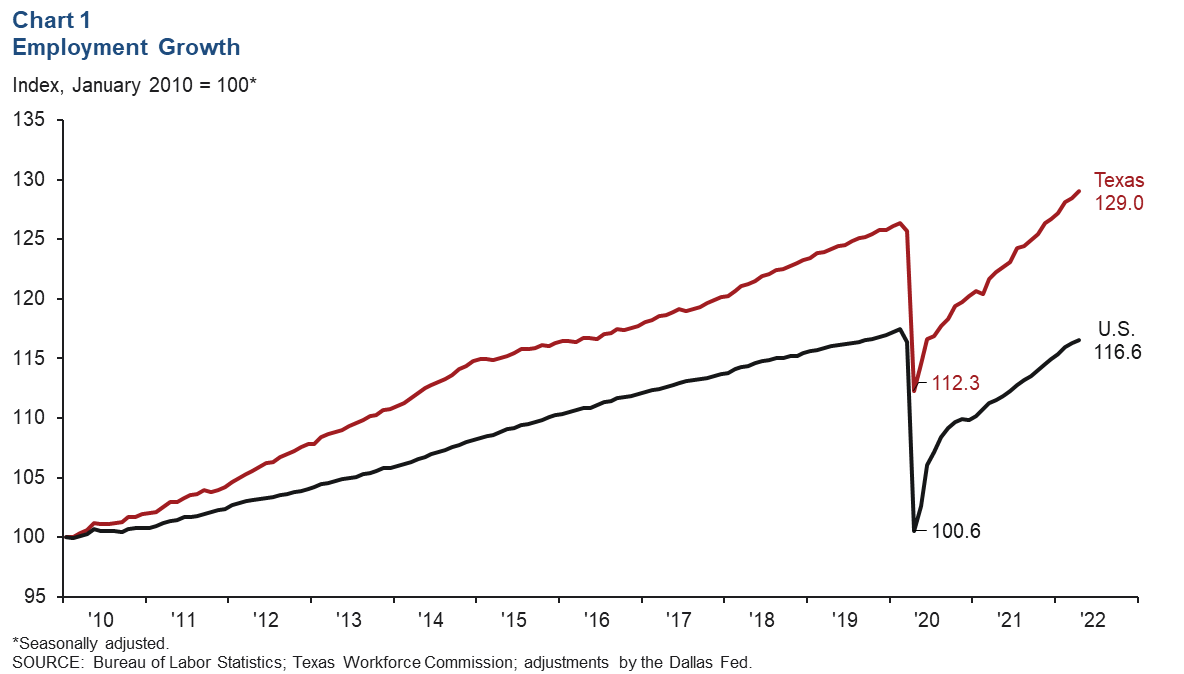
Texas employment expanded an annualized 5.7 percent (61,300 jobs) in April after growing an upwardly revised 2.7 percent in March (Chart 1). Job gains accelerated in most major sectors, with growth in oil and gas employment outpacing other sectors by a wide margin. Texas payroll employment reached a new high and was 2.1 percent above prepandemic levels. The Dallas Fed’s Texas Employment Forecast predicts 3.7 percent job growth this year (December/December).
Initial unemployment Claims Remain at Low Levels
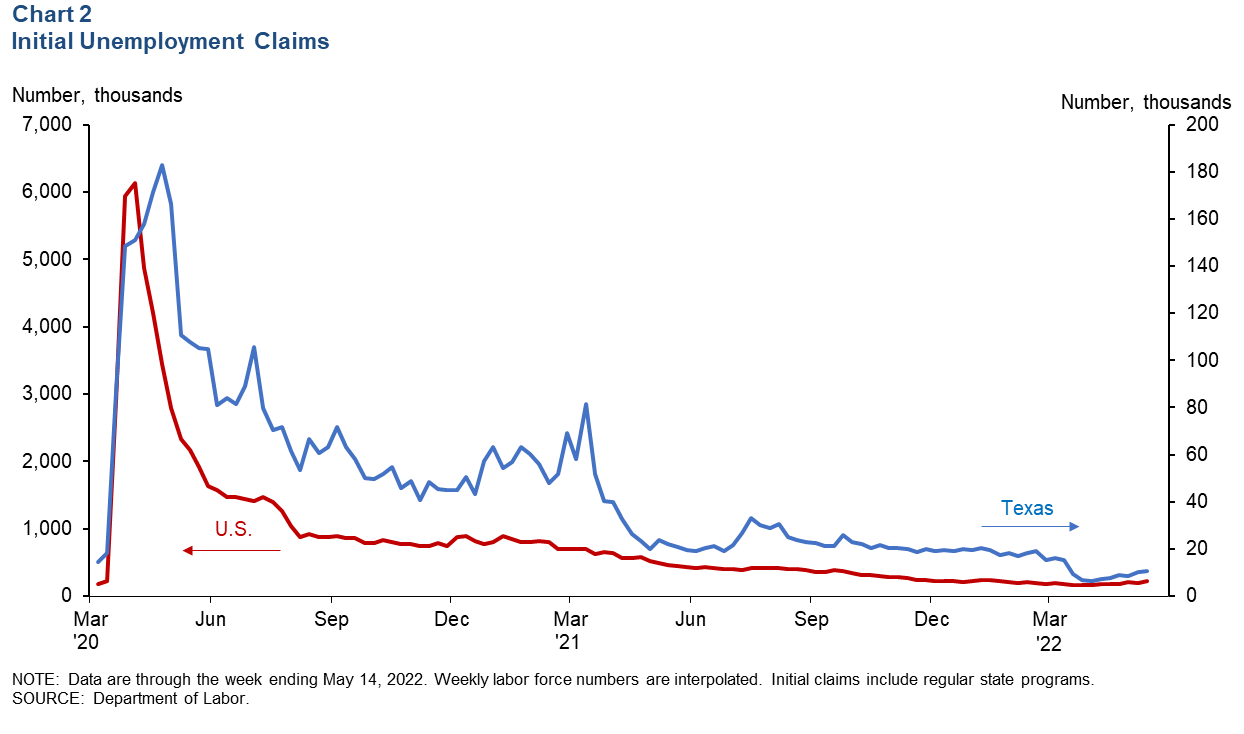
Weekly initial unemployment claims increased both nationally and in Texas in early May (Chart 2). During the week ending May 14, initial claims in Texas rose slightly by 779 from the previous week to 10,802, while claims nationally rose by 21,000 to 218,000. The state’s initial filings remained near postpandemic lows and were significantly below the peak recorded in the week ended April 25, 2020. The Texas unemployment rate fell to 4.3 percent in its most recent reading in April, while U.S. unemployment remained at 3.6 percent.
Business-cycle index
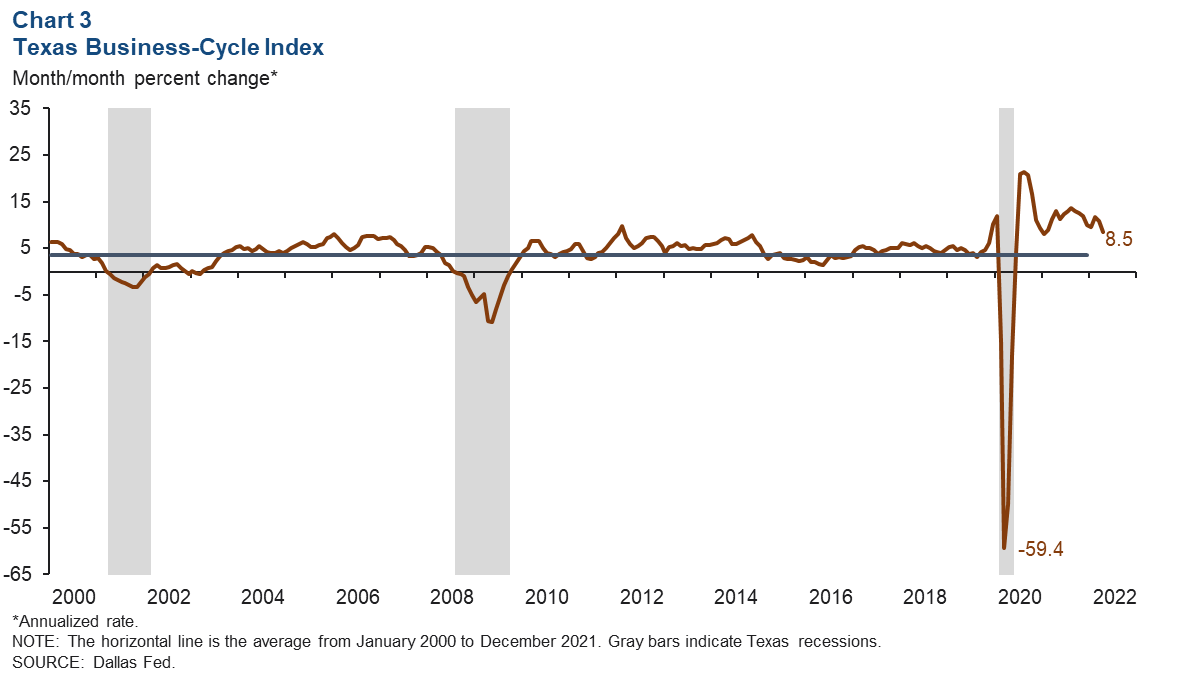
The Texas Business-Cycle Index—a composite of the unemployment rate, state payroll employment and gross state product—reflects underlying economic activity in the state. In April, the index grew at an above-average annualized pace of 8.5 percent (Chart 3). While index growth was robust, it slowed from March’s 10.8 percent increase.
Texas Business Outlook Surveys
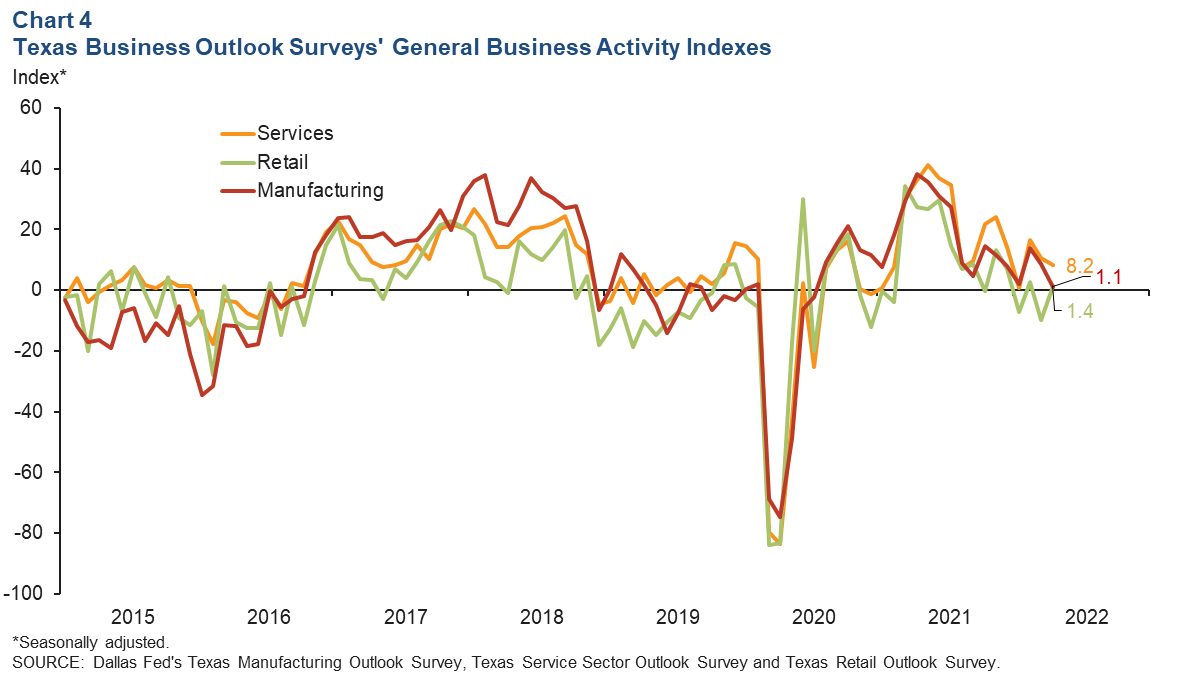
Movements in the Texas Business Outlook Surveys’ general business activity indexes were mixed and only slightly positive in April (Chart 4). April’s reading for the manufacturing sector moderated from 10.6 to 8.2, while the index for the service sector eased from 8.7 to 1.1. Meanwhile, the retail sector improved from its previous -9.8 value to a positive reading of 1.4.
Energy
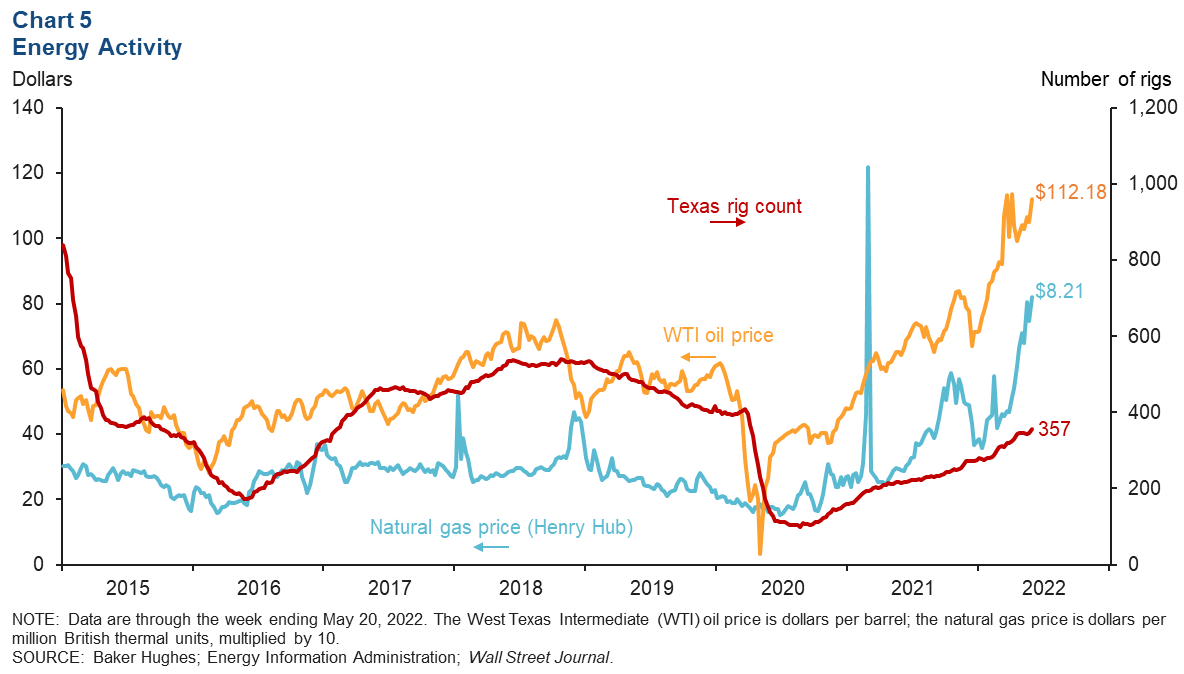
Oil prices increased in the most recent week and are well above the average year-end price forecast reported in the first-quarter Dallas Fed Energy Survey (Chart 5). As of the week ending May 20, the price of West Texas Intermediate (WTI) crude climbed to $112.18 per barrel, an increase of $7.18 from the previous week. Natural gas (Henry Hub) prices continued an upward trajectory, increasing $0.73 to $8.21 per MMBtu. The number of active rigs in Texas rose from 345 to 357 over the same period but remained below prepandemic levels.
Delinquencies
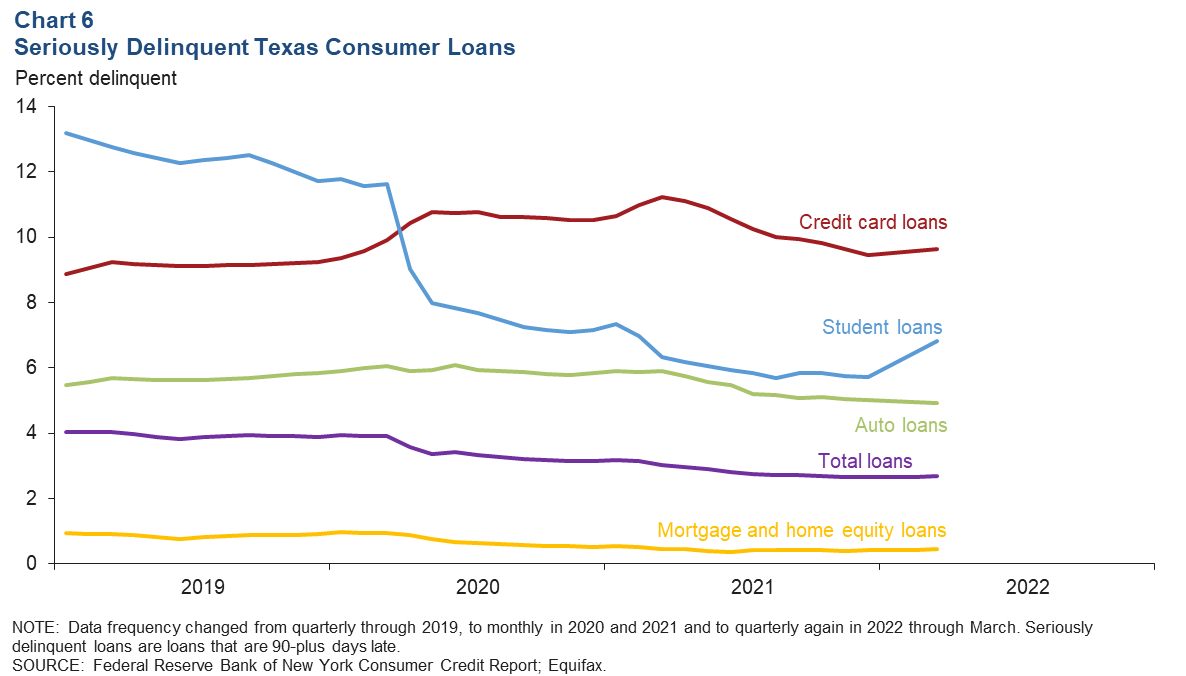
Overall delinquency rates for consumer loans in Texas rose slightly for the first quarter of 2022 (Chart 6). Credit card loans had the highest delinquency rate among the four consumer loan types, increasing to 9.6 percent in the first quarter—above prepandemic levels (February 2020) by 0.1 percentage points. First-quarter delinquency rates for student loans rose to 6.8 percent but remained below prepandemic levels. Delinquencies for mortgage and home-equity loans were little changed amid rising mortgage rates. Auto loan delinquencies slightly decreased to 4.9 percent.
NOTE: Data may not match previously published numbers due to revisions.
About Texas Economic Indicators
Questions can be addressed to Laila Assanie at Laila.Assanie@dal.frb.org and Mytiah Caldwell at Mytiah.Caldwell@dal.frb.org. Texas Economic Indicators is published every month during the week after state and metro employment data are released.