Texas Economic Indicators

July 31, 2023
| Texas economy dashboard (June 2023) | |||
| Job growth (annualized) March–June '23 |
Unemployment rate |
Avg. hourly earnings |
Avg. hourly earnings growth y/y |
| 2.6% | 4.1% | $31.32 | 5.0% |
The Texas economy expanded further in June, albeit at a slower pace. Employment grew in most sectors and across all major metros. The July Dallas Fed’s Texas Manufacturing Outlook Survey (TMOS) indicated that wage pressures eased but remained elevated in the manufacturing sector. Existing-home sales fell, and housing permits rose. Construction contract values increased for the third straight month based on a five-month moving average. Texas exports rose in May.
Labor market
Employment gains slow overall; leisure and hospitality loses jobs
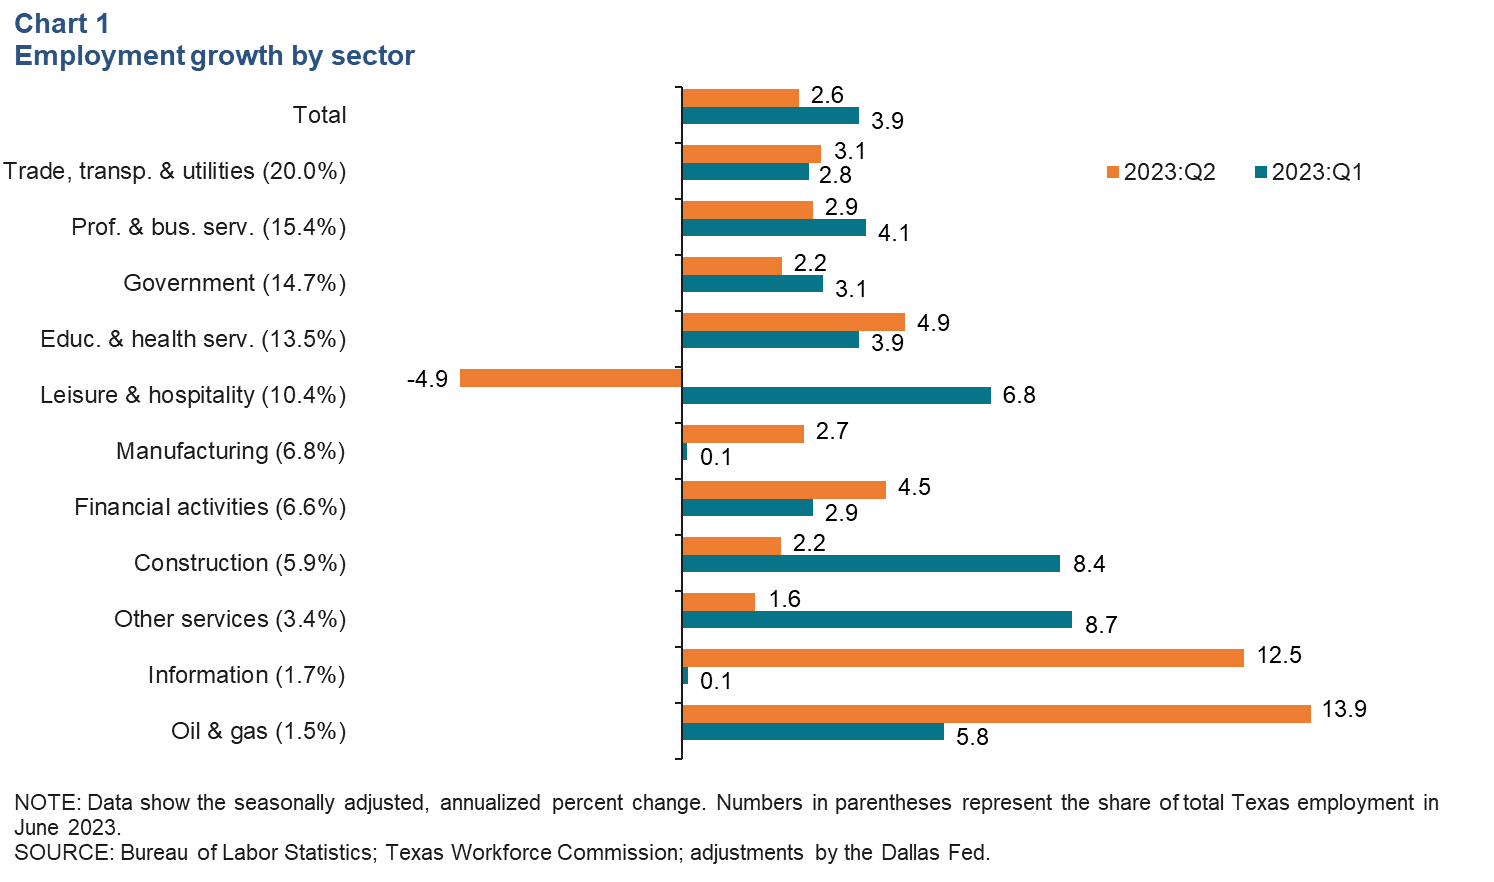
Texas employment expanded an annualized 2.1 percent in June after rising a downwardly revised 3.2 percent in May. In second quarter 2023, job gains were an annualized 2.6 percent (88,000 jobs)—a slowdown from the 3.9 percent (132,000) increase in first quarter 2023 (Chart 1). Second-quarter job growth varied greatly by sector. Leisure and hospitality employment contracted during the period, while oil and gas and information employment grew at a quickened pace from the first quarter, up 13.9 percent and 12.5 percent, respectively. Payrolls in the leisure and hospitality sector were down 4.9 percent in the second quarter, primarily due to declines in the amusement, gambling and recreation industries and the accommodation subsector. The Dallas Fed’s Texas Employment Forecast released on July 21 estimated 2.5 percent job growth this year (December/December)—down from its previous estimate of 2.8 percent.
Most major metros see solid job growth
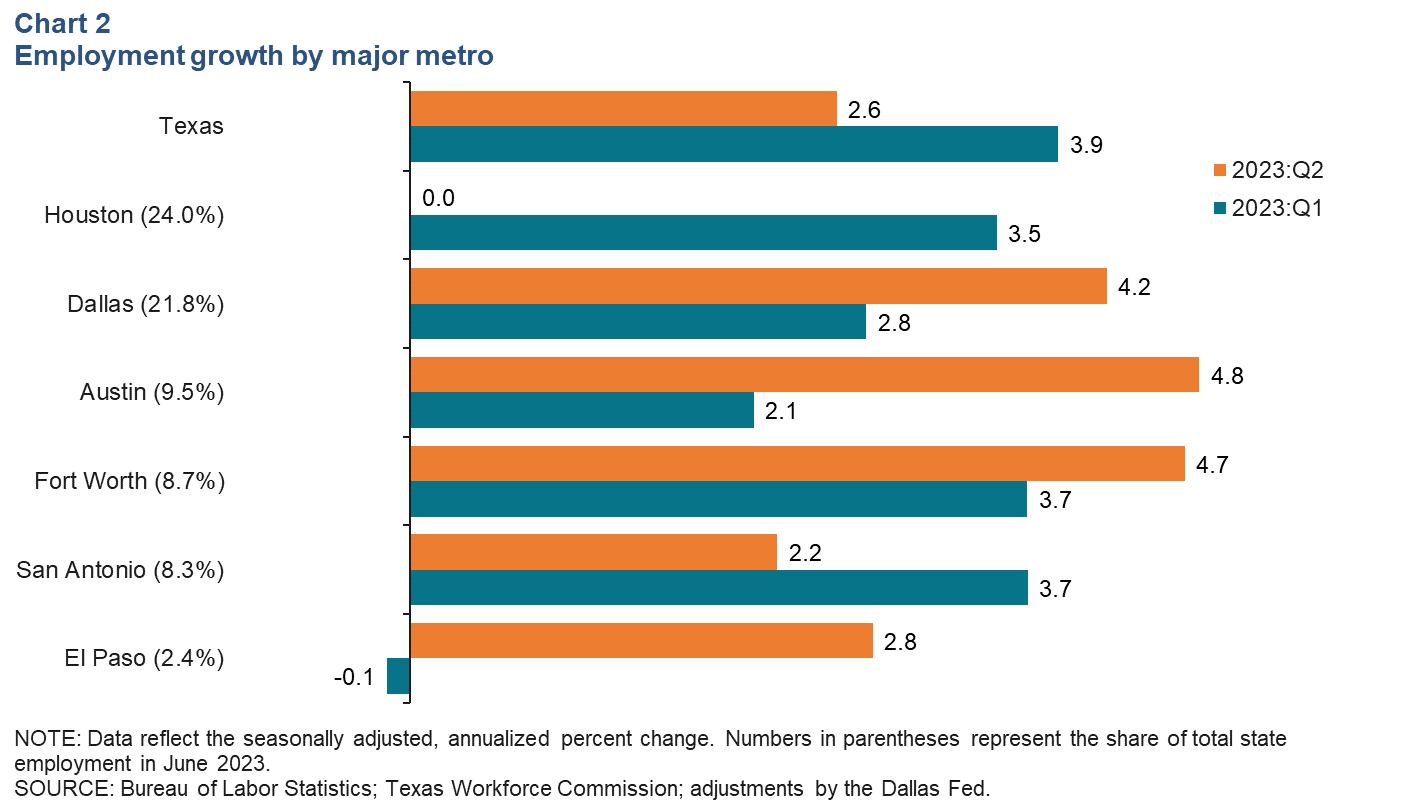
Second-quarter employment posted solid gains in most metros, with Dallas, Austin and Fort Worth outpacing first-quarter payroll gains (Chart 2). Austin led the metros with an annualized job growth of 4.8 percent, closely followed by Fort Worth’s annualized gains of 4.7 percent. Employment growth in Houston was flat in the second quarter following solid job growth of 3.5 percent in first quarter 2023. Year to date through June, Texas employment increased an annualized 3.2 percent.
Texas Manufacturing Outlook Survey
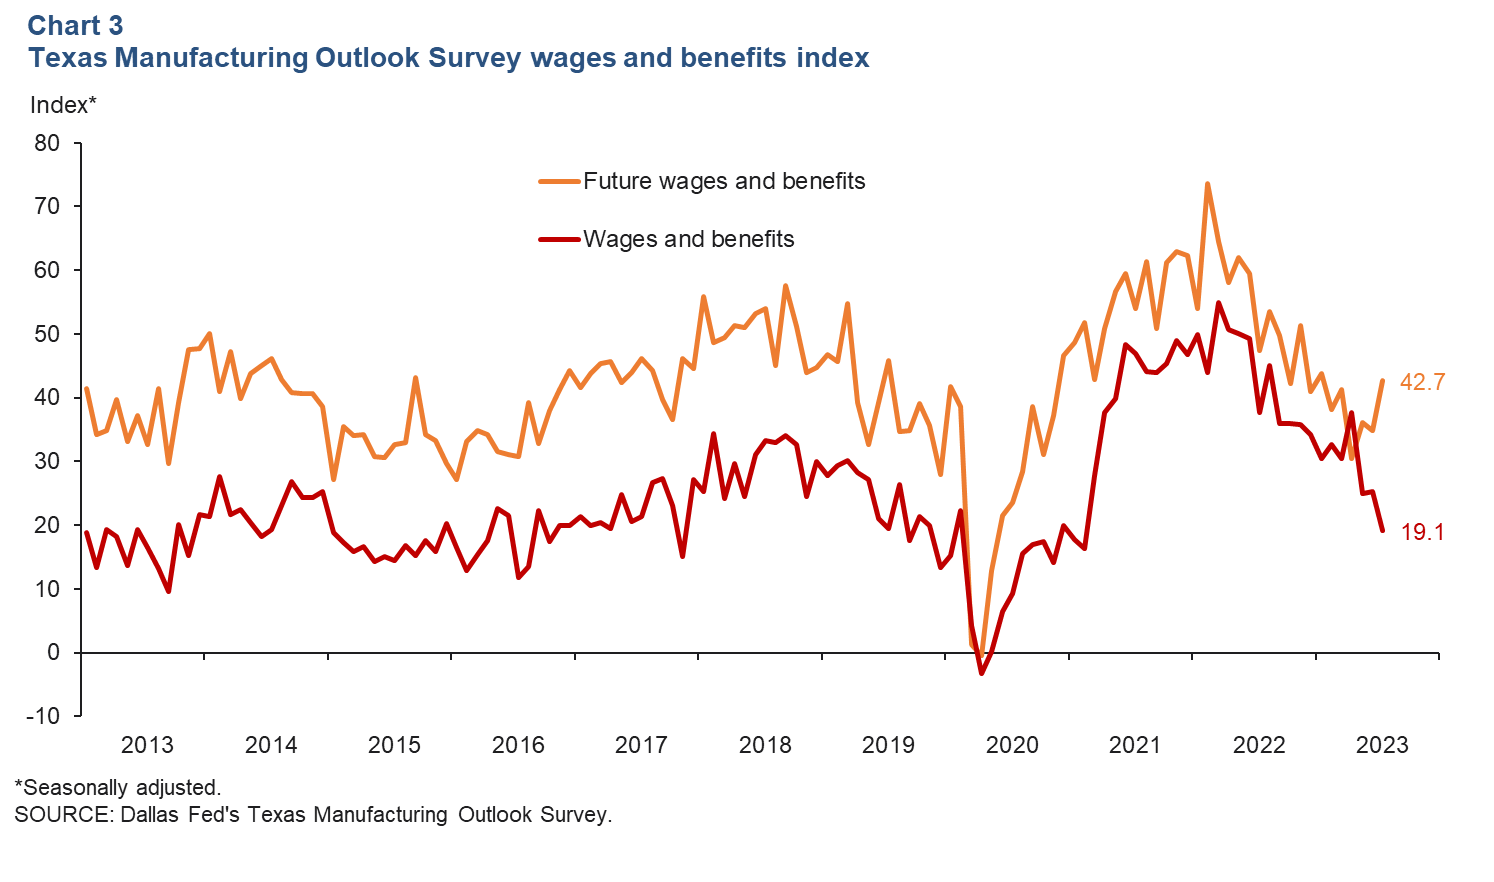
The Dallas Fed’s Texas Manufacturing Outlook Survey indicated wage growth eased but remained elevated in July (Chart 3). The manufacturing survey’s wages and benefits index ticked down and stayed below its long-term average, falling from 25.3 to 19.1. However, the manufacturing survey’s future wages and benefits index increased from 34.9 to 42.7 as respondents expected wage pressures to increase in the next six months.
Exports
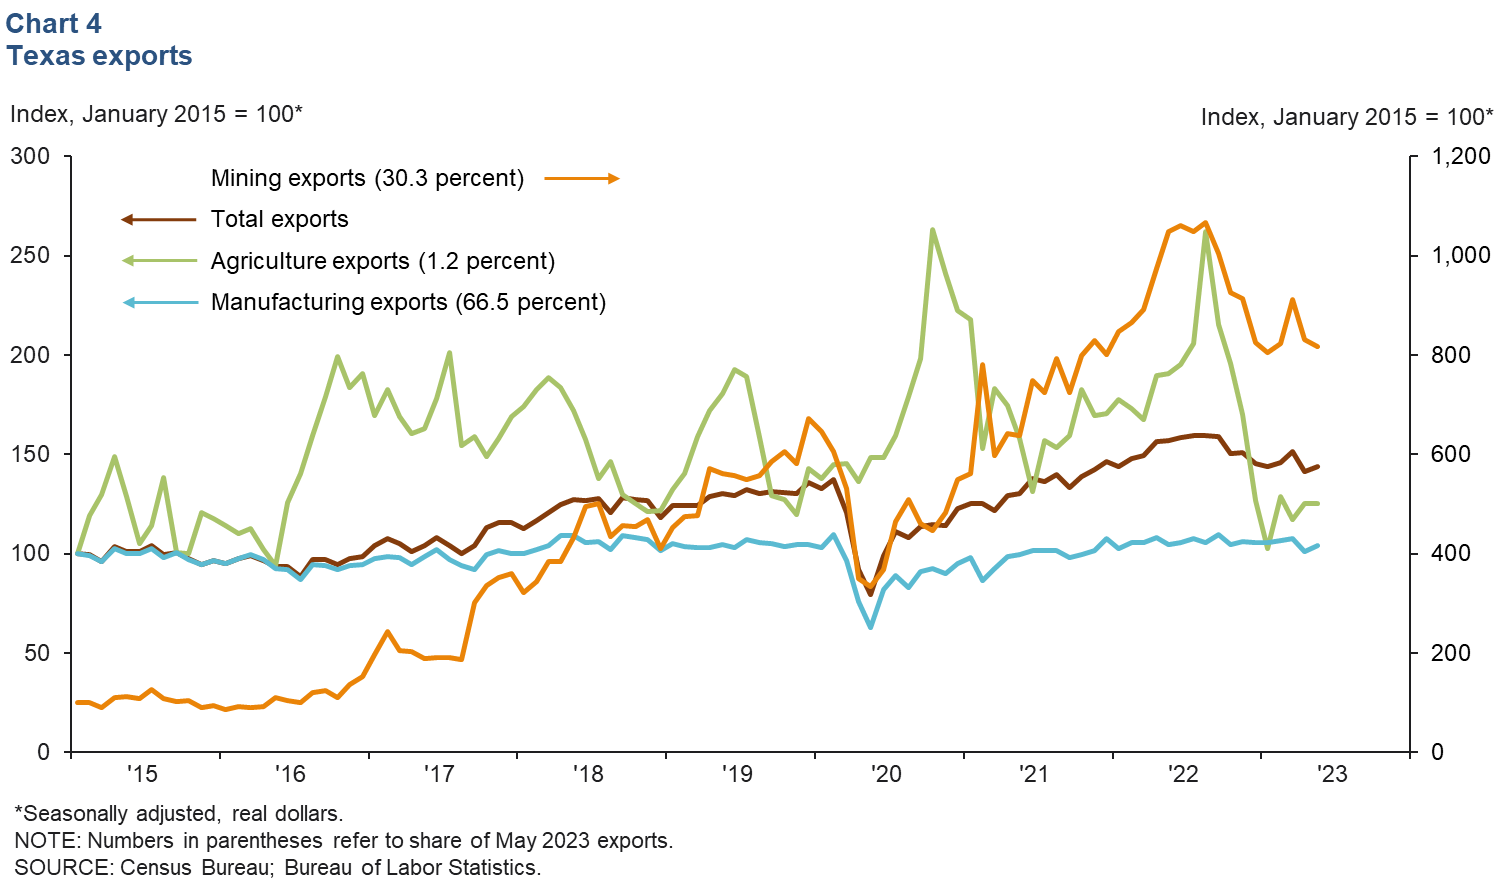
Texas exports rose 1.8 percent in May, partly driven by an increase in manufacturing exports (Chart 4). Mining exports fell 1.6 percent and were 22 percent lower than the same period in 2022. Agricultural exports were flat in May and were 34.3 percent lower than last May. Manufacturing exports increased 3.4 percent in May and were slightly lower than May 2022 by 0.5 percent. U.S. exports rose 2.8 percent in May over April.
Housing
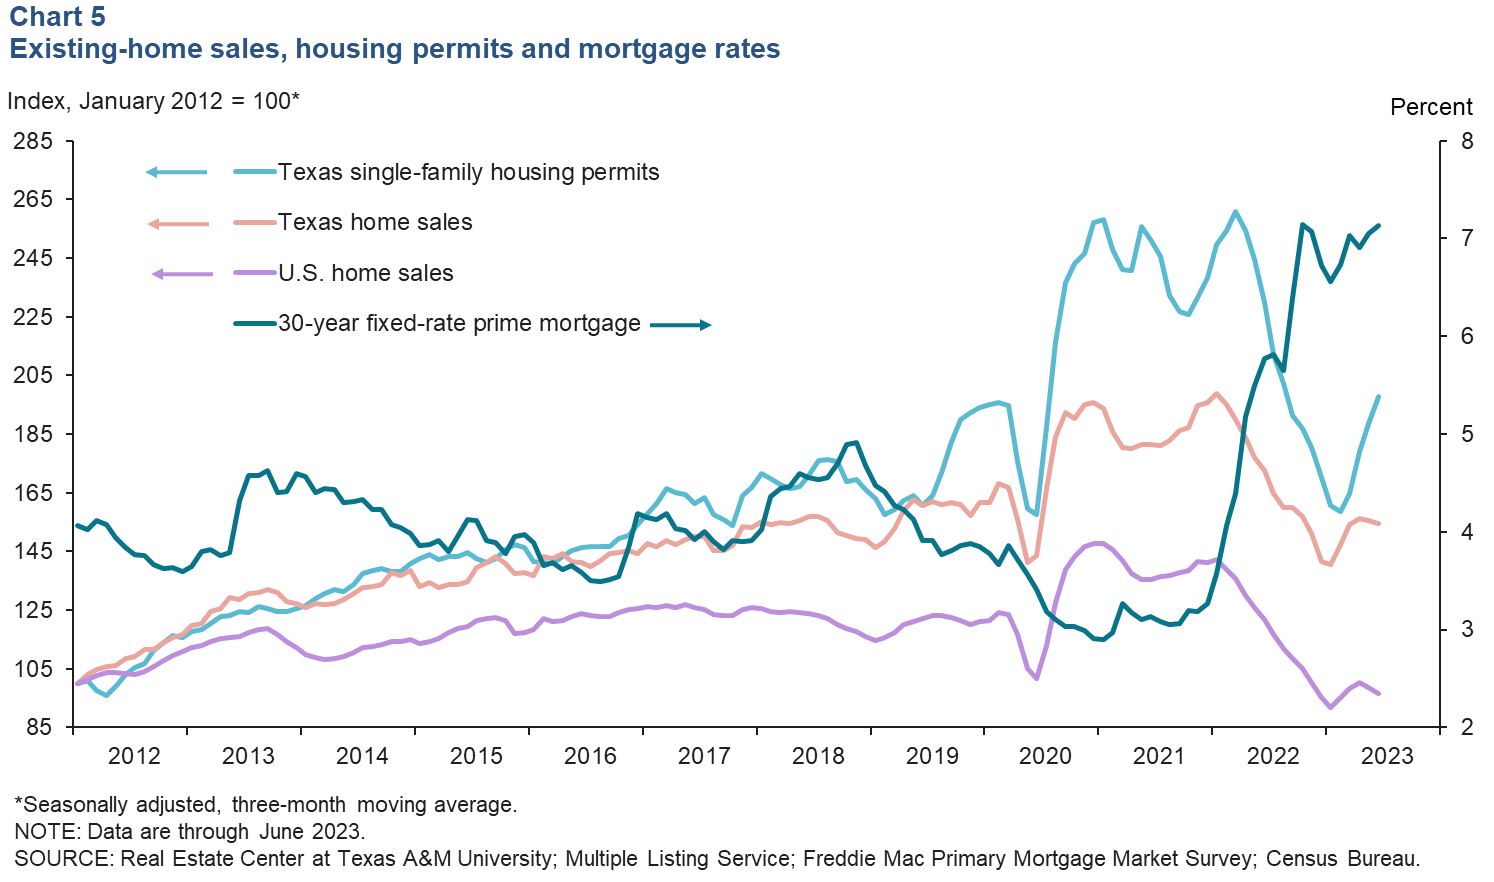
In June, Texas existing-home sales fell by 3.9 percent month over month amid low home inventories, resulting in a total of 28,000 sales (Chart 5). During the same period, U.S. home sales dropped 3.3 percent, marking the slowest pace for June since 2009. High mortgage rates persisted—averaging 7.1 percent in June—and continued to impact housing affordability. Texas single-family housing construction permits increased for a fifth consecutive month—up 5.1 percent in June.
Construction
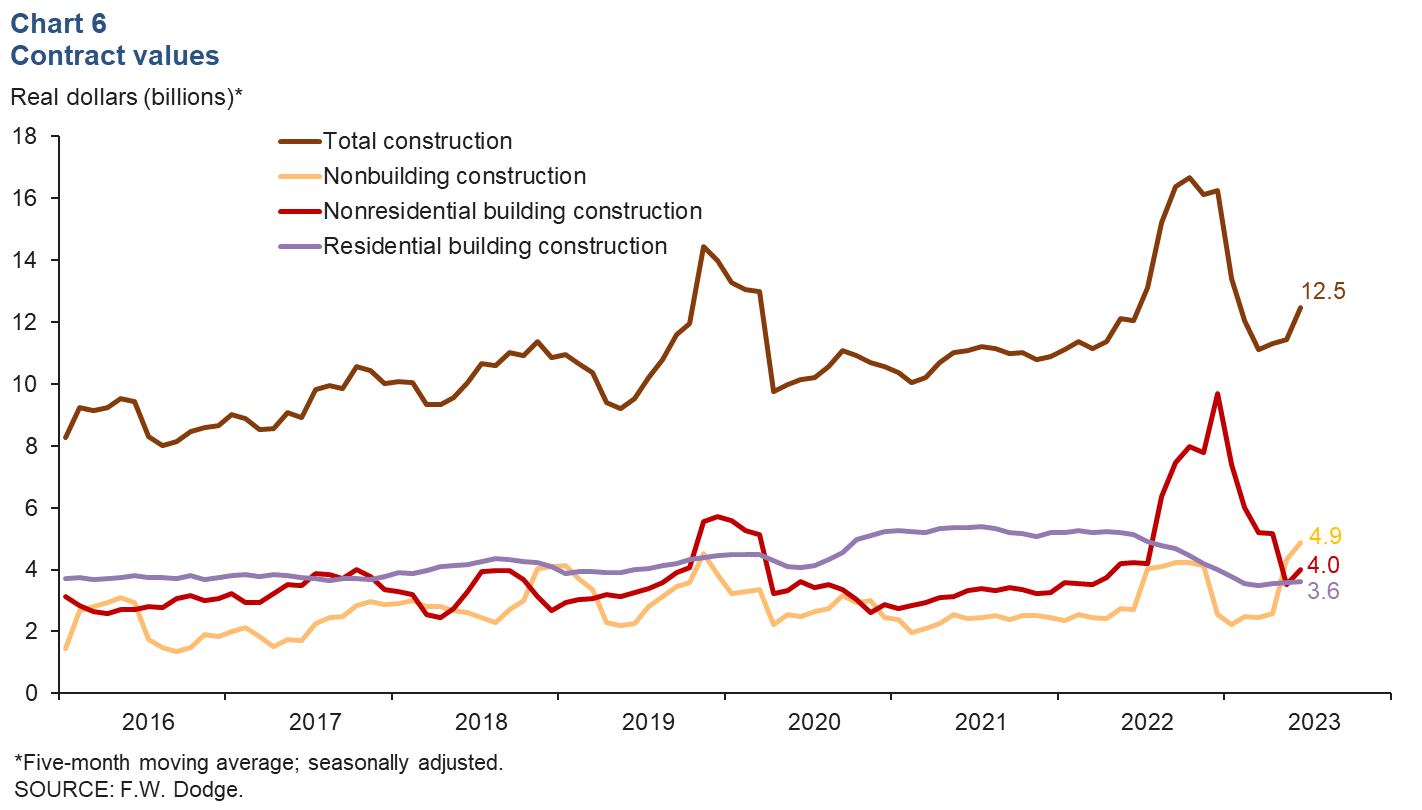
Construction contract values fell in June, though the five-month moving average increased for a third straight month—increasing 9.1 percent to $12.5 billion (Chart 6). Based on a five-month moving average, nonbuilding and residential building construction values increased for the third consecutive month—reaching $4.9 billion and $3.6 billion, respectively. Following a five-month decline, nonresidential values saw an upturn, increasing to $4.0 billion. Year to date through June, total construction contract values were down 2.6 percent compared with the same period in 2022.
NOTE: Data may not match previously published numbers due to revisions.
About Texas Economic Indicators
Questions or suggestions can be addressed to Diego Morales-Burnett at diego.morales-burnett@dal.frb.org. Texas Economic Indicators is published every month during the week after state and metro employment data are released.