Texas Economic Indicators

| Texas economy dashboard (July 2026) | |||
| Job growth (annualized) April '26–July '26 |
Unemployment rate |
Avg. hourly earnings (smoothed)* |
Avg. hourly earnings growth y/y (smoothed)* |
| 1.5% | 4.5% | $35.82 | 3.9% |
*Three-month moving average.
The Texas economic expansion slowed in July. Though employment changed little, it rose broadly in July over the past three months. Unemployment ticked up while wage growth accelerated. The August Texas Business Outlook Surveys showed continued upward pressures on selling prices. The headline consumer price index for Texas slowed alongside most subcategories in June. Exports remained elevated, especially in oil and gas.
Labor market
Employment growth mixed
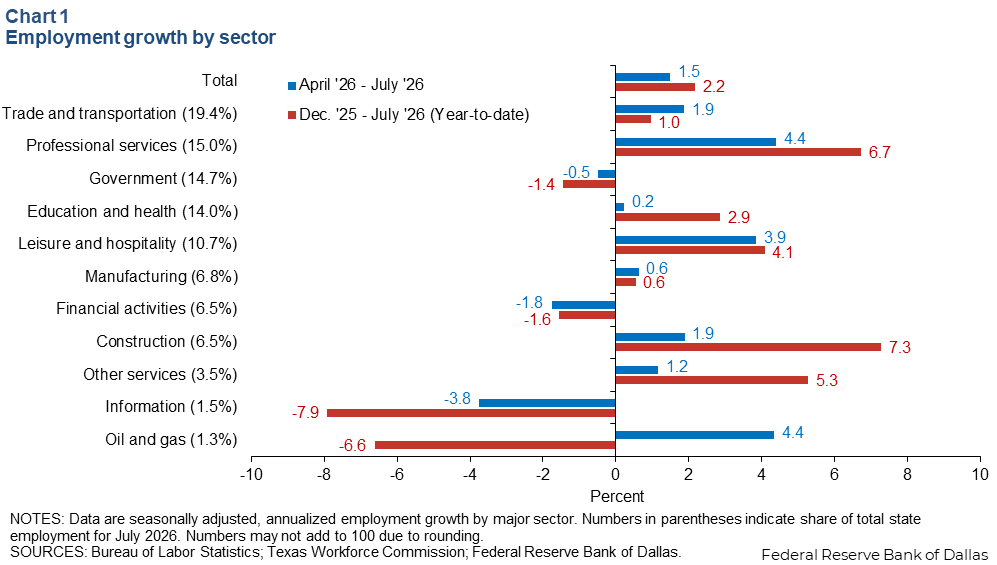
Texas employment ticked down an annualized 0.1 percent in July (1,600 jobs). Payrolls have expanded 1.5 percent since April and 2.2 percent this year (Chart 1). Three-month employment growth was led by professional services, oil and gas, and leisure and hospitality, while employment declined in information, financial activities and government. The Dallas Fed’s Texas Employment Forecast was revised down to 1.7 percent for 2026 (December/December).
Texas unemployment ticks up
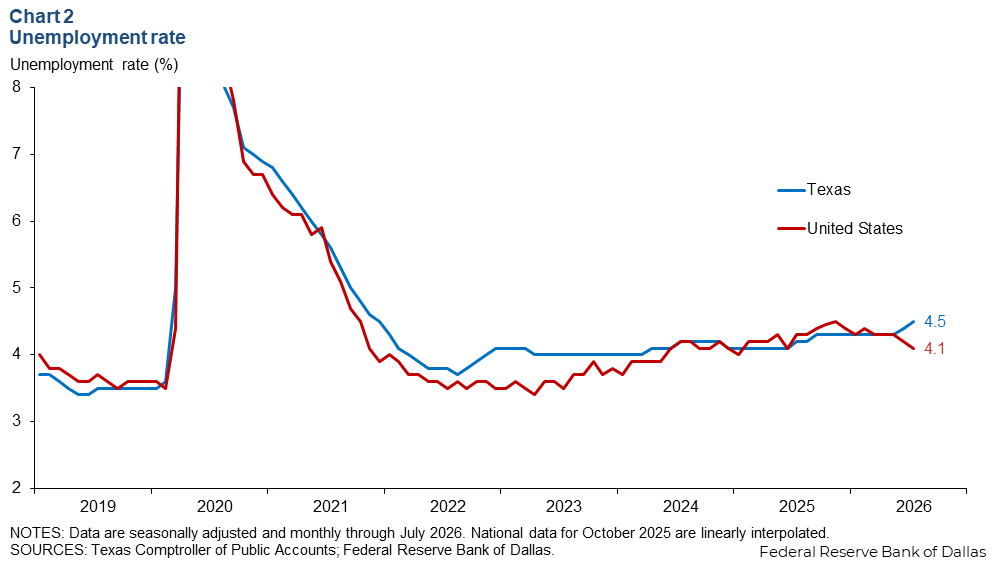
The Texas unemployment rate in July was 4.5 percent (Chart 2). July was the second consecutive month where the state unemployment rate rose after holding steady for nine months. Meanwhile, the nation’s jobless rate decreased to 4.1 percent. Though employment expanded, the unemployment rate can increase due to changes in the labor force. The Texas labor force edged up for the third straight month in July.
Wage growth accelerates
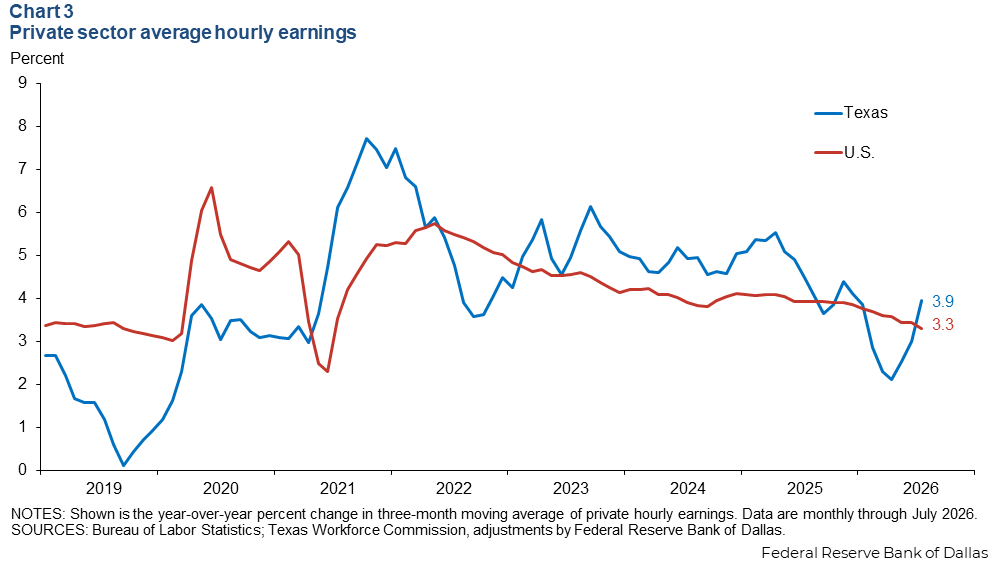
Texas private hourly earnings increased 3.9 percent year over year in July, ahead of the nation’s 3.3 percent rise (Chart 3). Smoothed average hourly earnings in Texas were $35.82 in July, lower than the nation ($37.57). Across major Texas metros, average hourly earnings continued to grow, though the pace of year-over-year wage growth slowed in El Paso and McAllen, was steady in Austin and Houston, and accelerated in Dallas, Fort Worth and San Antonio.
Texas Business Outlook Surveys
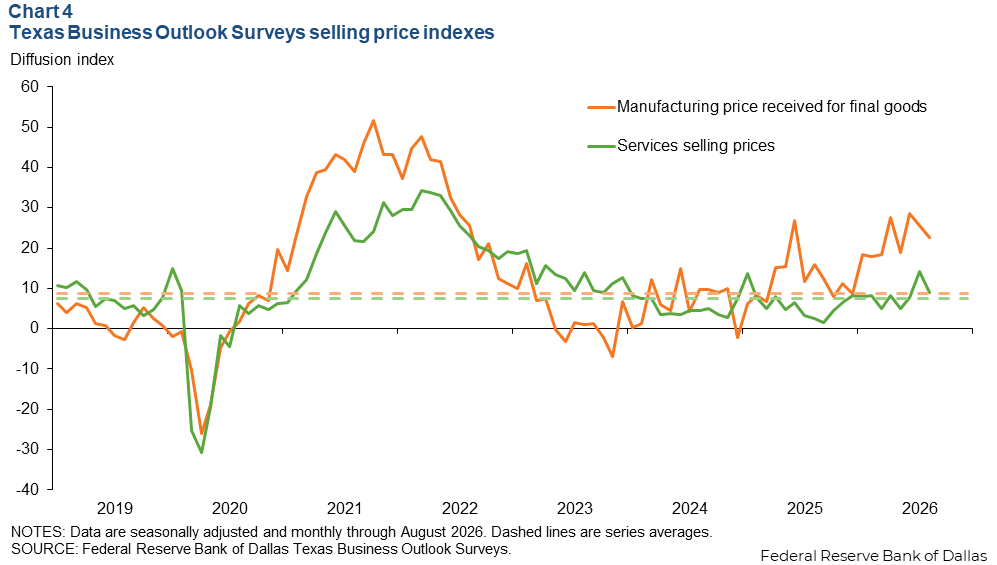
The Texas Business Outlook Surveys indicated continued upward selling price pressures in August (Chart 4). The manufacturing sector’s price received for final goods index declined marginally to 22.7, though it remained elevated—above the series average. The service sector’s selling prices index dipped to 8.9 but stayed above the series average. Both indexes remained in solidly positive territory.
Consumer price index
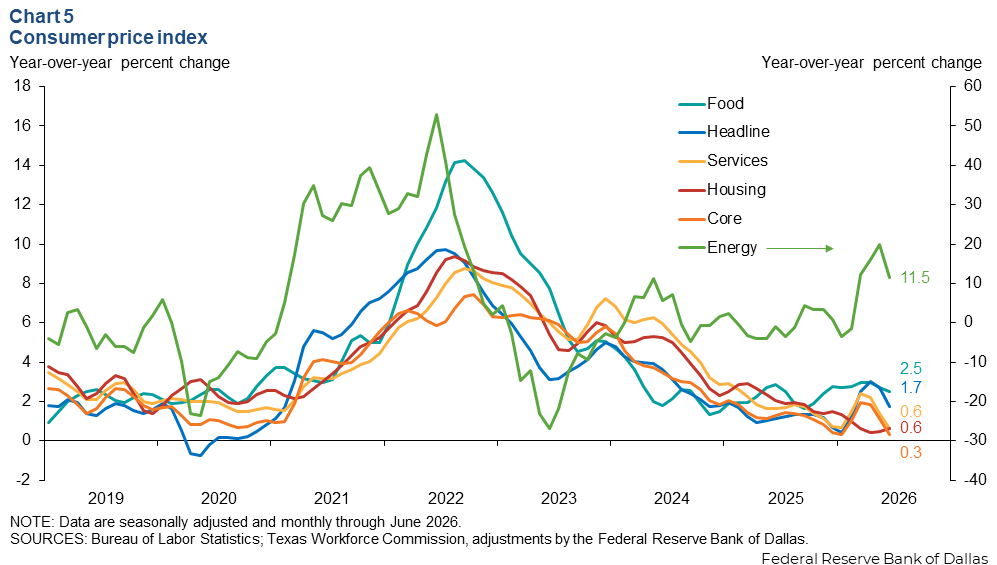
In June, the 12-month change in Texas headline consumer price index (CPI) ticked down to 1.7 percent (Chart 5). Meanwhile, core CPI, which excludes food and energy, moved down to 0.3 percent. Additionally, food and housing rose 2.5 percent and 0.6 percent, respectively. Services inflation was 0.6 percent in June, while energy inflation was elevated at 11.5 percent.
Trade
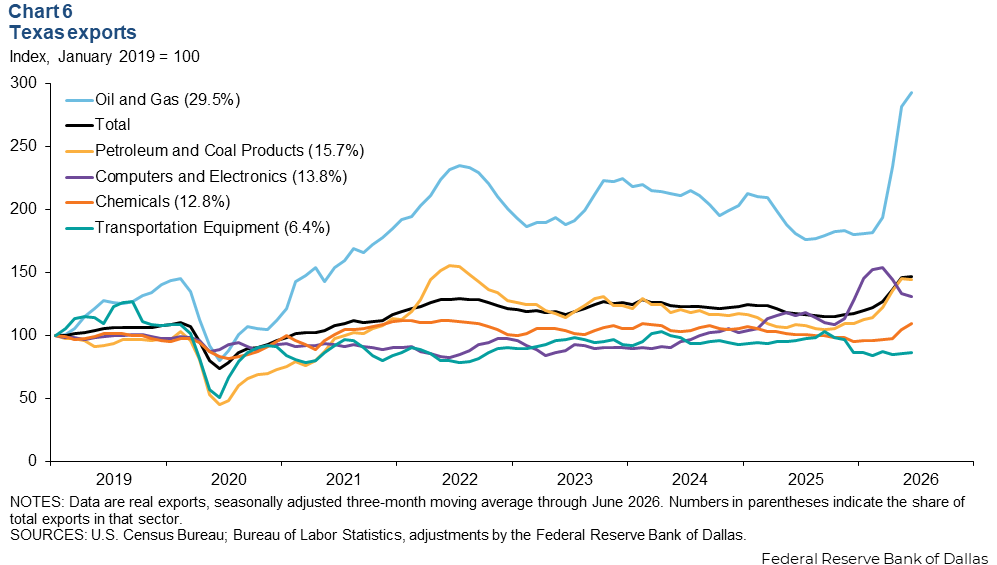
In June, Texas exports declined 9.0 percent, while the three-month moving average ticked up 0.6 percent. Smoothed exports of oil and gas stepped up 4.0 percent and were up 61.8 percent year over year (Chart 6). Skyrocketing oil and gas exports are likely due to the Iran war, with Texas oil and gas exports up 51.4 percent since the start of the conflict. The three-month moving average of exports of chemicals (4.7 percent) and transportation equipment (1.0 percent) also rose, while exports of industrial machinery (4.4 percent), computers and electronics (2.2 percent), and petroleum and coal products (0.2 percent) declined.
NOTE: Data may not match previously published numbers due to revisions.
About Texas Economic Indicators
Questions or suggestions can be addressed to Dylan Council. Texas Economic Indicators publishes monthly after Texas employment data are released.