Texas Economic Indicators

| Texas economy dashboard (September 2026) | |||
| Job growth (annualized) June–Sept. '26 |
Unemployment rate |
Avg. hourly earnings (smoothed)* |
Avg. hourly earnings growth y/y (smoothed)* |
| 0.2% | 4.4% | $36.34 | 5.3% |
The Texas labor market softened in September. Employment fell, with growth mixed across sectors. However, the unemployment rate was flat and wages increased in September. Headline inflation rose, and the October Texas Business Outlook Surveys indicated increased price pressures. Total exports increased and remained well above year earlier levels.
Labor market
Employment growth mixed across sectors
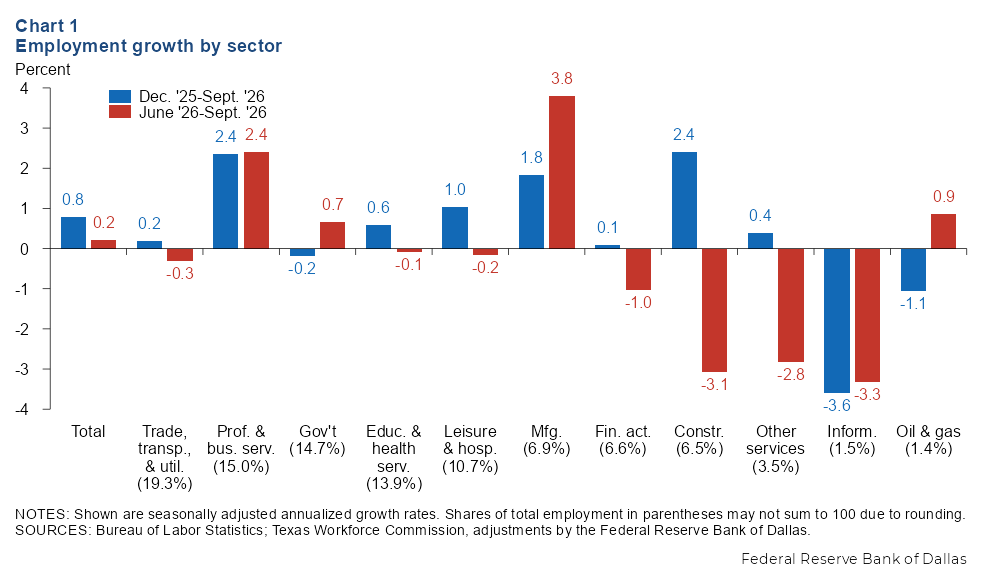
Texas employment declined an annualized 1.6 percent (18,900 jobs) in September, slowing year-to-date growth to an annualized 0.8 percent (Chart 1). Employment growth in the third quarter was sluggish, led by manufacturing, professional and business services, and oil and gas. Employment was flat or down in most major sectors including information, construction and other services. The Federal Reserve Bank of Dallas Texas Employment Forecast for 2026 was revised down to 0.9 percent following a weak September employment report.
Unemployment rate flat
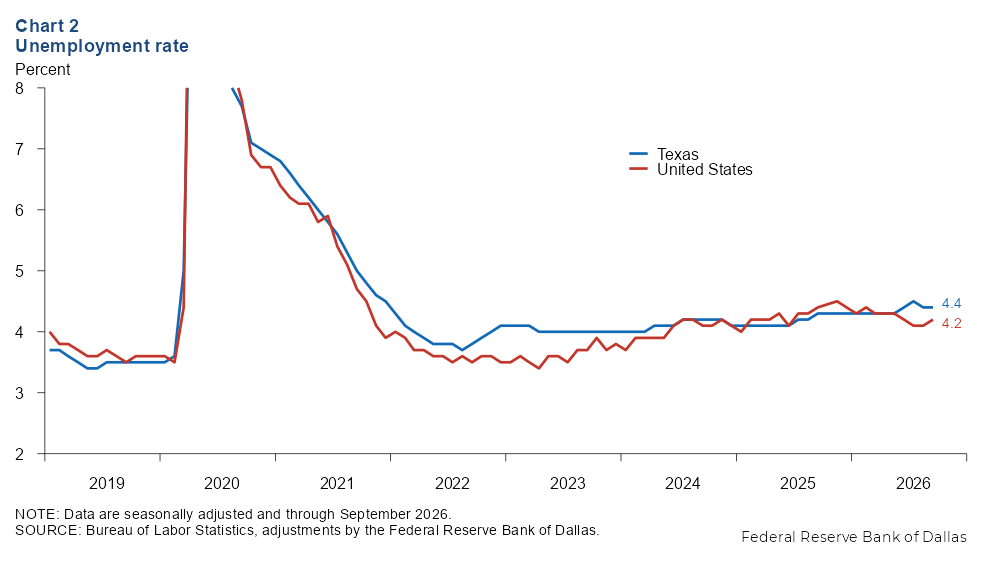
The Texas unemployment rate was unchanged at 4.4 percent in September (Chart 2). The nation's jobless rate was lower at 4.2 percent. Texas' labor force grew an annualized 1.2 percent in September and was nearly unchanged from a year prior.
Wages increase
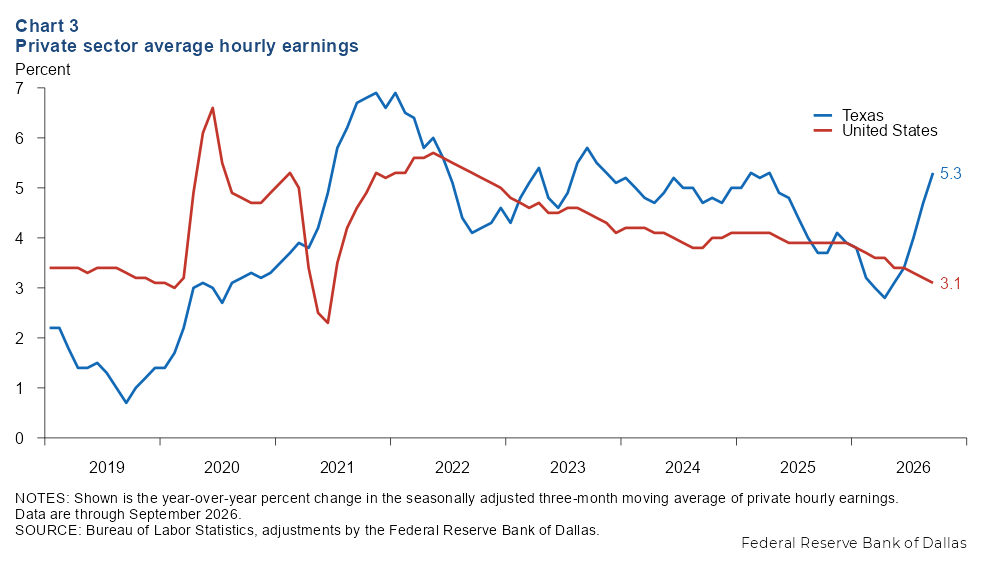
The three-month moving average of nominal hourly wages in Texas increased to $36.34 in September. Year over year, Texas wages grew 5.3 percent in September, faster than the 3.1 percent rise nationally (Chart 3). Wages in Texas are lower than the national average ($37.74).
Texas Business Outlook Surveys
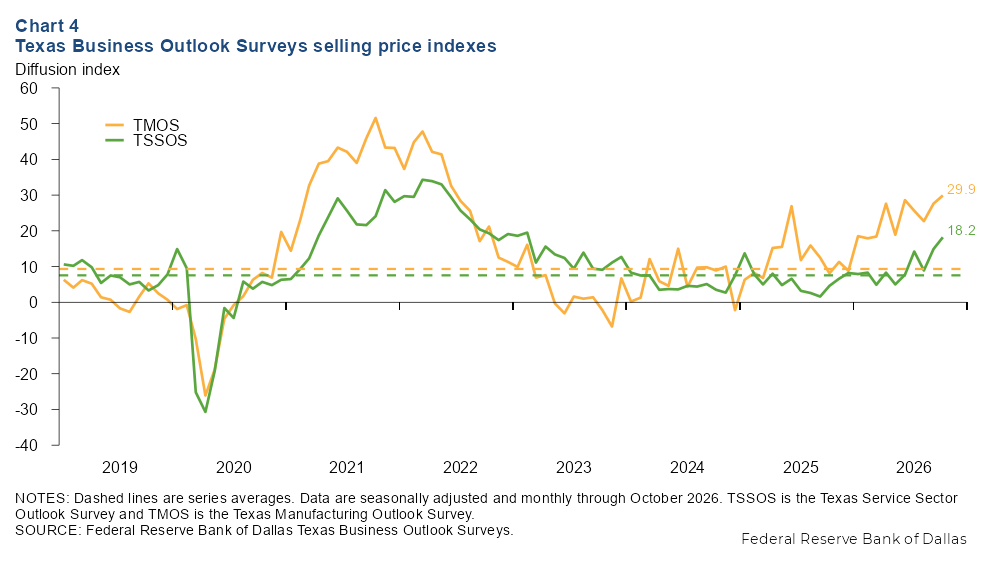
The October Texas Business Outlook Surveys indicated increased selling price pressures. The Texas Manufacturing Outlook Survey’s prices received for finished goods index climbed to 29.9, well above the series average of 9.3 (Chart 4). The Texas Service Sector Outlook Survey’s selling price index rose to 18.2, above the series average of 7.5. Both indexes are at multiyear highs.
Consumer price index
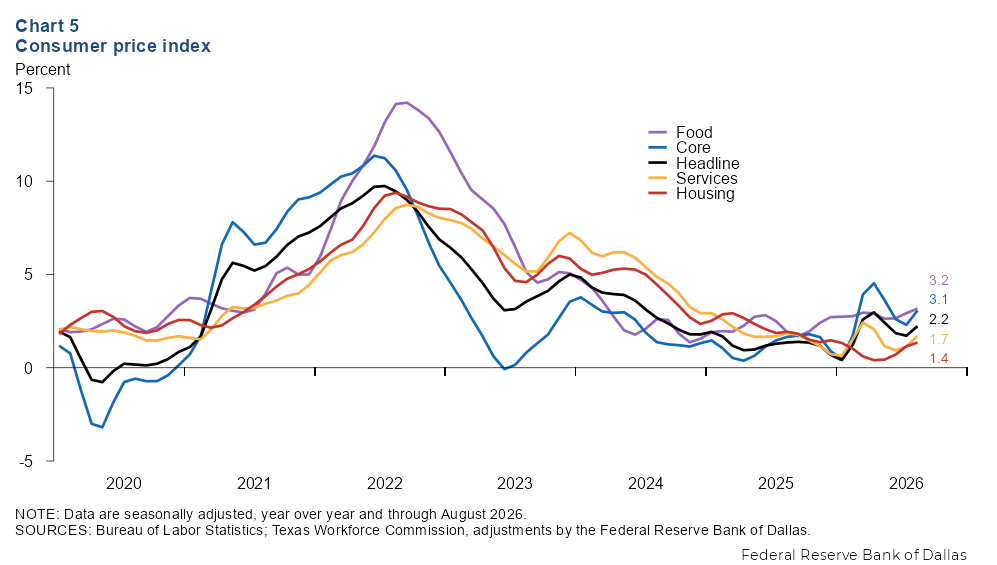
In August, the 12-month change in the Texas headline consumer price index (CPI) rose to 2.2 percent (Chart 5). Meanwhile, core CPI, which excludes food and energy, moved up to 3.1 percent. Food, services and housing CPI grew 3.2 percent, 1.7 percent and 1.4 percent, respectively. Energy prices were up 16.6 percent over the past 12 months, while medical prices increased 3.2 percent and commodities were up 3.1 percent.
Trade
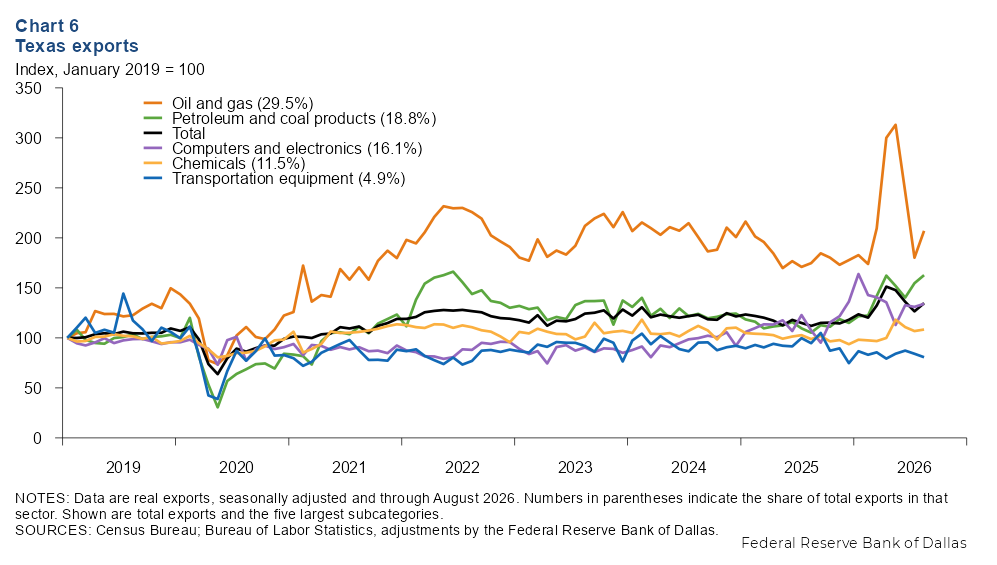
In August, total Texas exports rose 6.5 percent and were 20.3 percent higher than a year prior (Chart 6). Export growth was mixed. Oil and gas exports increased 14.9 percent and were 18.5 percent higher than a year ago, with elevated activity likely driven by the Iran war. Exports grew for petroleum and coal products (5.2 percent), computers and electronics (2.3 percent), and chemicals (1.5 percent), while transportation equipment exports fell 4.1 percent.
NOTE: Data may not match previously published numbers due to revisions.
About Texas Economic Indicators
Questions or suggestions can be addressed to Dylan Council. Texas Economic Indicators publishes monthly after Texas employment data are released.