Agricultural Survey

Survey highlights
Bankers responding to the first-quarter survey reported slightly worsening conditions across most of the Eleventh District. Drought conditions prevailed, and commodity prices remained low. Cattle prices are persistently elevated due to declining inventory; this has boosted income for some but pushed down income for others. In addition, high cattle prices have pushed up loan demand as ranchers need more money to buy replacement cattle. Despite government assistance, the outlook for 2026 income remains weak.
“Conditions are extremely dry and commodity prices remain low, affecting our farm producers,” reported one survey respondent. Farmers are appreciative of government assistance, but declines in commodity prices offset the gains from the assistance, as noted by a participant, “The ad hoc government payments being sent out as we speak will be helpful, but not enough to make up for the drop in price.” High cattle prices are generating winners and losers within the industry, as one commentor said, “Cow-calf operators are seeing record profits due to high calf prices. Feedyard head counts continue to decline with tightening beef supply.”
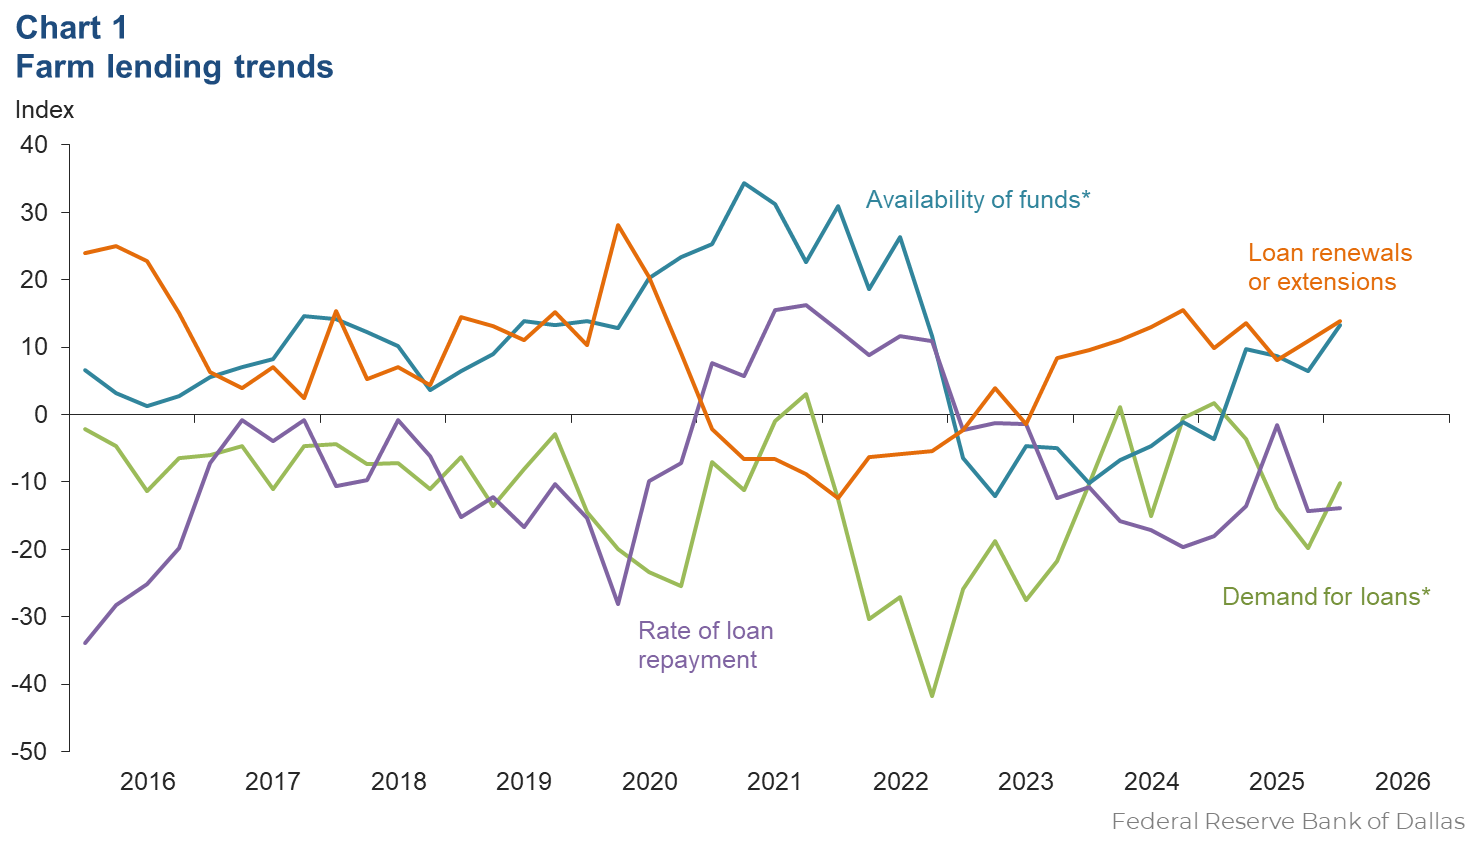
Demand for agricultural loans continued to decline while availability of funds continued to increase in the first quarter. The rate of loan repayment decreased at the same pace as the prior quarter. Loan renewals or extensions continued to rise. Crop storage loan volume increased for the first time in eight years, and operating loan volumes also rose (Chart 1).
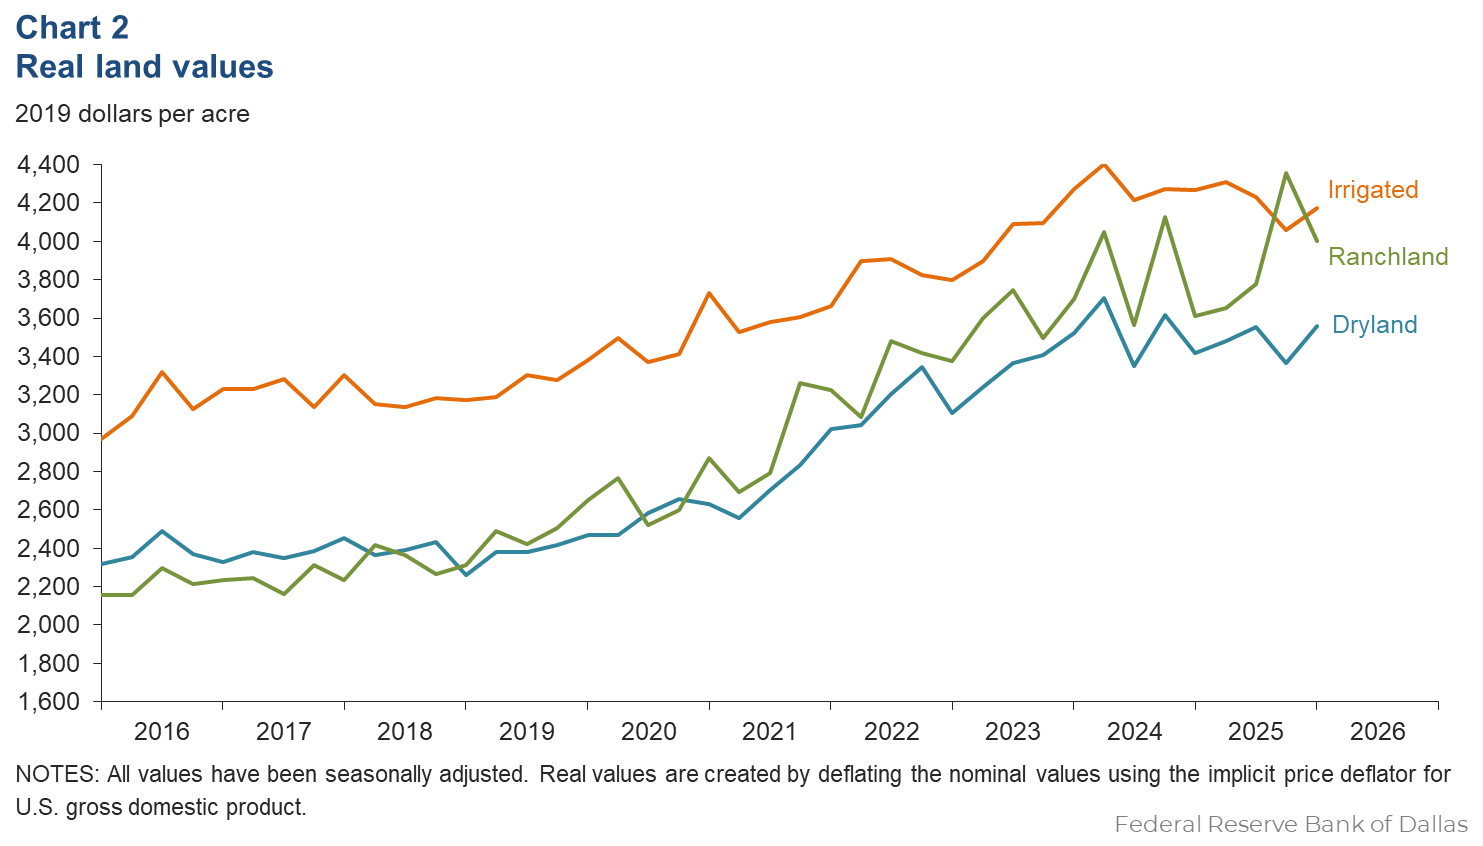
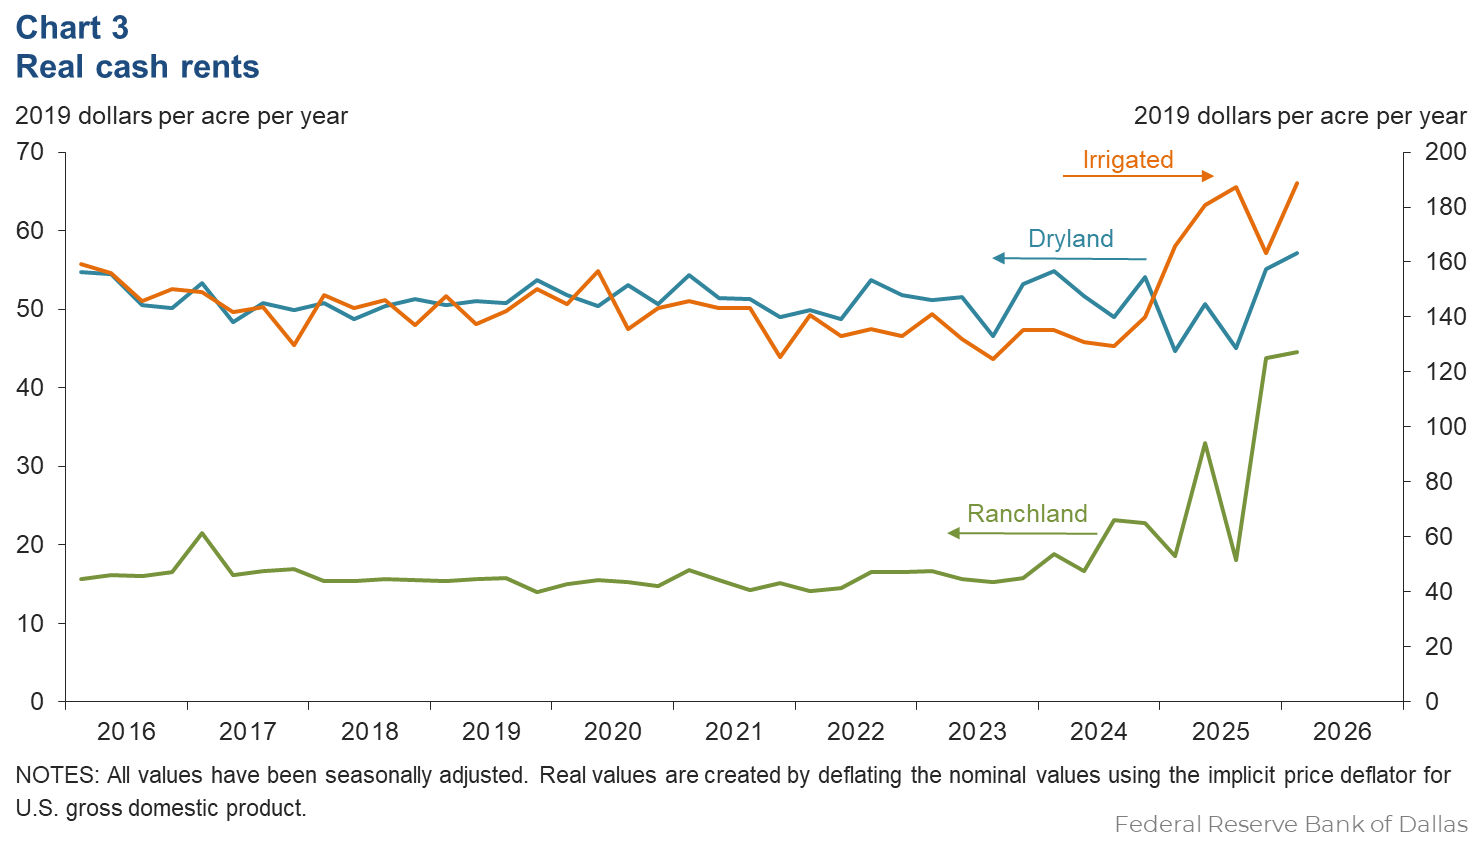
Real land values for dryland and irrigated land increased, but values for ranchland declined this quarter (Chart 2); however, in the district, dryland and ranchland values grew over 7 percent compared to last year, but irrigated land values were flat year over year (Table 1). In the first quarter of 2026, real cash rents rose for all three (Chart 3).
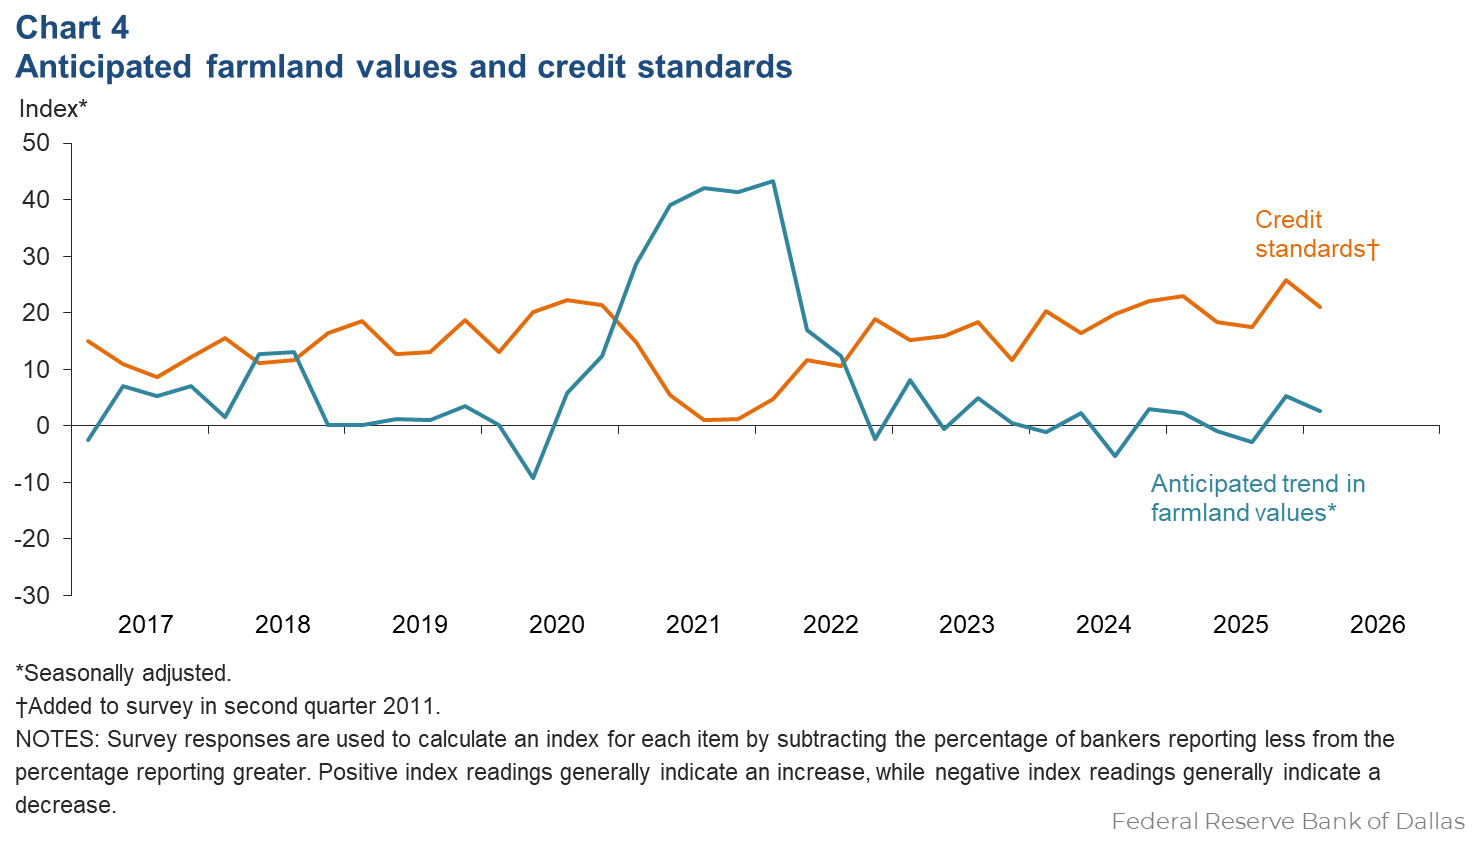
The index for the anticipated trend in farmland values increased slightly in the first quarter. This implies respondents expect farmland values to increase a touch. The credit standards index showed an increase in credit tightening (Chart 4). A respondent noted that weak farm outlook and risk in cattle prices have led them to scrutinize ag loan requests more than previously. Interest rates declined for all types in the current quarter (Table 2).
Next release: June 3, 2026
Agricultural Survey is compiled from a survey of Eleventh District agricultural bankers, and data have been seasonally adjusted as necessary. Data were collected March 3–11, and 59 bankers responded to the survey.
Tables
Rural real estate values—first quarter 2026
| Banks1 | Average value2 | Percent change in value from previous year3 | ||
Cropland–Dryland | ||||
| District* | 44 | 3,629 | 7.8 |
| Texas* | 38 | 3,688 | 7.6 |
1 | Northern High Plains | 6 | 1,383 | –1.0 |
2 | Southern High Plains | 5 | 1,400 | –5.1 |
3 | Northern Low Plains* | n.a. | n.a. | n.a. |
4 | Southern Low Plains* | 5 | 2,210 | 4.0 |
5 | Cross Timbers | n.a. | n.a. | n.a. |
6 | North Central Texas | 4 | 7,625 | 20.8 |
7 | East Texas* | n.a. | n.a. | n.a. |
8 | Central Texas | 5 | 6,600 | 5.2 |
9 | Coastal Texas | n.a. | n.a. | n.a. |
10 | South Texas | 3 | 3,567 | 0.0 |
11 | Trans–Pecos and Edwards Plateau | 3 | 5,750 | 18.1 |
12 | Southern New Mexico | 4 | 725 | 26.1 |
13 | Northern Louisiana | n.a. | n.a. | n.a. |
Cropland–Irrigated | ||||
| District* | 39 | 4,254 | –0.3 |
| Texas* | 33 | 3,534 | –1.9 |
1 | Northern High Plains | 6 | 3,325 | –5.8 |
2 | Southern High Plains | 5 | 2,600 | 3.4 |
3 | Northern Low Plains* | n.a. | n.a. | n.a. |
4 | Southern Low Plains | 5 | 3,590 | –0.6 |
5 | Cross Timbers | n.a. | n.a. | n.a. |
6 | North Central Texas | 3 | 8,000 | 6.7 |
7 | East Texas | n.a. | n.a. | n.a. |
8 | Central Texas | 3 | 5,900 | 1.4 |
9 | Coastal Texas | n.a. | n.a. | n.a. |
10 | South Texas | 3 | 4,667 | 0.0 |
11 | Trans–Pecos and Edwards Plateau | n.a. | n.a. | n.a. |
12 | Southern New Mexico | 4 | 9,250 | 4.5 |
13 | Northern Louisiana | n.a. | n.a. | n.a. |
Ranchland | ||||
| District* | 47 | 4,081 | 7.1 |
| Texas* | 40 | 4,859 | 6.9 |
1 | Northern High Plains | 6 | 1,083 | –23.0 |
2 | Southern High Plains | 4 | 1,325 | 0.0 |
3 | Northern Low Plains | n.a. | n.a. | n.a. |
4 | Southern Low Plains* | 4 | 2,575 | –2.6 |
5 | Cross Timbers | n.a. | n.a. | n.a. |
6 | North Central Texas | 4 | 8,000 | 2.4 |
7 | East Texas | 5 | 4,450 | –5.1 |
8 | Central Texas | 4 | 11,500 | 6.9 |
9 | Coastal Texas | n.a. | n.a. | n.a. |
10 | South Texas | 3 | 3,600 | 0.0 |
11 | Trans–Pecos and Edwards Plateau | 4 | 6,000 | 14.7 |
12 | Southern New Mexico | 5 | 710 | 11.8 |
13 | Northern Louisiana | n.a. | n.a. | n.a. |
| *Seasonally adjusted. 1 Number of banks reporting land values. 2 Prices are dollars per acre, not adjusted for inflation. 3 Not adjusted for inflation and calculated using responses only from those banks reporting in both the past and current quarter. n.a.—Not published due to insufficient responses but included in totals for Texas and district. |
||||
Interest rates by loan type—first quarter 2026
| Feeder cattle | Other farm operating | Intermediate term | Long-term farm real estate | Fixed (average rate, percent) |
2025:Q1 | 8.63 | 8.59 | 8.26 | 7.94 |
2025:Q2 | 8.51 | 8.53 | 8.20 | 7.88 |
2025:Q3 | 8.35 | 8.30 | 8.11 | 7.84 |
2025:Q4 | 8.06 | 8.06 | 7.87 | 7.38 |
2026:Q1 | 7.76 | 7.83 | 7.62 | 7.34 | Variable (average rate, percent) |
2025:Q1 | 8.67 | 8.58 | 8.39 | 8.02 |
2025:Q2 | 8.48 | 8.49 | 8.12 | 7.96 |
2025:Q3 | 8.45 | 8.38 | 8.09 | 7.76 |
2025:Q4 | 8.07 | 8.12 | 7.92 | 7.54 |
2026:Q1 | 7.85 | 7.89 | 7.76 | 7.42 |
Charts
Farm lending trends
What changes occurred in non-real-estate farm loans at your bank in the past three months compared with a year earlier?
| Index | Percent reporting, Q1 | ||||
| 2025:Q4 | 2026:Q1 | Greater | Same | Less | |
Demand for loans* | –19.8 | –10.2 | 10.6 | 68.6 | 20.8 |
Availability of funds* | 6.4 | 13.3 | 14.7 | 83.9 | 1.4 |
Rate of loan repayment | –14.3 | –13.8 | 1.7 | 82.8 | 15.5 |
Loan renewals or extensions | 10.9 | 13.8 | 19.0 | 75.9 | 5.2 |
| *Seasonally adjusted. | |||||

What changes occurred in the volume of farm loans made by your bank in the past three months compared with a year earlier?
| Index | Percent reporting, Q1 | ||||
| 2025:Q4 | 2026:Q1 | Greater | Same | Less | |
Non–real–estate farm loans | –5.5 | –1.8 | 12.5 | 73.2 | 14.3 |
Feeder cattle loans* | 5.6 | –6.7 | 17.2 | 58.9 | 23.9 |
Dairy loans* | –13.6 | –3.7 | 0.0 | 96.3 | 3.7 |
Crop storage loans* | –5.9 | 9.1 | 15.4 | 78.3 | 6.3 |
Operating loans | 1.9 | 5.3 | 17.5 | 70.2 | 12.3 |
Farm machinery loans* | –25.4 | –27.3 | 0.0 | 72.7 | 27.3 |
Farm real estate loans* | –14.3 | –17.4 | 1.7 | 79.2 | 19.1 |
| *Seasonally adjusted. NOTES: Survey responses are used to calculate an index for each item by subtracting the percentage of bankers reporting less from the percentage reporting greater. Positive index readings generally indicate an increase, while negative index readings generally indicate a decrease. |
|||||
Real land values

Real cash rents

Anticipated farmland values and credit standards
What trend in farmland values do you expect in your area in the next three months?
| Index | Percent reporting, Q1 | ||||
| 2025:Q4 | 2026:Q1 | Up | Same | Down | |
| Anticipated trend in farmland values* | 5.2 | 2.6 | 11.3 | 80.0 | 8.7 |
| *Seasonally adjusted. | |||||
What change occurred in credit standards for agricultural loans at your bank in the past three months compared with a year earlier?
| 2025:Q4 | 2026:Q1 | Up | Same | Down | |
| Credit standards | 25.9 | 21.1 | 21.1 | 79.0 | 0.0 |

Quarterly comments

District bankers were asked for additional comments concerning agricultural land values and credit conditions. Some comments have been edited for grammar and clarity.
- Conditions are extremely dry and commodity prices remain low, affecting our farm producers.
- It’s extremely dry with high fire danger in the Panhandle. Farm projections are showing declining liquidity and equity. Cow-calf operators are seeing record profits due to high calf prices. Feedyard head counts continue to decline with tightening beef supply.
- Farm Bridge Assistance (FBA) payments are going to make a difference. Not enough, but [it is] real help
- Drought conditions have producers concerned. Wheat pasture is in poor condition. In general the economic outlook is bleak. The cost of insurance has skyrocketed, forcing producers to cheaper options with less coverage. Low commodity prices matched with high inputs do not bode well for positive cash flow projections.
- We had a decent cotton crop regionally, however, the low cotton prices created hardships to cover input costs. Wheat is looking decent as well, as we have had some rainfall of late.
- Rice farmers in the area are suffering substantially. The dramatic decline in price last fall significantly impacted the producers in a negative way. The ad hoc government payments being sent out as we speak will be helpful, but not enough to make up the drop in price. Producers will have to lean on accumulated equity to borrow for the 2026 crop year.
- Farm income projections for 2026 still remain weak with dependence on government assistance from the FBA and future Price Loss Coverage payments to manage cashflow underwriting. Persistent drought conditions deepen risks, as planting has started for grain crops. The current outlook in local farming for 2026 continues to worsen. Cattle requests still remain strong, as cow herd inventories nationally continue their decreasing trend. Increased prices for replacements have increased the need and demand for borrowing. We will be watching drought conditions this spring to assess risk of local market price fluctuations. The bank has been reviewing both farm and ranch requests with more scrutiny given farm weaknesses and downside price risk for cattle. Farm and ranch land prices have started to come off highs, as interest rates remain elevated compared to historical lows. Fed posturing limits hope of future rate cuts, and borrowing for ag properties remains modest.
- Agricultural land values appear to be stable and holding. Demand for small ranch tracts is good and continues to bring premium prices. Drought conditions continue to prevail across the region with no real sign of relief in sight. Some producers have delayed plantings taking a wait-and-see approach to determine what best to plant to maximize returns and minimize losses.
- The 2026 farming season has begun. Commodity price expectations are stable to lower than 2025. Winter moisture was welcomed in February, but dry, windy conditions persist, and moisture is needed, particularly on range land. Cattle prices remain very high, but uncertainty exists within the ranching community.
Historical data
Historical data can be downloaded dating back to first quarter 2000.
For More Information
Questions regarding the Agricultural Survey can be addressed to Mariam Yousuf at Mariam.Yousuf@dal.frb.org.