Banking Conditions Survey

October 2020
October 2020
What’s New
For this survey, respondents were asked supplemental questions on the impacts of the coronavirus (COVID-19). Read the special questions results.
Many financial institutions are participating in the Small Business Administration’s Paycheck Protection Program (PPP), launched on April 3, 2020. For this survey, respondents were asked to answer the questions excluding PPP loans.
Results Tables
Historical data are available from March 2017.
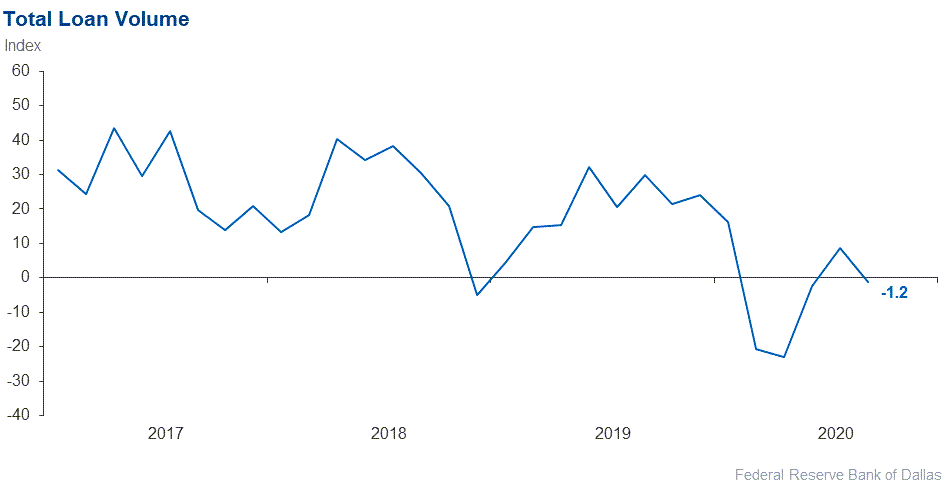
| Total Loans: Over the past six weeks, how have the following changed? | |||||
| Indicator | Current Index | Previous Index | % Reporting Increase | % Reporting No Change | % Reporting Decrease |
Loan volume | –1.2 | 8.7 | 32.1 | 34.6 | 33.3 |
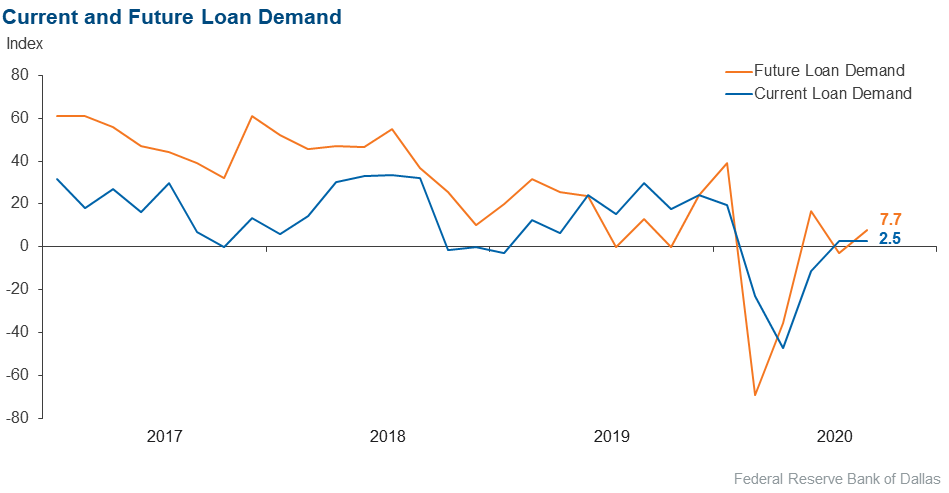
Loan demand | 2.5 | 2.9 | 33.3 | 35.9 | 30.8 |
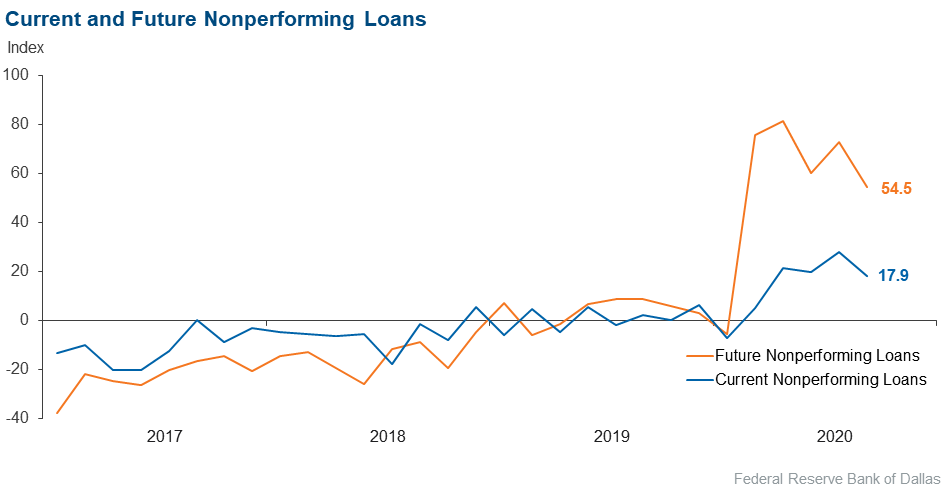
Nonperforming loans | 17.9 | 27.9 | 28.2 | 61.5 | 10.3 |
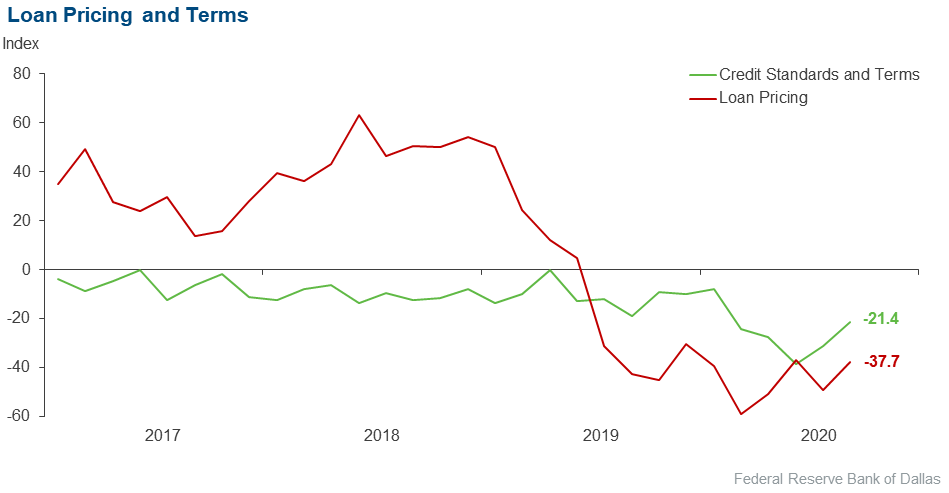
Loan pricing | –37.7 | –49.2 | 5.2 | 51.9 | 42.9 |
| Indicator | Current Index | Previous Index | % Reporting Eased | % Reporting No Change | % Reporting Tightened |
Credit standards and terms | –21.4 | –31.2 | 1.3 | 76.0 | 22.7 |
| Commercial and Industrial Loans: Over the past six weeks, how have the following changed? | |||||
| Indicator | Current Index | Previous Index | % Reporting Increase | % Reporting No Change | % Reporting Decrease |
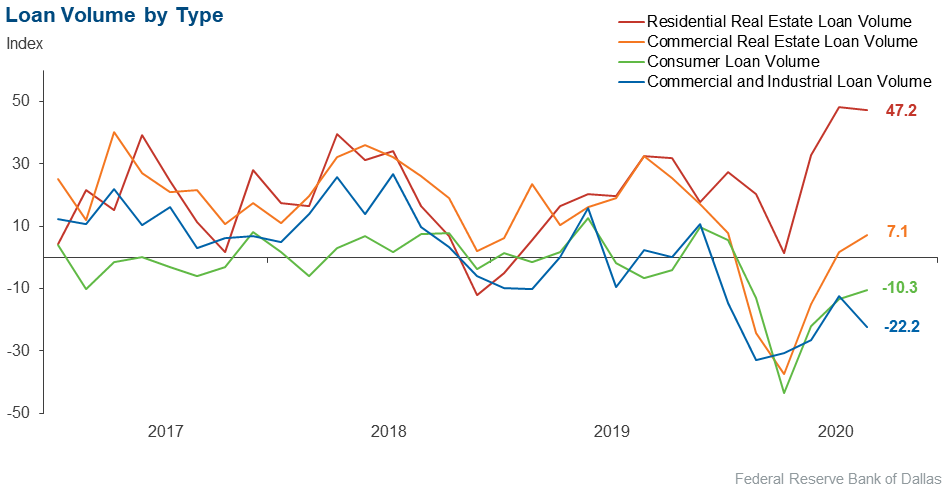
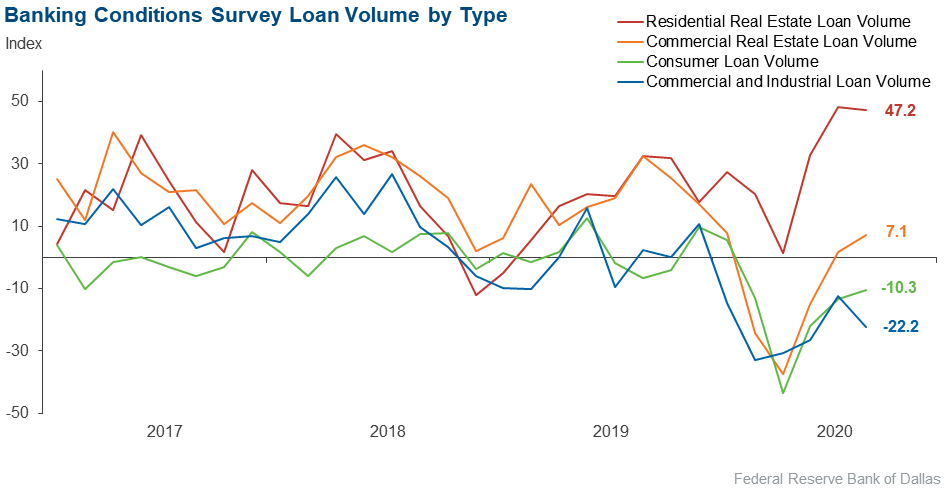
Loan volume | –22.2 | –12.3 | 11.1 | 55.6 | 33.3 |
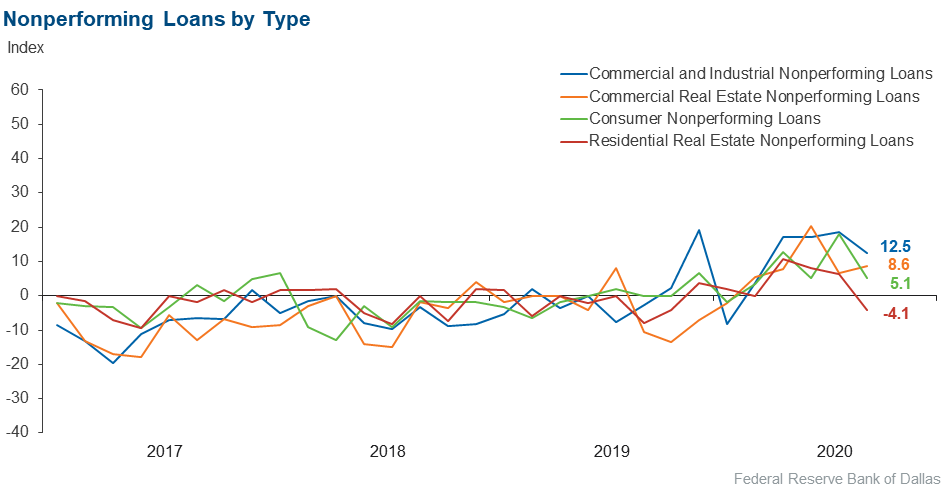
Nonperforming loans | 12.5 | 18.7 | 13.9 | 84.7 | 1.4 |
| Indicator | Current Index | Previous Index | % Reporting Eased | % Reporting No Change | % Reporting Tightened |
Credit standards and terms | –22.5 | –27.4 | 0.0 | 77.5 | 22.5 |
| Commercial Real Estate Loans: Over the past six weeks, how have the following changed? | |||||
| Indicator | Current Index | Previous Index | % Reporting Increase | % Reporting No Change | % Reporting Decrease |
Loan volume | 7.1 | 1.6 | 26.8 | 53.5 | 19.7 |
Nonperforming loans | 8.6 | 6.7 | 14.3 | 80.0 | 5.7 |
| Indicator | Current Index | Previous Index | % Reporting Eased | % Reporting No Change | % Reporting Tightened |
Credit standards and terms | –23.9 | –25.0 | 0.0 | 76.1 | 23.9 |
| Residential Real Estate Loans: Over the past six weeks, how have the following changed? | |||||
| Indicator | Current Index | Previous Index | % Reporting Increase | % Reporting No Change | % Reporting Decrease |
Loan volume | 47.2 | 48.4 | 56.9 | 33.3 | 9.7 |
Nonperforming loans | –4.1 | 6.2 | 2.8 | 90.3 | 6.9 |
| Indicator | Current Index | Previous Index | % Reporting Eased | % Reporting No Change | % Reporting Tightened |
Credit standards and terms | –9.7 | –9.3 | 0.0 | 90.3 | 9.7 |
| Consumer Loans: Over the past six weeks, how have the following changed? | |||||
| Indicator | Current Index | Previous Index | % Reporting Increase | % Reporting No Change | % Reporting Decrease |
Loan volume | –10.3 | –13.4 | 14.1 | 61.5 | 24.4 |
Nonperforming loans | 5.1 | 17.9 | 11.5 | 82.1 | 6.4 |
| Indicator | Current Index | Previous Index | % Reporting Eased | % Reporting No Change | % Reporting Tightened |
Credit standards and terms | –9.1 | –11.9 | 1.3 | 88.3 | 10.4 |
| Banking Outlook: What is your expectation for the following items six months from now? | |||||
| Indicator | Current Index | Previous Index | % Reporting Increase | % Reporting No Change | % Reporting Decrease |
Total loan demand | 7.7 | –2.9 | 35.9 | 35.9 | 28.2 |
Nonperforming loans | 54.5 | 72.7 | 61.0 | 32.5 | 6.5 |
| General Business Activity: What is your evaluation of the level of activity? | |||||
| Indicator | Current Index | Previous Index | % Reporting Better | % Reporting No Change | % Reporting Worse |
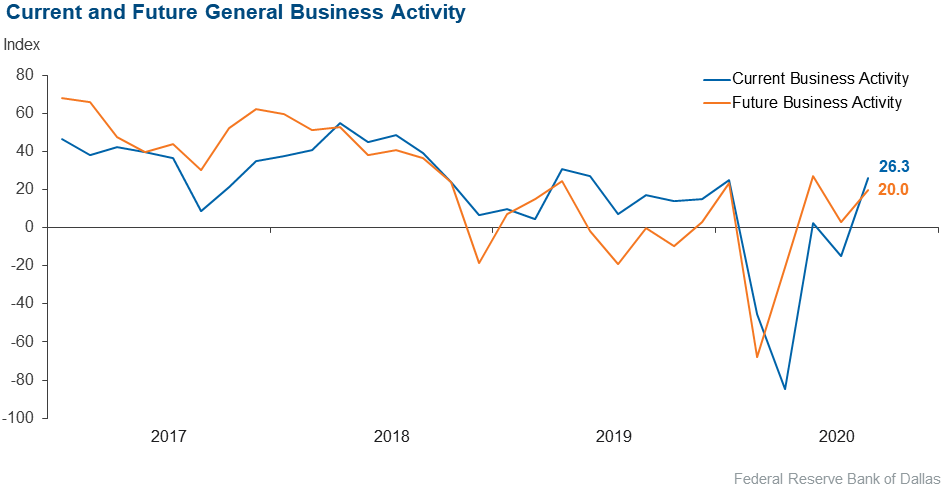
Over the past six weeks | 26.3 | –14.7 | 44.7 | 36.8 | 18.4 |
Six months from now | 20.0 | 3.0 | 46.7 | 26.7 | 26.7 |
Next release: November 16
|
Data were collected Sept 22–30, and 78 financial institutions responded to the survey. The Federal Reserve Bank of Dallas conducts the Banking Conditions Survey twice each quarter to obtain a timely assessment of activity at banks and credit unions headquartered in the Eleventh Federal Reserve District. CEOs or senior loan officers of financial institutions report on how conditions have changed for indicators such as loan volume, nonperforming loans and loan pricing. Respondents are also asked to report on their banking outlook and their evaluation of general business activity. Survey responses are used to calculate an index for each indicator. Each index is calculated by subtracting the percentage of respondents reporting a decrease (or tightening) from the percentage reporting an increase (or easing). When the share of respondents reporting an increase exceeds the share reporting a decrease, the index will be greater than zero, suggesting the indicator has increased over the prior reporting period. If the share of respondents reporting a decrease exceeds the share reporting an increase, the index will be below zero, suggesting the indicator has decreased over the prior reporting period. An index will be zero when the number of respondents reporting an increase is equal to the number reporting a decrease. |
October 2020
October 2020
Respondents were given an opportunity to comment on any issues that may be affecting their business.
These comments are from respondents’ completed surveys and have been edited for publication.
- To date, we have not seen a decline in credit quality, but we expect some deterioration beginning toward the end of the year or first quarter 2021.
- Lending terms appear to be tightening, and there is a search for quality loans in our area. Margins are beginning to show early signs of pressure as our investments in the loan and security portfolio start to mature. We are finding it increasingly difficult to find investment securities to replace maturing securities in the investment portfolio that correspond to matching risk with yield.
- Our county is experiencing growth in both residential and some commercial. This is due to our location to the metroplex, affordable lots and land, and the construction of Bois d'Arc Lake—the first major reservoir to be built in Texas for over 30 years. Scheduled completion is summer of 2021. This event will impact our economy now and for years to come.
- We are looking to see what will happen when the PPP [Paycheck Protection Program] money runs out. We are concerned about the fourth quarter.
- PPP forgiveness continues to be a distraction to our customers and our bankers.
- COVID-19 issues and issues surrounding the fall election are my greatest concerns.
- We are concerned about the delay and/or lack of additional stimulus for small businesses and consumers, which we consider to be Main Street America. We believe that general business activity may worsen over the next six months as PPP funds and other stimulus funds have been exhausted, and there is potential for an increase in virus cases going into the winter months. We are also concerned about the complex structure, tight parameters and lack of support provided by the Main Street Lending program to Main Street America.
- The country is not being allowed to confront the virus. We as a nation now have a pretty good idea as to what can be done to minimize the risk of getting the virus and protect the most vulnerable among us. However, we are not being allowed to put that knowledge to work and get the economy moving back to normal.
- The PPP loan forgiveness process and timeline are a concern. We have several loans approved for forgiveness since the forgiveness portal opened on Aug. 10. These loans remain in a “pending validation” status on the portal. Our commercial customers are holding off on capital improvements and additional hiring until they know their PPP loans have been forgiven.
Historical Data
Historical data can be downloaded dating back to March 2017. For the definitions, see data definitions.
NOTE: The following series were discontinued in May 2020: volume of core deposits, cost of funds, non-interest income and net interest margin.
Questions regarding the Banking Conditions Survey can be addressed to Emily Kerr at emily.kerr@dal.frb.org.
Sign up for our email alert to be automatically notified as soon as the latest Banking Conditions Survey is released on the web.