Banking Conditions Survey

Loan demand continues to fall sharply
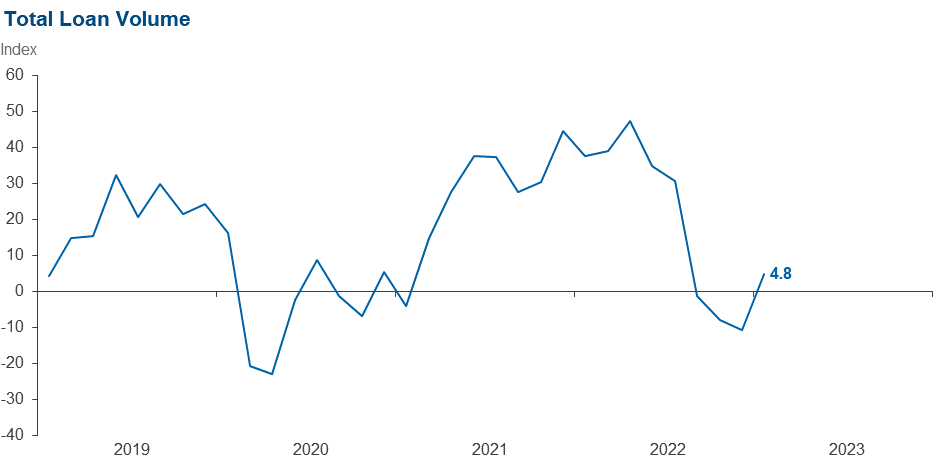
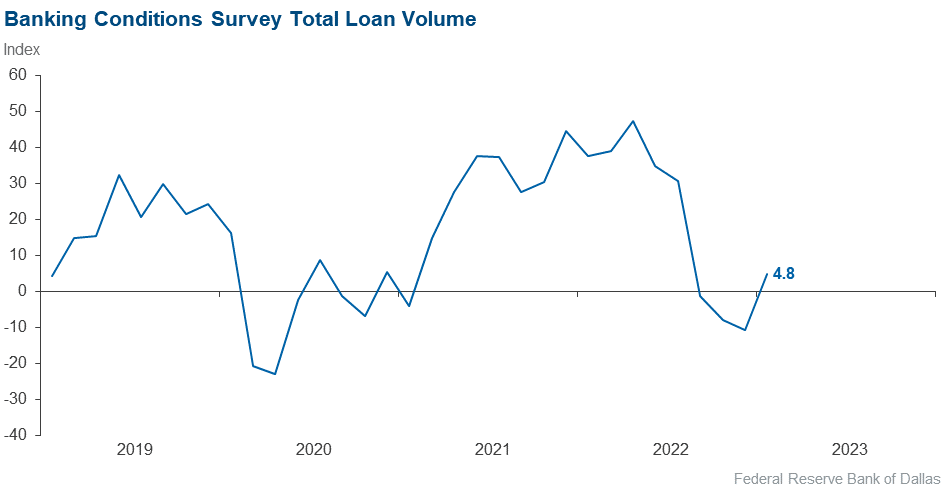
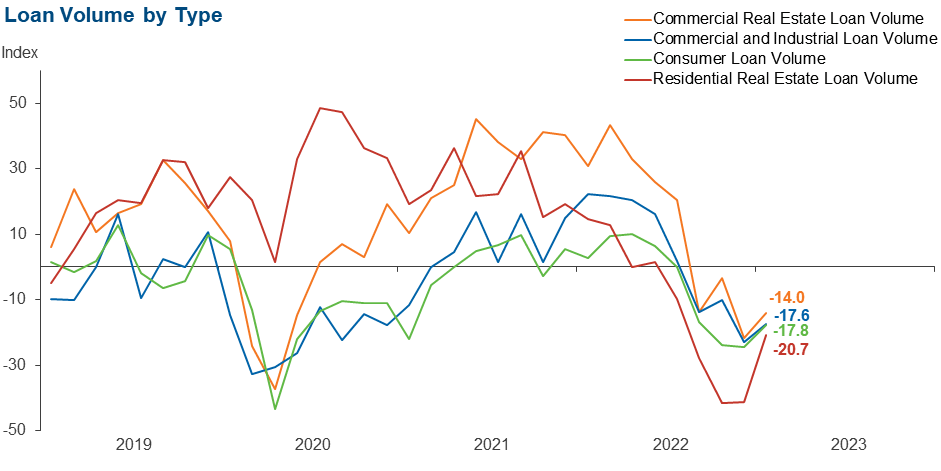
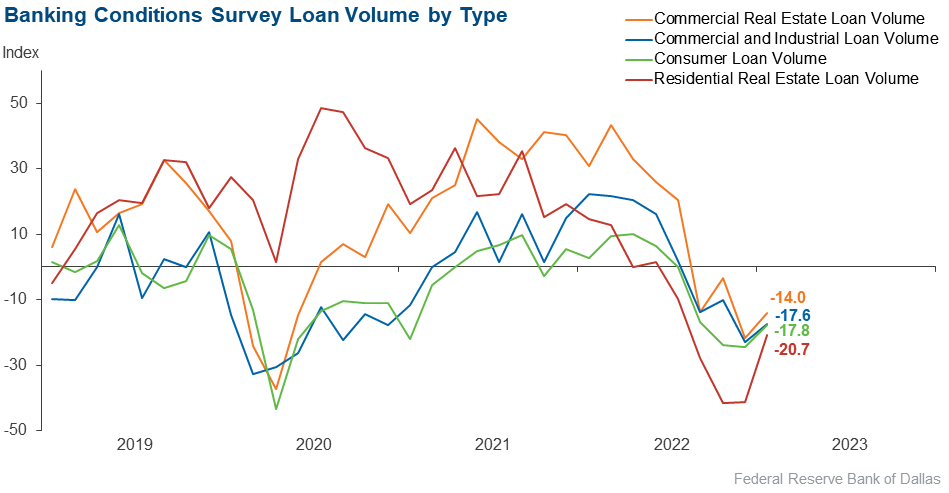
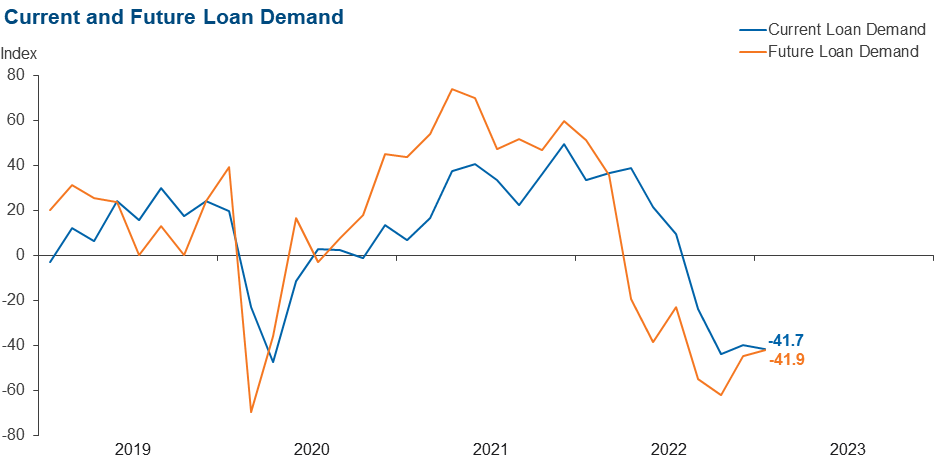
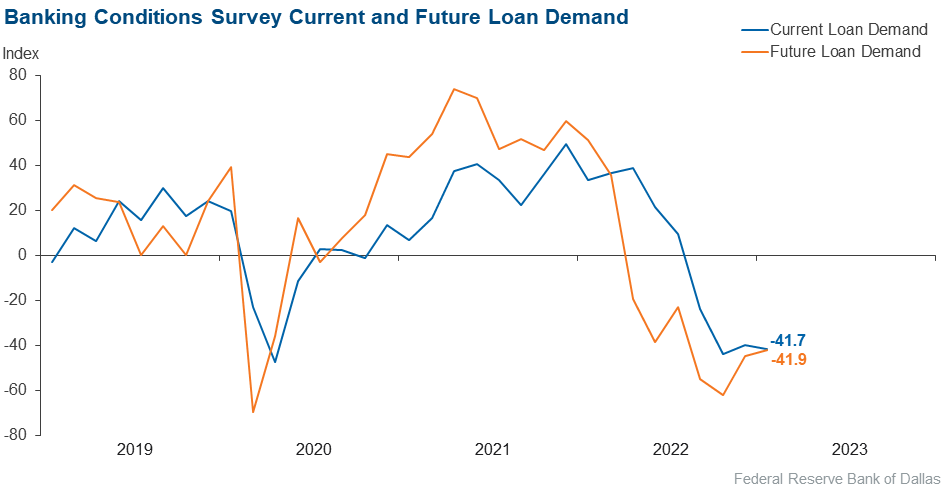
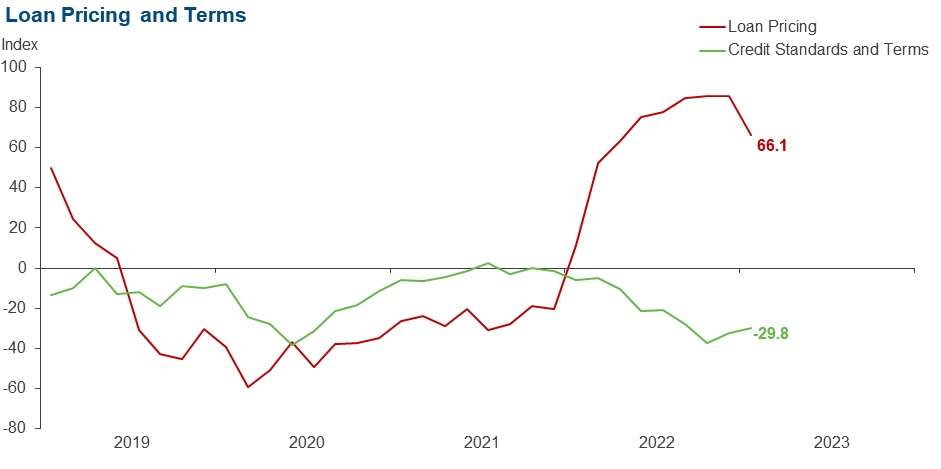
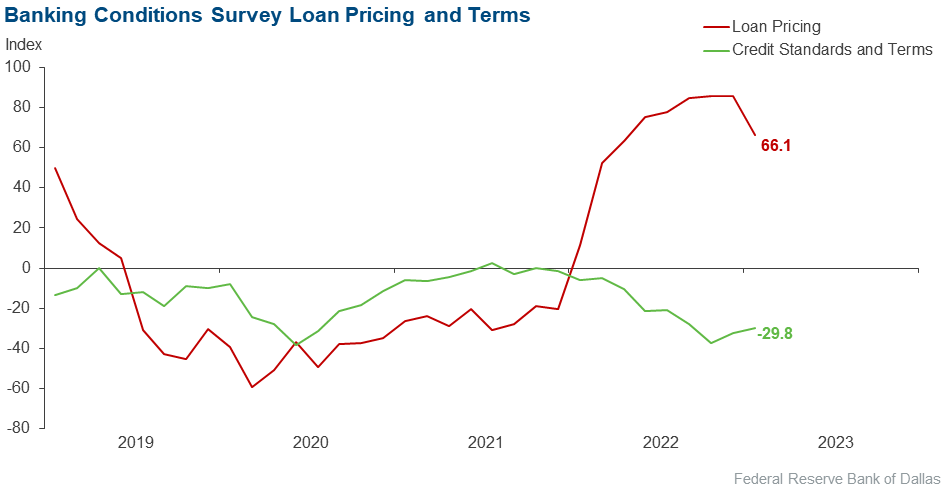
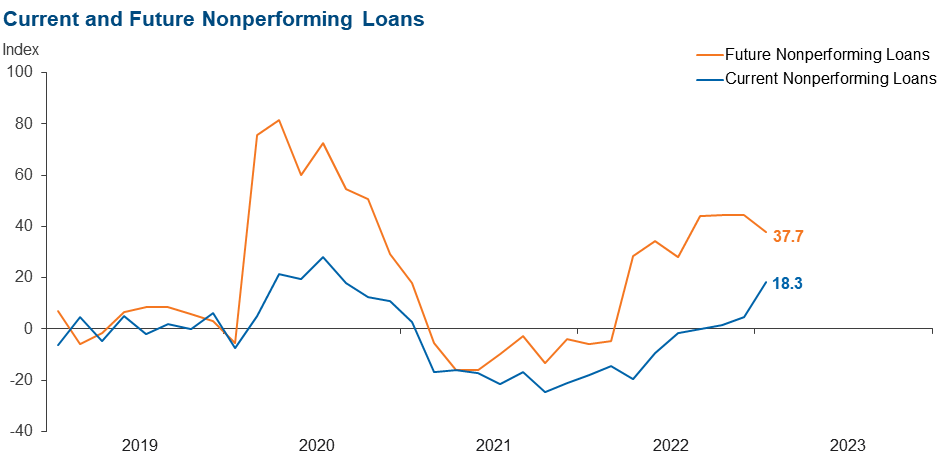
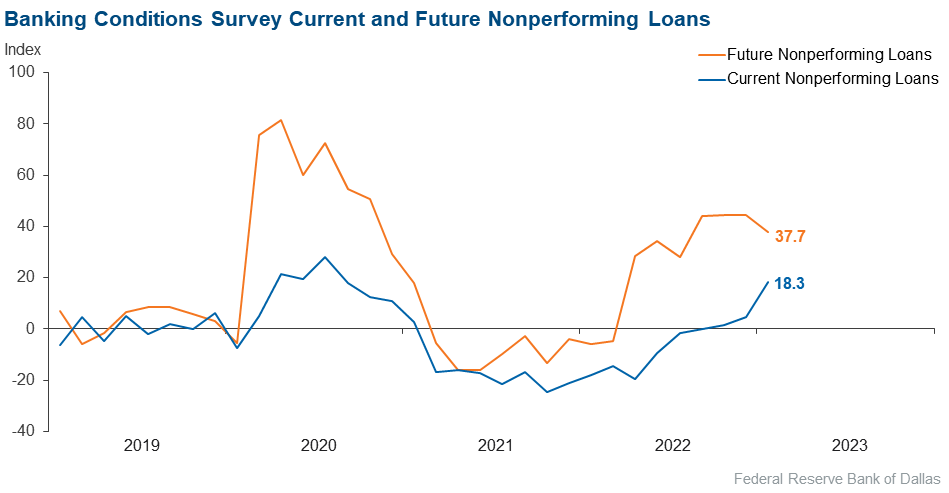
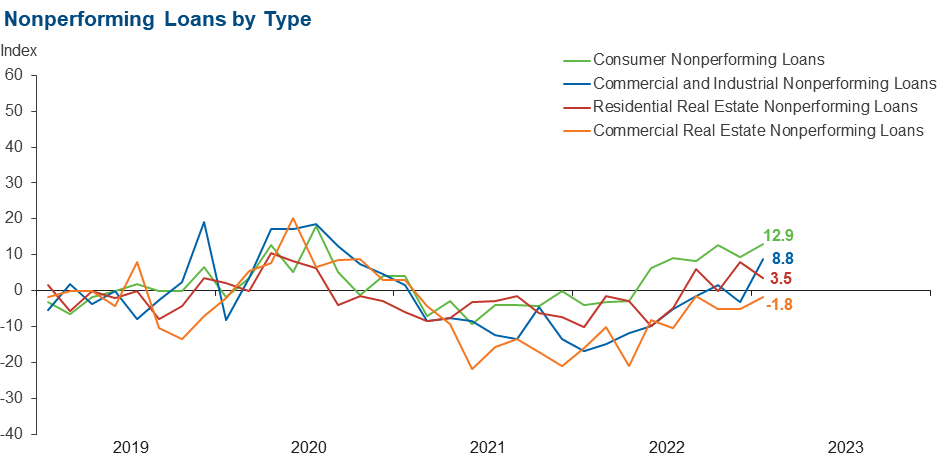
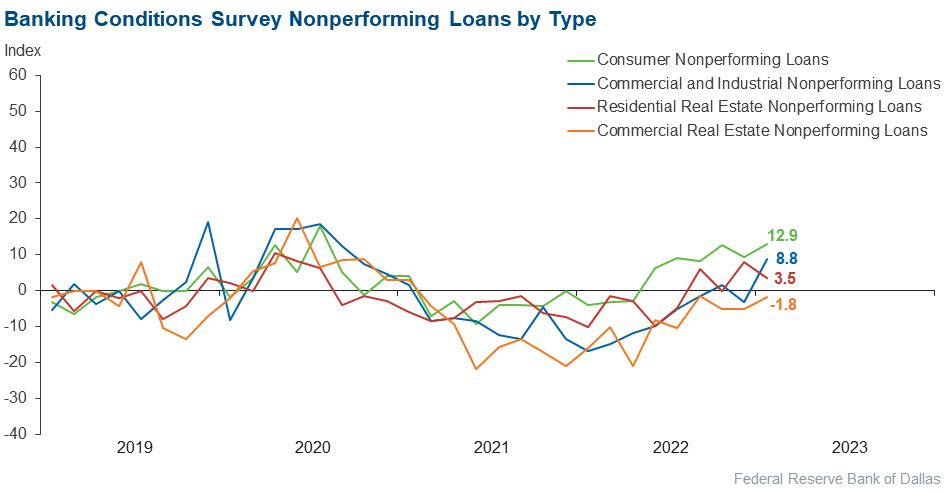
Loan demand declined for the fourth period in a row, with more than half of bankers reporting a decrease over the past six weeks. Loan volumes stabilized overall. While continued weakness was seen in the various lending types, the indexes were less negative than they were in the prior reporting period. Loan nonperformance increased notably, particularly for consumer loans. Loan price growth moderated somewhat but remained highly elevated, and credit standards and terms continued to tighten. Business activity declined significantly, and expectations for the next six months are for loan demand and business activity to fall further and loan nonperformance to increase. Contacts cited rising interest rates and inflation as headwinds and expressed concern over deposit outflows.
Next release: April 3, 2023
Data were collected February 7–15, and 62 financial institutions responded to the survey. The Federal Reserve Bank of Dallas conducts the Banking Conditions Survey twice each quarter to obtain a timely assessment of activity at banks and credit unions headquartered in the Eleventh Federal Reserve District. CEOs or senior loan officers of financial institutions report on how conditions have changed for indicators such as loan volume, nonperforming loans and loan pricing. Respondents are also asked to report on their banking outlook and their evaluation of general business activity.
Survey responses are used to calculate an index for each indicator. Each index is calculated by subtracting the percentage of respondents reporting a decrease (or tightening) from the percentage reporting an increase (or easing). When the share of respondents reporting an increase exceeds the share reporting a decrease, the index will be greater than zero, suggesting the indicator has increased over the prior reporting period. If the share of respondents reporting a decrease exceeds the share reporting an increase, the index will be below zero, suggesting the indicator has decreased over the prior reporting period. An index will be zero when the number of respondents reporting an increase is equal to the number reporting a decrease.
Results Summary
Historical data are available from March 2017.
| Total Loans: Over the past six weeks, how have the following changed? | |||||
| Indicator | Current Index | Previous Index | % Reporting Increase | % Reporting No Change | % Reporting Decrease |
Loan volume | 4.8 | –10.7 | 38.7 | 27.4 | 33.9 |
Loan demand | –41.7 | –40.0 | 15.0 | 28.3 | 56.7 |
Nonperforming loans | 18.3 | 4.6 | 28.3 | 61.7 | 10.0 |
Loan pricing | 66.1 | 85.9 | 69.5 | 27.1 | 3.4 |
| Indicator | Current Index | Previous Index | % Reporting Eased | % Reporting No Change | % Reporting Tightened |
Credit standards and terms | –29.8 | –32.3 | 0.0 | 70.2 | 29.8 |
| Commercial and Industrial Loans: Over the past six weeks, how have the following changed? | |||||
| Indicator | Current Index | Previous Index | % Reporting Increase | % Reporting No Change | % Reporting Decrease |
Loan volume | –17.6 | –22.9 | 14.0 | 54.4 | 31.6 |
Nonperforming loans | 8.8 | –3.3 | 12.3 | 84.2 | 3.5 |
| Indicator | Current Index | Previous Index | % Reporting Eased | % Reporting No Change | % Reporting Tightened |
Credit standards and terms | –23.2 | –19.7 | 0.0 | 76.8 | 23.2 |
| Commercial Real Estate Loans: Over the past six weeks, how have the following changed? | |||||
| Indicator | Current Index | Previous Index | % Reporting Increase | % Reporting No Change | % Reporting Decrease |
Loan volume | –14.0 | –21.6 | 24.6 | 36.8 | 38.6 |
Nonperforming loans | –1.8 | –5.0 | 3.6 | 91.1 | 5.4 |
| Indicator | Current Index | Previous Index | % Reporting Eased | % Reporting No Change | % Reporting Tightened |
Credit standards and terms | –26.8 | –26.7 | 0.0 | 73.2 | 26.8 |
| Residential Real Estate Loans: Over the past six weeks, how have the following changed? | |||||
| Indicator | Current Index | Previous Index | % Reporting Increase | % Reporting No Change | % Reporting Decrease |
Loan volume | –20.7 | –41.3 | 24.1 | 31.0 | 44.8 |
Nonperforming loans | 3.5 | 7.9 | 7.0 | 89.5 | 3.5 |
| Indicator | Current Index | Previous Index | % Reporting Eased | % Reporting No Change | % Reporting Tightened |
Credit standards and terms | –6.9 | –11.3 | 1.7 | 89.7 | 8.6 |
| Consumer Loans: Over the past six weeks, how have the following changed? | |||||
| Indicator | Current Index | Previous Index | % Reporting Increase | % Reporting No Change | % Reporting Decrease |
Loan volume | –17.8 | –24.6 | 17.7 | 46.8 | 35.5 |
Nonperforming loans | 12.9 | 9.4 | 17.7 | 77.4 | 4.8 |
| Indicator | Current Index | Previous Index | % Reporting Eased | % Reporting No Change | % Reporting Tightened |
Credit standards and terms | –12.9 | –12.7 | 0.0 | 87.1 | 12.9 |
| Banking Outlook: What is your expectation for the following items six months from now? | |||||
| Indicator | Current Index | Previous Index | % Reporting Increase | % Reporting No Change | % Reporting Decrease |
Total loan demand | –41.9 | –44.6 | 21.0 | 16.1 | 62.9 |
Nonperforming loans | 37.7 | 44.6 | 45.9 | 45.9 | 8.2 |
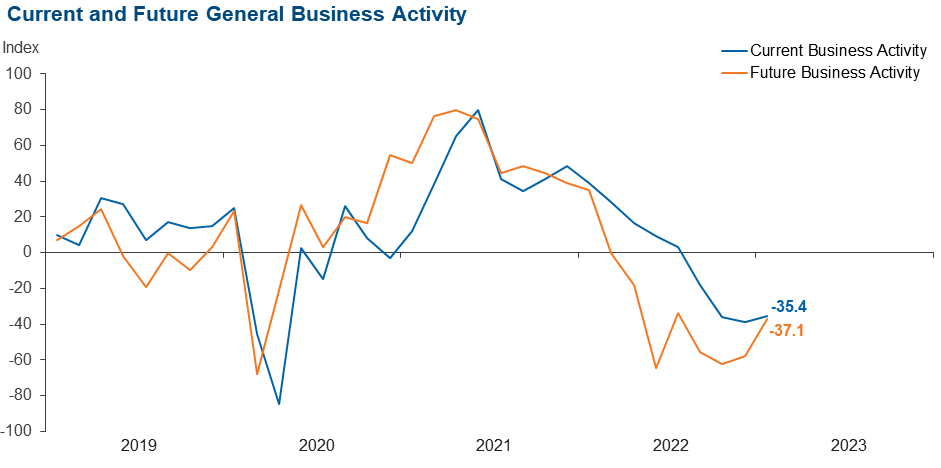
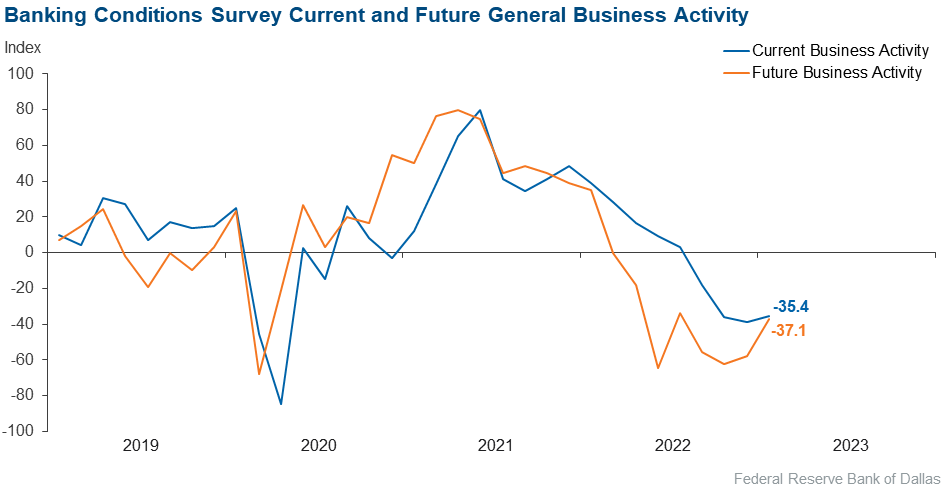
| General Business Activity: What is your evaluation of the level of activity? | |||||
| Indicator | Current Index | Previous Index | % Reporting Better | % Reporting No Change | % Reporting Worse |
Over the past six weeks | –35.4 | –38.5 | 8.1 | 48.4 | 43.5 |
Six months from now | –37.1 | –57.9 | 16.1 | 30.6 | 53.2 |
Comments from Survey Respondents
Respondents were given an opportunity to comment on any issues that may be affecting their business.
These comments are from respondents’ completed surveys and have been edited for publication.
- Major markets in Texas appear to be resilient enough to weather higher interest rates and a global slowdown.
- With core deposit outflows, it has become more expensive to fund lending activities. And the competition between banks and credit unions for consumer deposits is intense. We’re seeing CD offers up to 4.4 percent APY [annual percentage yield] for nine months.
- Federal Reserve rate hikes are an issue of concern.
- The impact of rising rates continues to affect both loan pricing and deposit flows. Modest outflows of deposits, combined with a rapid decrease in demand for conventional mortgage products, have created two areas of concern we continue to closely monitor. Consumer credit risk has moved upward of late, albeit not above the historic norm. These trends, combined with increasing regulatory activity, create an interesting environment of late.
- Liquidity is our No. 1 concern—also asset and liability management between deposit and loan rates.
- Higher interest rates have changed the process of the business community and have really slowed down the purchase of goods and services.
- Inflation is the main concern. Rising prices are forcing depositors to spend what is left of their savings balances that came from government stimulus deposits.
Historical Data
Historical data can be downloaded dating back to March 2017. For the definitions, see data definitions.
NOTE: The following series were discontinued in May 2020: volume of core deposits, cost of funds, non-interest income and net interest margin.
Questions regarding the Banking Conditions Survey can be addressed to Emily Kerr at emily.kerr@dal.frb.org.
Sign up for our email alert to be automatically notified as soon as the latest Banking Conditions Survey is released on the web.