Banking Conditions Survey

For this month’s survey, Eleventh District banking executives were asked supplemental questions about their outlook, deposits, and commercial real estate lending. Read the special questions results.
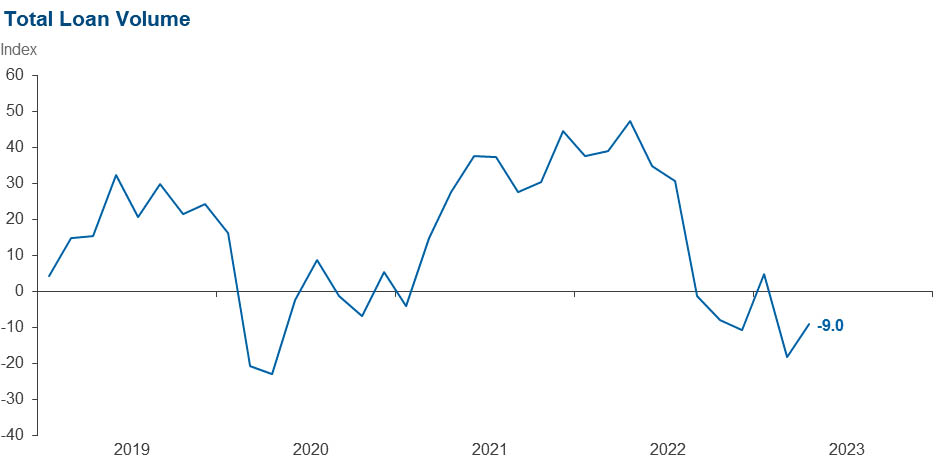
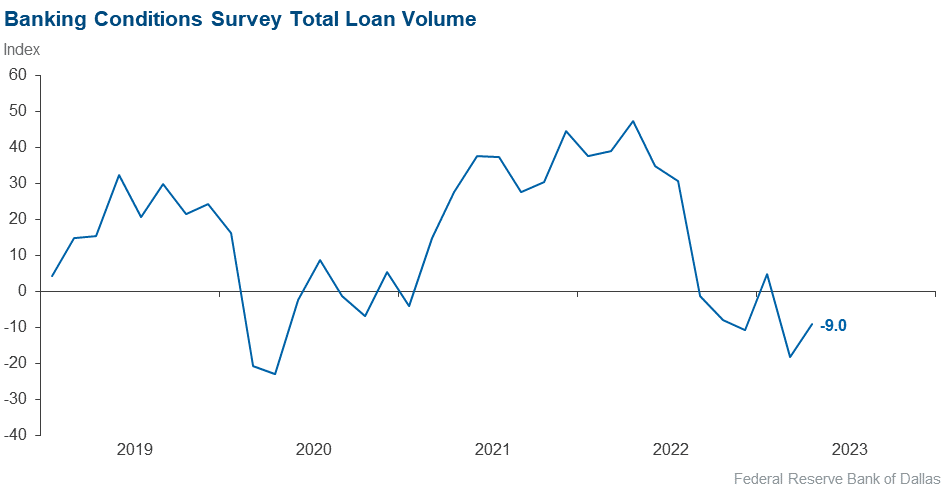
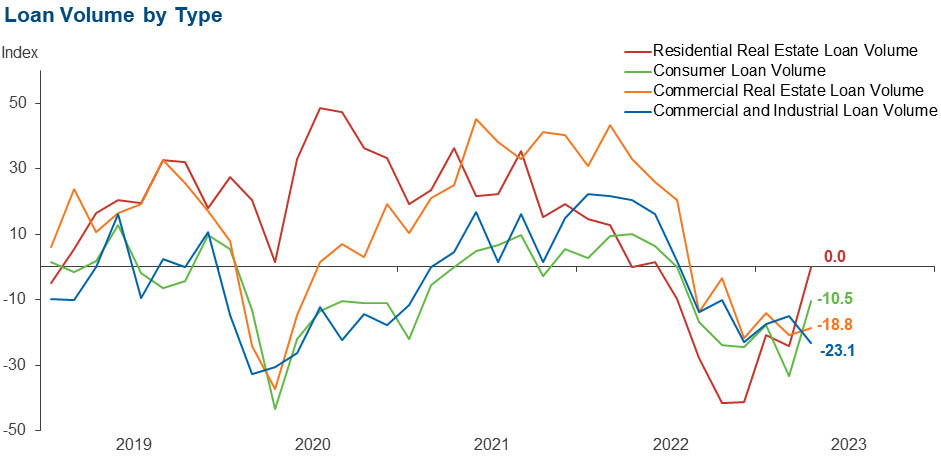
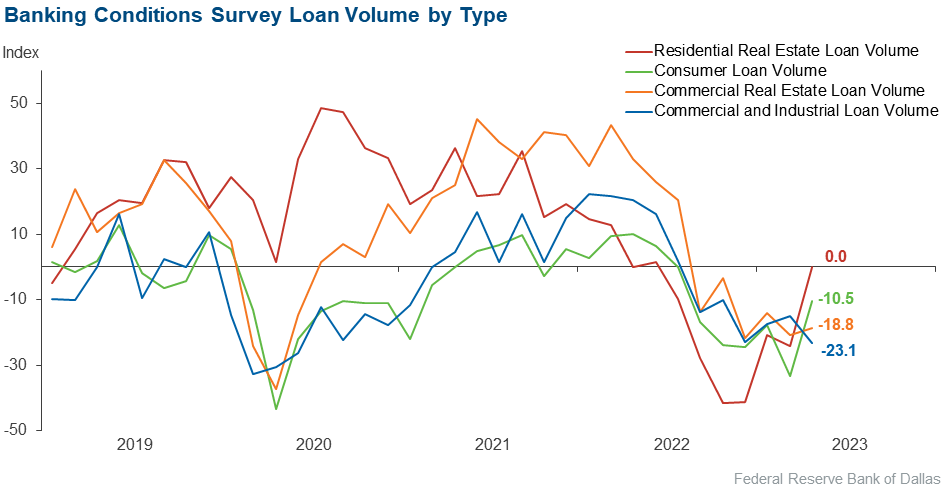
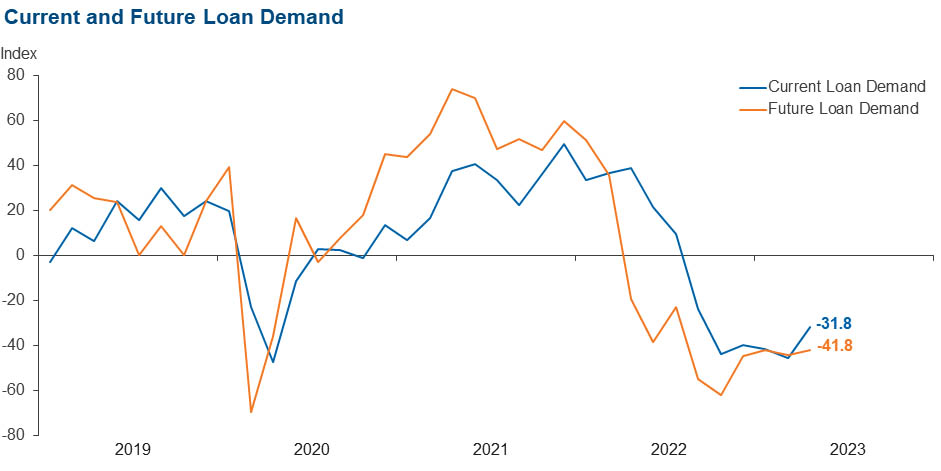
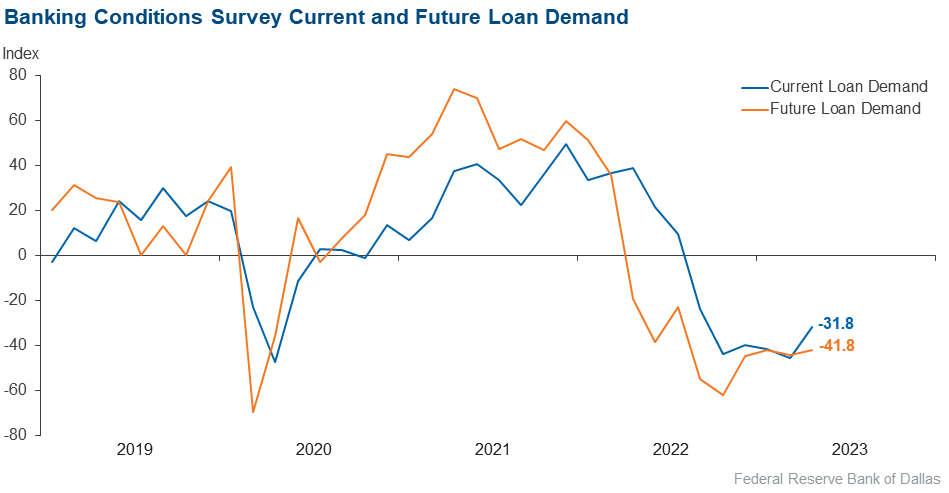
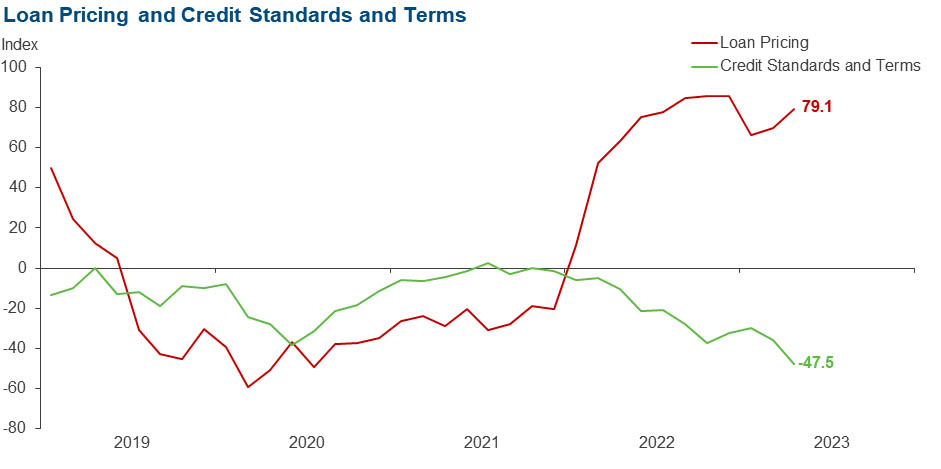
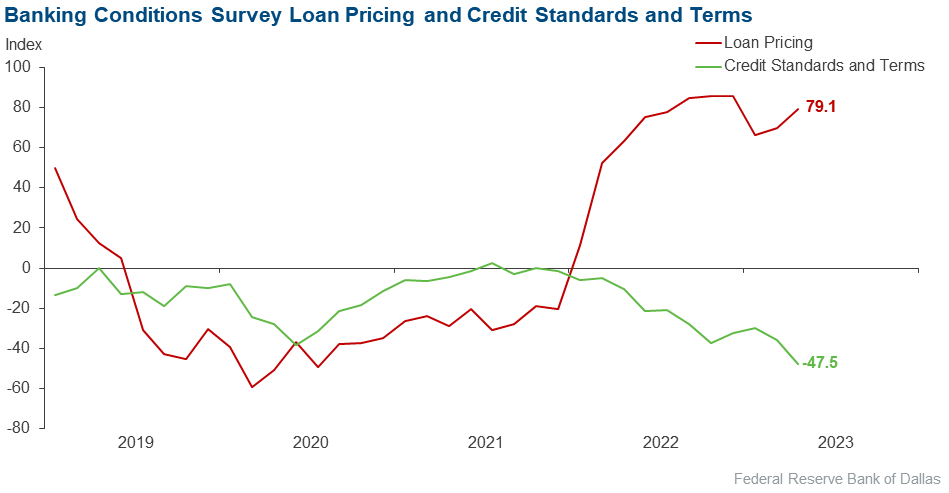
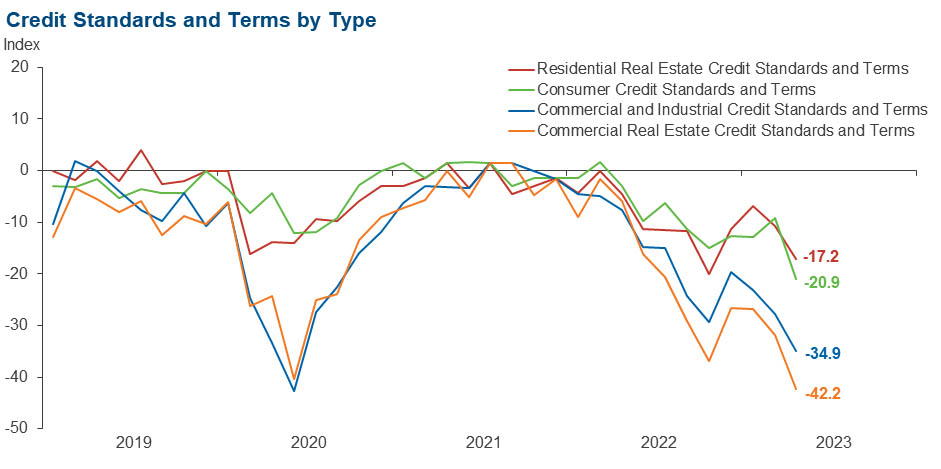
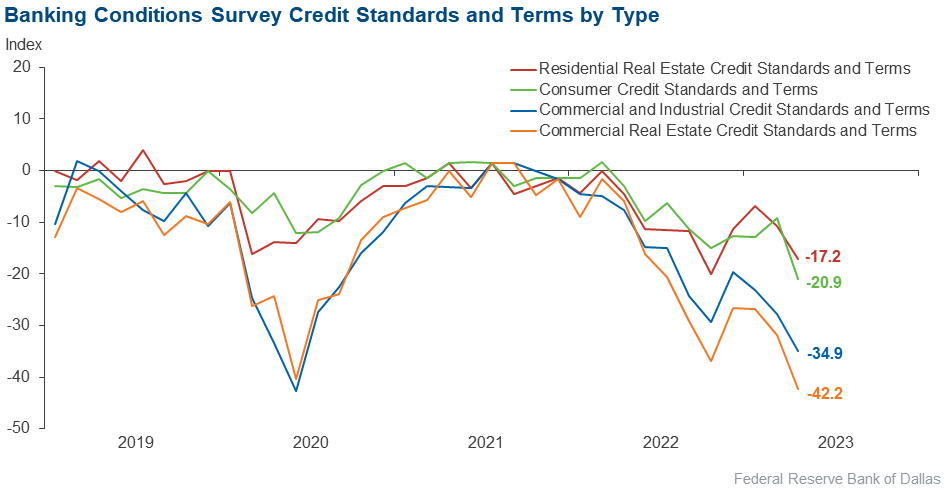
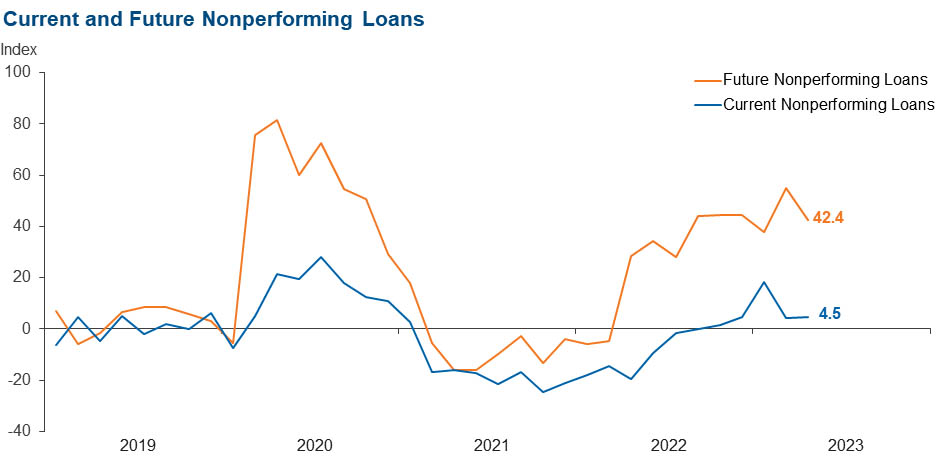
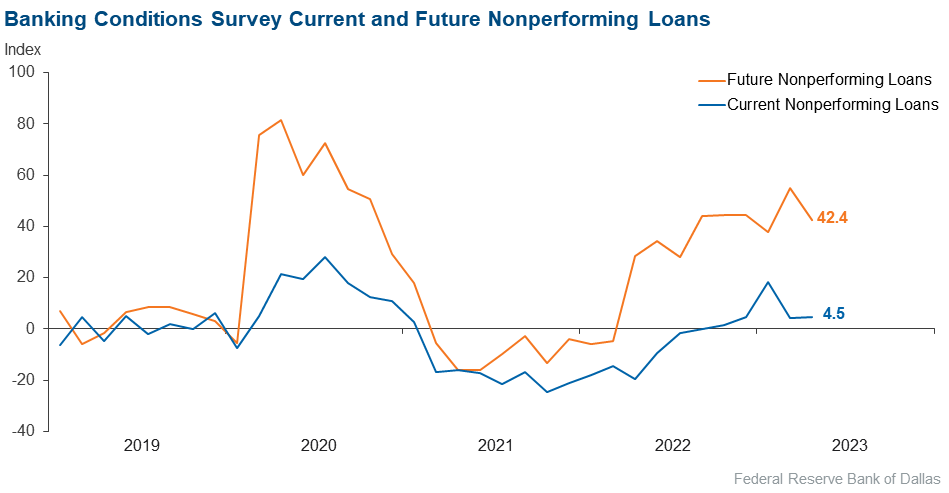
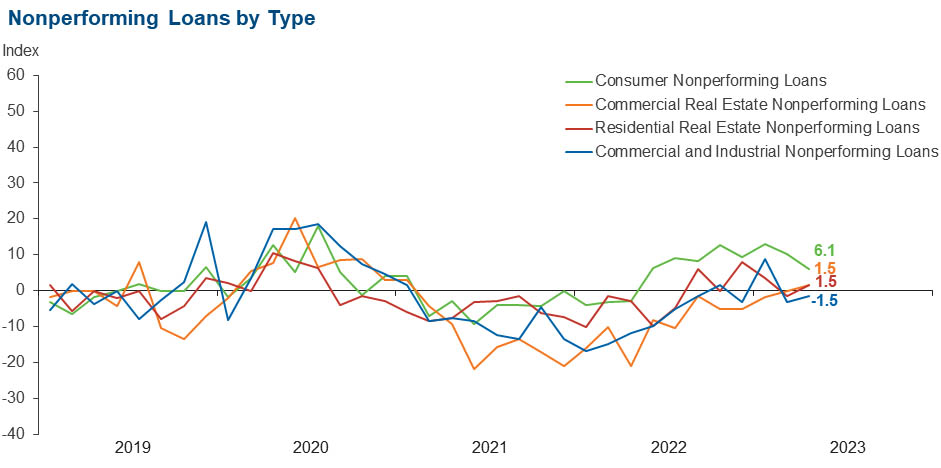
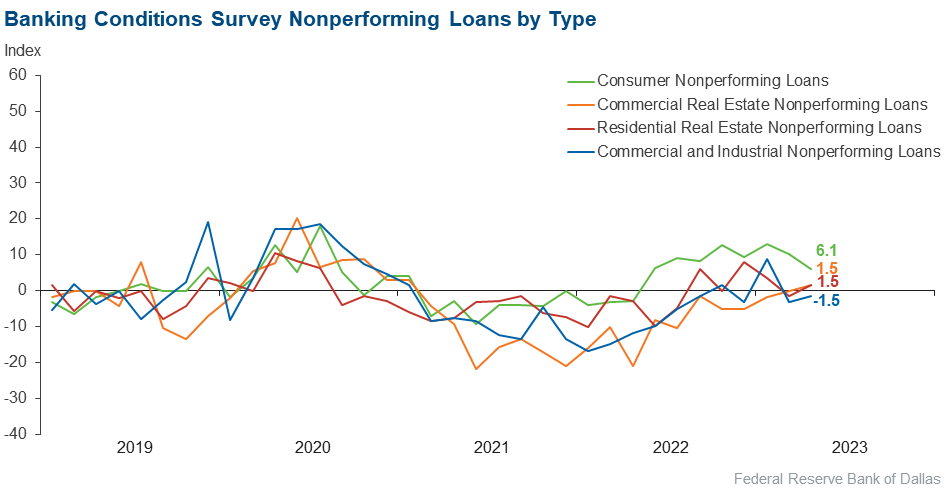
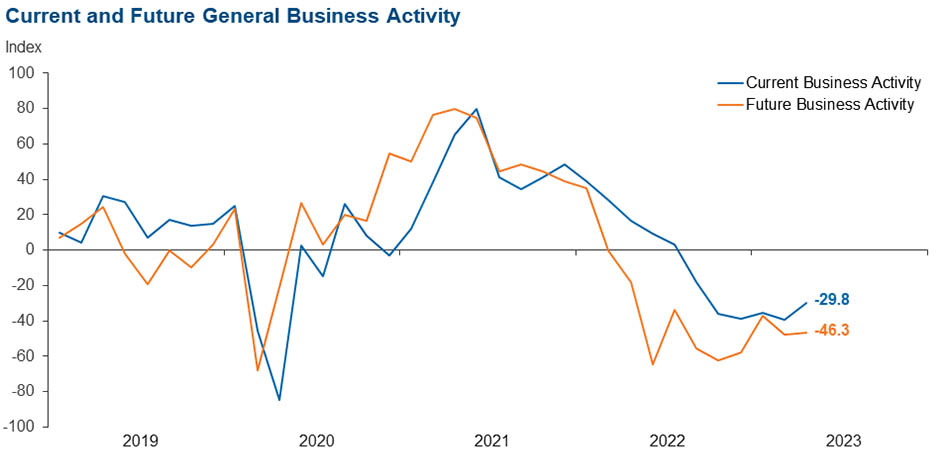
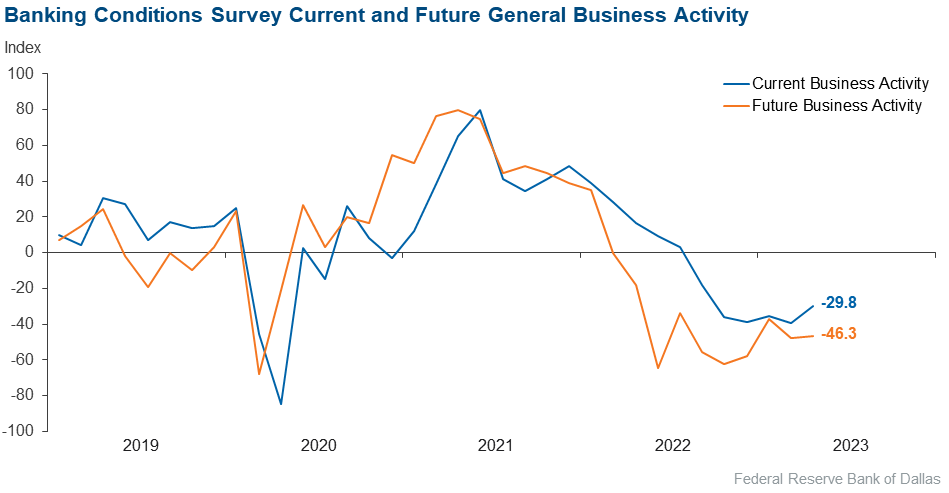
Loan demand declined for the sixth period in a row amid further loan pricing increases and worsening general business activity. Overall loan volumes continued to decline as well, though at a decelerated pace. Residential real estate loan volumes stabilized after falling for several months, and consumer loan volume declines slowed notably. Significant volume declines continue to be seen in commercial and industrial and commercial real estate lending. Credit conditions tightened further; 48 percent of bankers said they tightened credit standards and terms over the past six weeks, the highest share since the survey began in 2017. Loan nonperformance continued to increase slightly. The banking outlook continues to deteriorate, with contacts expecting a further contraction in business activity and loan demand and an increase in nonperforming loans over the next six months.
Next release: June 26, 2023
Data were collected May 2–10, and 67 financial institutions responded to the survey. The Federal Reserve Bank of Dallas conducts the Banking Conditions Survey twice each quarter to obtain a timely assessment of activity at banks and credit unions headquartered in the Eleventh Federal Reserve District. CEOs or senior loan officers of financial institutions report on how conditions have changed for indicators such as loan volume, nonperforming loans and loan pricing. Respondents are also asked to report on their banking outlook and their evaluation of general business activity.
Survey responses are used to calculate an index for each indicator. Each index is calculated by subtracting the percentage of respondents reporting a decrease (or tightening) from the percentage reporting an increase (or easing). When the share of respondents reporting an increase exceeds the share reporting a decrease, the index will be greater than zero, suggesting the indicator has increased over the prior reporting period. If the share of respondents reporting a decrease exceeds the share reporting an increase, the index will be below zero, suggesting the indicator has decreased over the prior reporting period. An index will be zero when the number of respondents reporting an increase is equal to the number reporting a decrease.
Results Summary
Historical data are available from March 2017.
| Total Loans: Over the past six weeks, how have the following changed? | |||||
| Indicator | Current Index | Previous Index | % Reporting Increase | % Reporting No Change | % Reporting Decrease |
Loan volume | –9.0 | –18.3 | 32.8 | 25.4 | 41.8 |
Loan demand | –31.8 | –45.6 | 25.8 | 16.7 | 57.6 |
Nonperforming loans | 4.5 | 4.3 | 13.6 | 77.3 | 9.1 |
Loan pricing | 79.1 | 69.6 | 79.1 | 20.9 | 0.0 |
| Indicator | Current Index | Previous Index | % Reporting Eased | % Reporting No Change | % Reporting Tightened |
Credit standards and terms | –47.5 | –35.9 | 0.0 | 52.5 | 47.5 |
| Commercial and Industrial Loans: Over the past six weeks, how have the following changed? | |||||
| Indicator | Current Index | Previous Index | % Reporting Increase | % Reporting No Change | % Reporting Decrease |
Loan volume | –23.1 | –14.9 | 12.3 | 52.3 | 35.4 |
Nonperforming loans | –1.5 | –3.1 | 6.2 | 86.2 | 7.7 |
| Indicator | Current Index | Previous Index | % Reporting Eased | % Reporting No Change | % Reporting Tightened |
Credit standards and terms | –34.9 | –27.7 | 0.0 | 65.1 | 34.9 |
| Commercial Real Estate Loans: Over the past six weeks, how have the following changed? | |||||
| Indicator | Current Index | Previous Index | % Reporting Increase | % Reporting No Change | % Reporting Decrease |
Loan volume | –18.8 | –20.9 | 20.3 | 40.6 | 39.1 |
Nonperforming loans | 1.5 | 0.0 | 6.3 | 88.9 | 4.8 |
| Indicator | Current Index | Previous Index | % Reporting Eased | % Reporting No Change | % Reporting Tightened |
Credit standards and terms | –42.2 | –31.8 | 0.0 | 57.8 | 42.2 |
| Residential Real Estate Loans: Over the past six weeks, how have the following changed? | |||||
| Indicator | Current Index | Previous Index | % Reporting Increase | % Reporting No Change | % Reporting Decrease |
Loan volume | 0.0 | –24.3 | 29.7 | 40.6 | 29.7 |
Nonperforming loans | 1.5 | –1.6 | 6.3 | 88.9 | 4.8 |
| Indicator | Current Index | Previous Index | % Reporting Eased | % Reporting No Change | % Reporting Tightened |
Credit standards and terms | –17.2 | –10.8 | 0.0 | 82.8 | 17.2 |
| Consumer Loans: Over the past six weeks, how have the following changed? | |||||
| Indicator | Current Index | Previous Index | % Reporting Increase | % Reporting No Change | % Reporting Decrease |
Loan volume | –10.5 | –33.4 | 16.4 | 56.7 | 26.9 |
Nonperforming loans | 6.1 | 10.3 | 10.6 | 84.8 | 4.5 |
| Indicator | Current Index | Previous Index | % Reporting Eased | % Reporting No Change | % Reporting Tightened |
Credit standards and terms | –20.9 | –9.1 | 0.0 | 79.1 | 20.9 |
| Banking Outlook: What is your expectation for the following items six months from now? | |||||
| Indicator | Current Index | Previous Index | % Reporting Increase | % Reporting No Change | % Reporting Decrease |
Total loan demand | –41.8 | –44.3 | 17.9 | 22.4 | 59.7 |
Nonperforming loans | 42.4 | 55.1 | 50.0 | 42.4 | 7.6 |
| General Business Activity: What is your evaluation of the level of activity? | |||||
| Indicator | Current Index | Previous Index | % Reporting Better | % Reporting No Change | % Reporting Worse |
Over the past six weeks | –29.8 | –39.5 | 6.0 | 58.2 | 35.8 |
Six months from now | –46.3 | –47.9 | 13.4 | 26.9 | 59.7 |
Respondents were given an opportunity to comment on any issues that may be affecting their business.
These comments are from respondents’ completed surveys and have been edited for publication.
- There is no question bank lending and credit standards have tightened. We are probably in the early stages of a mild recession in Texas.
- Lack of liquidity is reducing the availability of credit.
- One concern is the future repayment ability of borrowers who have repriced loans at higher rates. A second concern is real estate values.
- We keep waiting to see what effect increased interest rates might have on the business climate, but things continue to improve. Demand remains strong, and goods are still in shortage.
- Areas of concern include the continued impacts of high interest rates and inflation. These trends are impacting the cost of funds (and resulting deposit and liquidity trends), IRR [interest rate risk] stress testing metrics along with cost of living and affordability of credit for our members. There are a number of areas where uncertainty continues to increase with the addition of regional bank concerns and government debt limits added to the list enumerated above, with both formal regulatory burden and informal regulatory burden also increasing. All of these are collectively driving significant uncertainty in forecasting over the next two quarters.
- [Issues of concern include] higher interest rates, inflation, rising delinquencies, shrinking interest margins and declines in ROA [return on assets] due to a rising need to increase contributions to the allowance for loan loss account.
- The implementation of Section 1071 of Dodd Frank [is an issue of concern].
- Overregulation [is an issue of concern].
Historical data can be downloaded dating back to March 2017. For the definitions, see data definitions.
NOTE: The following series were discontinued in May 2020: volume of core deposits, cost of funds, non-interest income and net interest margin.
Questions regarding the Banking Conditions Survey can be addressed to Emily Kerr at emily.kerr@dal.frb.org.
Sign up for our email alert to be automatically notified as soon as the latest Banking Conditions Survey is released on the web.