Banking Conditions Survey

For this survey, Eleventh District banking executives were asked supplemental questions on credit standards, loan demand, deposits and trade policy impact. Read the special questions results.
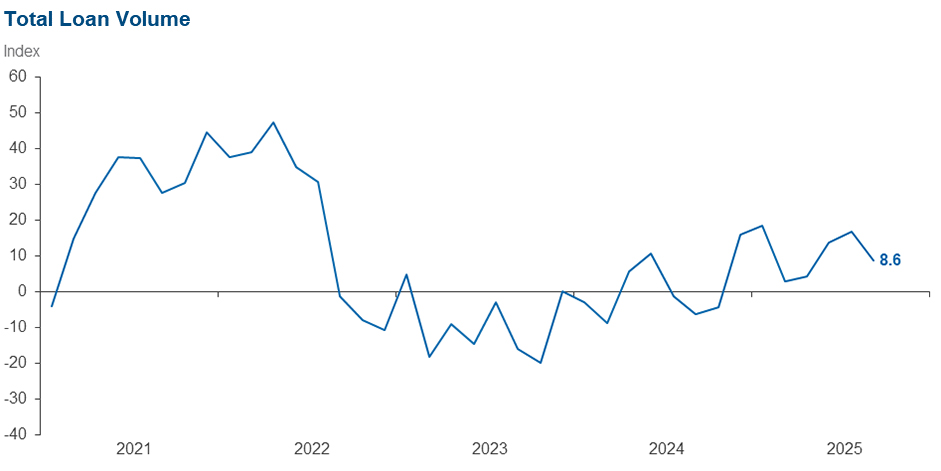
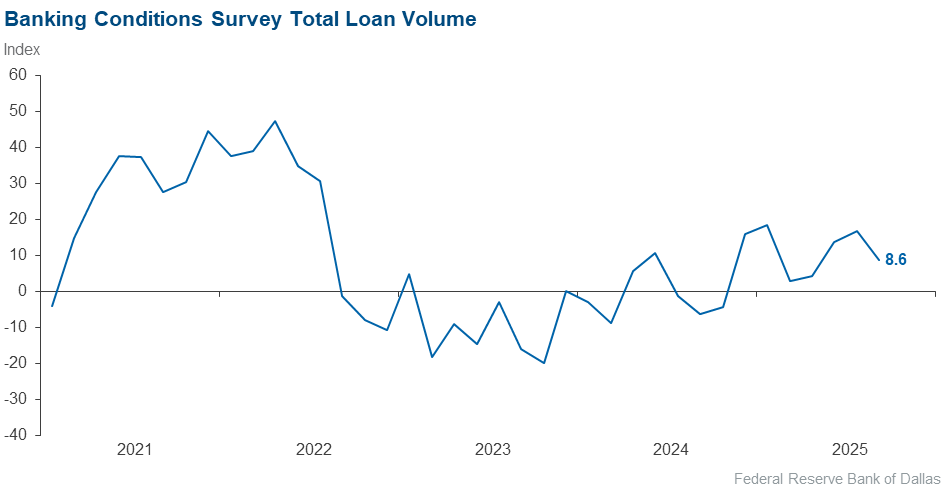
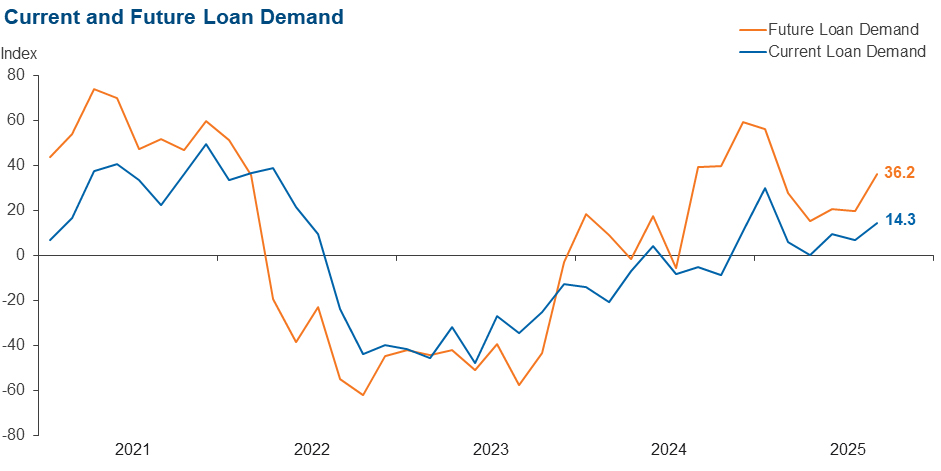
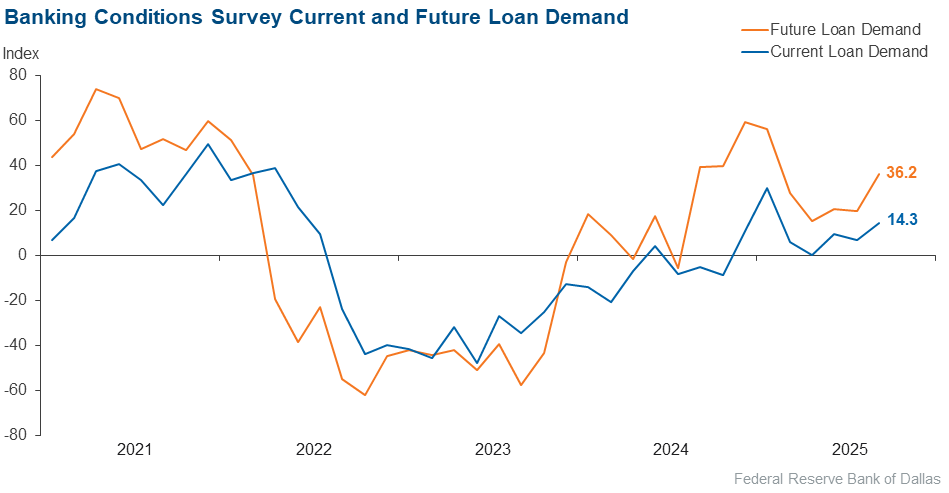
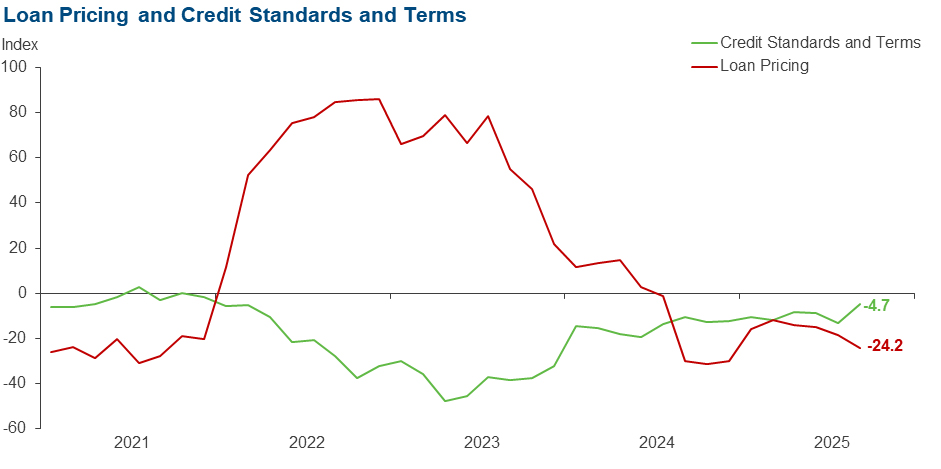
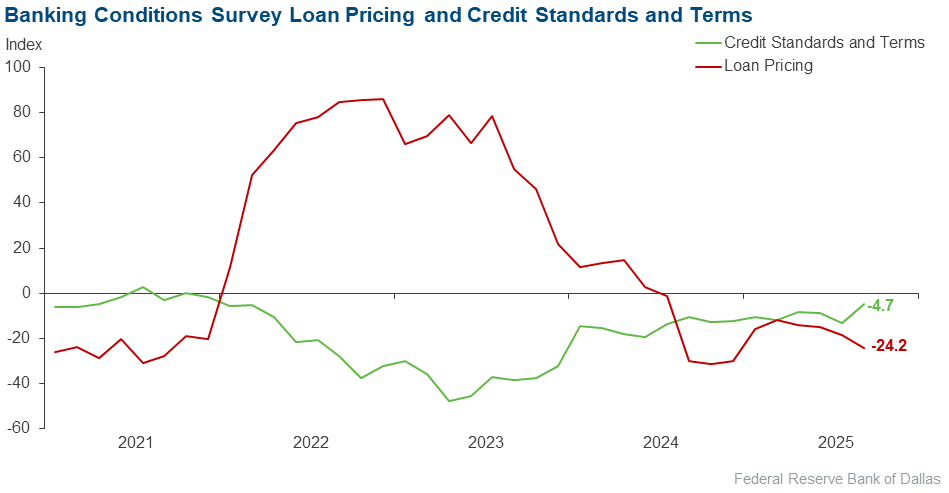
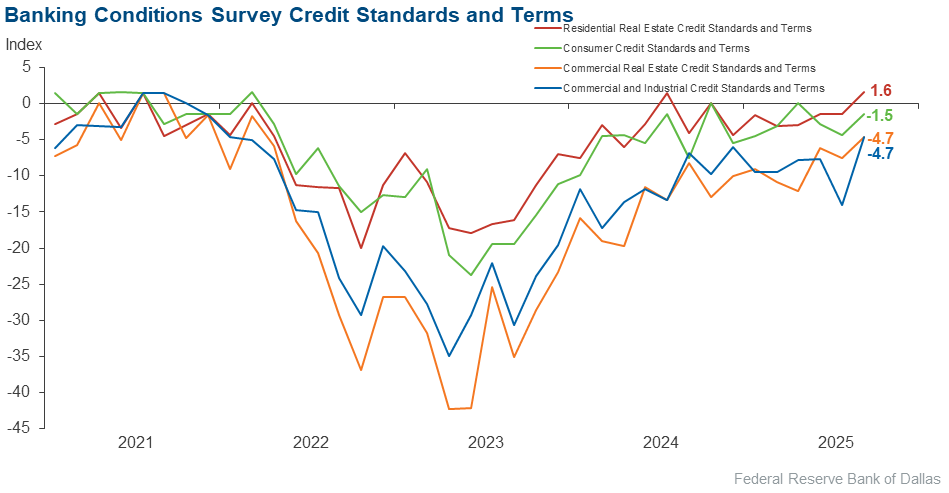
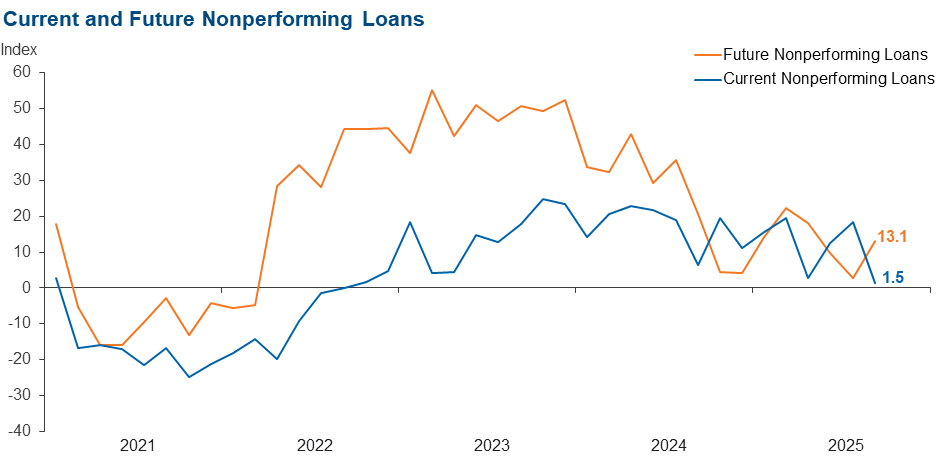
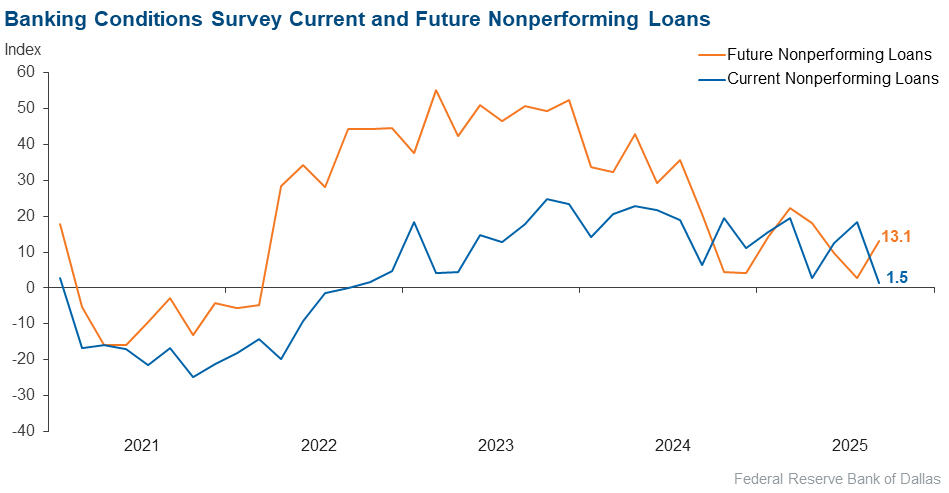
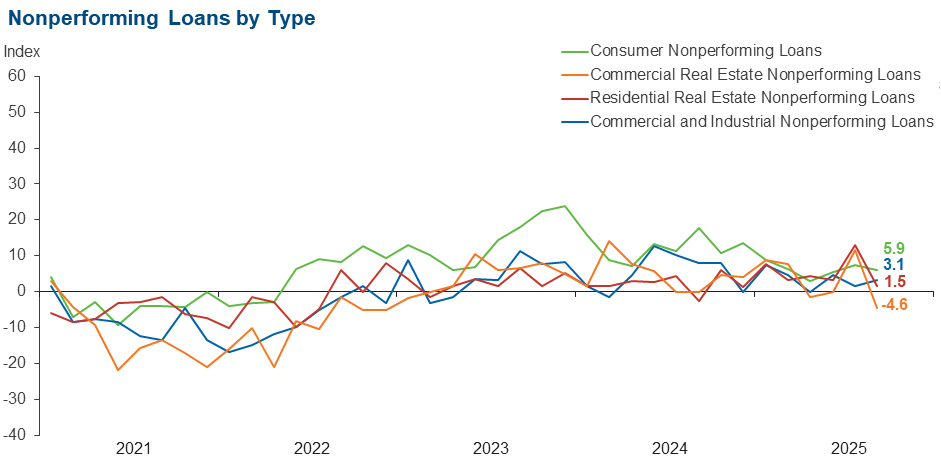
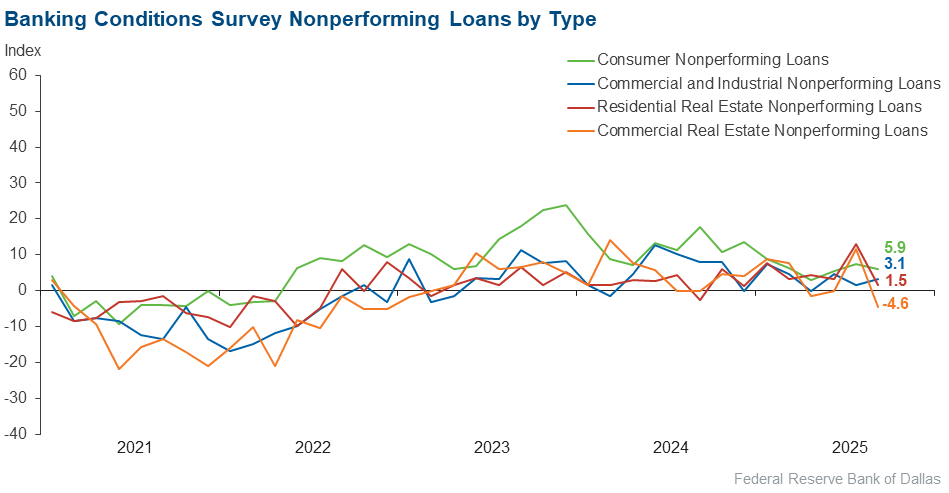
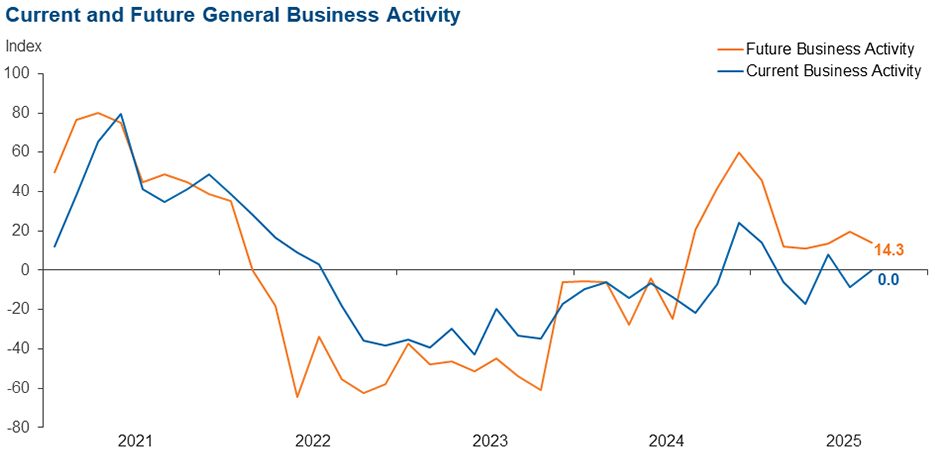
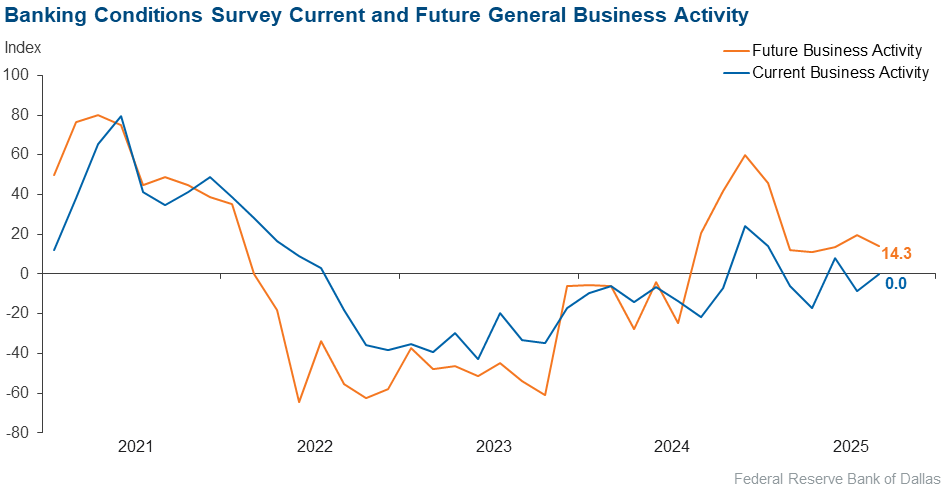
Loan volume and demand increased in September. Credit tightening continued, but loan pricing declined. Credit standards and terms eased for residential real estate while tightening continued for the remaining loan types. Overall loan performance deteriorated slightly; however, loan performance for commercial real estate sharply improved. Bankers reported stable general business activity. Bankers’ outlooks are mixed. Survey respondents expect an acceleration in loan demand and increasing business activity six months from now but a moderate deterioration in loan performance.
Next release: November 10, 2025
Data were collected September 16–24, and 70 financial institutions responded to the survey. The Federal Reserve Bank of Dallas conducts the Banking Conditions Survey twice each quarter to obtain a timely assessment of activity at banks and credit unions headquartered in the Eleventh Federal Reserve District. CEOs or senior loan officers of financial institutions report on how conditions have changed for indicators such as loan volume, nonperforming loans and loan pricing. Respondents are also asked to report on their banking outlook and their evaluation of general business activity.
Survey responses are used to calculate an index for each indicator. Each index is calculated by subtracting the percentage of respondents reporting a decrease (or tightening) from the percentage reporting an increase (or easing). When the share of respondents reporting an increase exceeds the share reporting a decrease, the index will be greater than zero, suggesting the indicator has increased over the prior reporting period. If the share of respondents reporting a decrease exceeds the share reporting an increase, the index will be below zero, suggesting the indicator has decreased over the prior reporting period. An index will be zero when the number of respondents reporting an increase is equal to the number reporting a decrease.
Results Summary
Historical data are available from March 2017.
| Total Loans: Over the past six weeks, how have the following changed? | |||||
| Indicator | Current Index | Previous Index | % Reporting Increase | % Reporting No Change | % Reporting Decrease |
Loan volume | 8.6 | 16.7 | 35.7 | 37.1 | 27.1 |
Loan demand | 14.3 | 6.9 | 38.6 | 37.1 | 24.3 |
Nonperforming loans | 1.5 | 18.3 | 12.9 | 75.7 | 11.4 |
Loan pricing | –24.2 | –18.3 | 2.9 | 70.0 | 27.1 |
| Indicator | Current Index | Previous Index | % Reporting Eased | % Reporting No Change | % Reporting Tightened |
Credit standards and terms | –4.7 | –13.0 | 1.6 | 92.1 | 6.3 |
| Commercial and Industrial Loans: Over the past six weeks, how have the following changed? | |||||
| Indicator | Current Index | Previous Index | % Reporting Increase | % Reporting No Change | % Reporting Decrease |
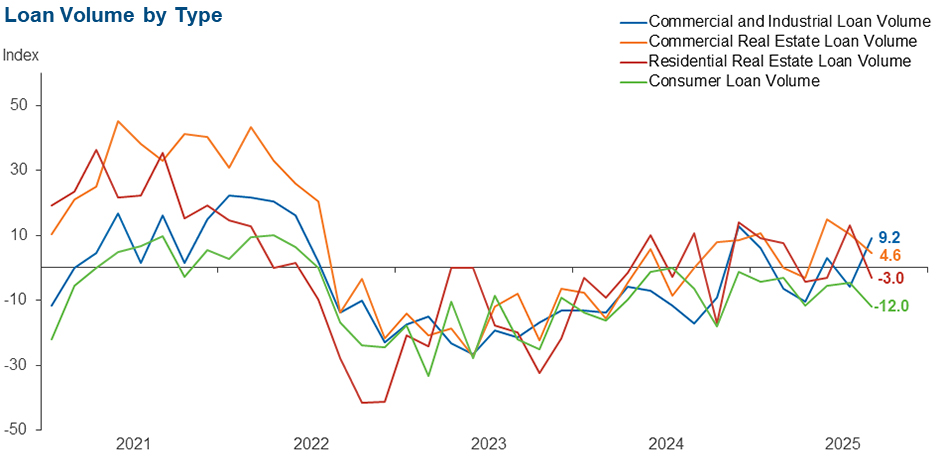
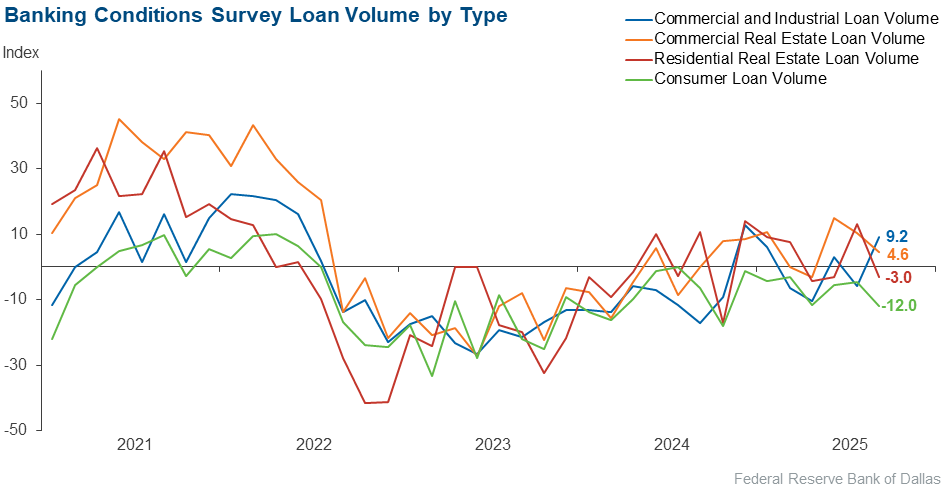
Loan volume | 9.2 | –5.9 | 24.6 | 60.0 | 15.4 |
Nonperforming loans | 3.1 | 1.5 | 10.8 | 81.5 | 7.7 |
| Indicator | Current Index | Previous Index | % Reporting Eased | % Reporting No Change | % Reporting Tightened |
Credit standards and terms | –4.7 | –14.1 | 0.0 | 95.3 | 4.7 |
| Commercial Real Estate Loans: Over the past six weeks, how have the following changed? | |||||
| Indicator | Current Index | Previous Index | % Reporting Increase | % Reporting No Change | % Reporting Decrease |
Loan volume | 4.6 | 10.3 | 29.2 | 46.2 | 24.6 |
Nonperforming loans | –4.6 | 11.7 | 6.2 | 83.1 | 10.8 |
| Indicator | Current Index | Previous Index | % Reporting Eased | % Reporting No Change | % Reporting Tightened |
Credit standards and terms | –4.7 | –7.5 | 1.6 | 92.2 | 6.3 |
| Residential Real Estate Loans: Over the past six weeks, how have the following changed? | |||||
| Indicator | Current Index | Previous Index | % Reporting Increase | % Reporting No Change | % Reporting Decrease |
Loan volume | –3.0 | 13.0 | 20.9 | 55.2 | 23.9 |
Nonperforming loans | 1.5 | 13.1 | 7.5 | 86.6 | 6.0 |
| Indicator | Current Index | Previous Index | % Reporting Eased | % Reporting No Change | % Reporting Tightened |
Credit standards and terms | 1.6 | –1.5 | 1.6 | 98.4 | 0.0 |
| Consumer Loans: Over the past six weeks, how have the following changed? | |||||
| Indicator | Current Index | Previous Index | % Reporting Increase | % Reporting No Change | % Reporting Decrease |
Loan volume | –12.0 | –4.5 | 13.4 | 61.2 | 25.4 |
Nonperforming loans | 5.9 | 7.3 | 13.4 | 79.1 | 7.5 |
| Indicator | Current Index | Previous Index | % Reporting Eased | % Reporting No Change | % Reporting Tightened |
Credit standards and terms | –1.5 | –4.4 | 1.5 | 95.5 | 3.0 |
| Banking Outlook: What is your expectation for the following items six months from now? | |||||
| Indicator | Current Index | Previous Index | % Reporting Increase | % Reporting No Change | % Reporting Decrease |
Total loan demand | 36.2 | 19.7 | 53.6 | 29.0 | 17.4 |
Nonperforming loans | 13.1 | 2.9 | 23.2 | 66.7 | 10.1 |
| General Business Activity: What is your evaluation of the level of activity? | |||||
| Indicator | Current Index | Previous Index | % Reporting Better | % Reporting No Change | % Reporting Worse |
Over the past six weeks | 0.0 | –8.4 | 22.9 | 54.3 | 22.9 |
Six months from now | 14.3 | 19.5 | 38.6 | 37.1 | 24.3 |

Survey participants are given the opportunity to submit comments on current issues that may be affecting their businesses. Some comments have been edited for grammar and clarity.
- Lack of oversight with credit unions creates unfair competition. Because credit unions have broadened their membership base largely over the previous 40 years, they’ve gone from the individual member to limited liability companies and are therefore financing business related products.
- South Texas is in a severe drought, and any and all new industrial development is on hold. Beyond the water situation, our politics and leadership are showing signs of weakness that I believe are contributing to our lethargic growth.
- Outlook continues to be uncertain as we monitor the likelihood of lower short-term rates and future estimates for unemployment and inflation. Borrowers of more modest means are in many cases under financial pressure, while more affluent members seek the benefits of lower rates.
- Inflation isn’t defeated. Unemployment is at historically low rates. I’d prefer the Federal Reserve focus on defeating inflation and not add risk to higher inflation by lowering rates.
- The continued interference by the president in the Federal Reserve’s interest rate decisions is doing more harm than good. Specifically, he is creating uncertainty in what should be a stable environment. Plus, the continued uncertainty of his tariff plans creates more chaos.
- We still have loans that are repricing up. This could have an effect on the cash flow analysis on some of our commercial real estate loans. At the same time, rate decreases will create more demand for loans in the next six months. We will continue to tighten our underwriting standards and try to hold rates where they are.
- The uncertainty of the economy seems to be affecting loan demand.
- The FOMC action in lowering interest rates has definitely created more inquiries about loan interest rates for all types of loans.
Historical data can be downloaded dating back to March 2017. For the definitions, see data definitions.
NOTE: The following series were discontinued in May 2020: volume of core deposits, cost of funds, non-interest income and net interest margin.
Questions regarding the Banking Conditions Survey can be addressed to Mariam Yousuf at mariam.yousuf@dal.frb.org.
Sign up for our email alert to be automatically notified as soon as the latest Banking Conditions Survey is released on the web.