Banking Conditions Survey

For this survey, Eleventh District banking executives were asked supplemental questions on outlook concerns, loan performance, core deposits and lending standards. Read the special questions results.
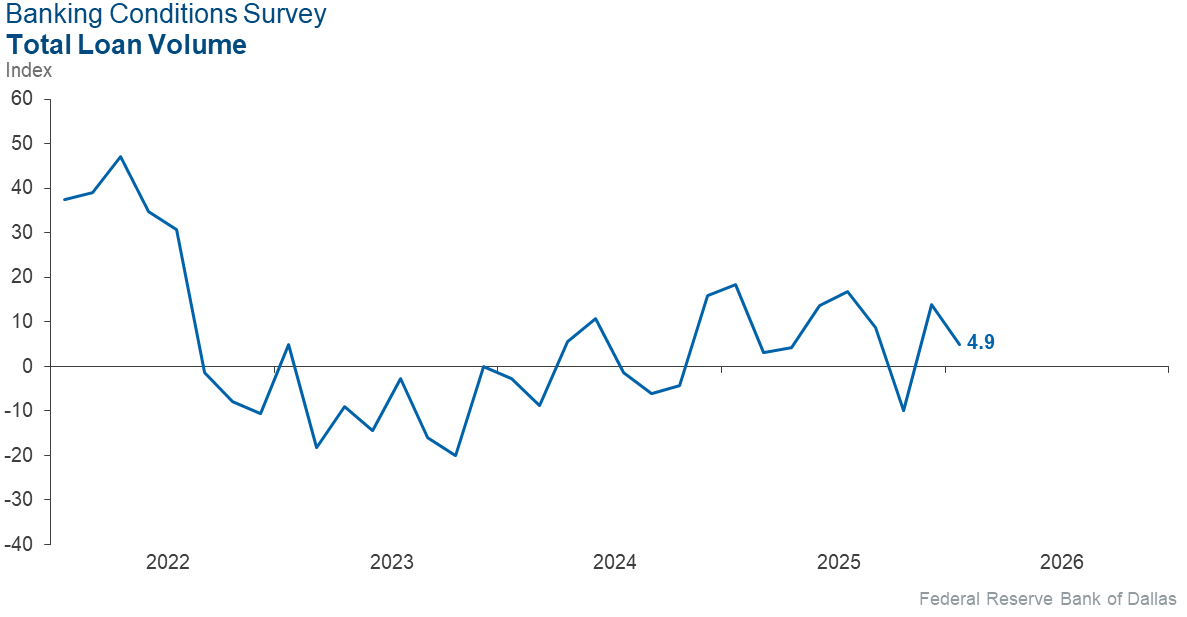
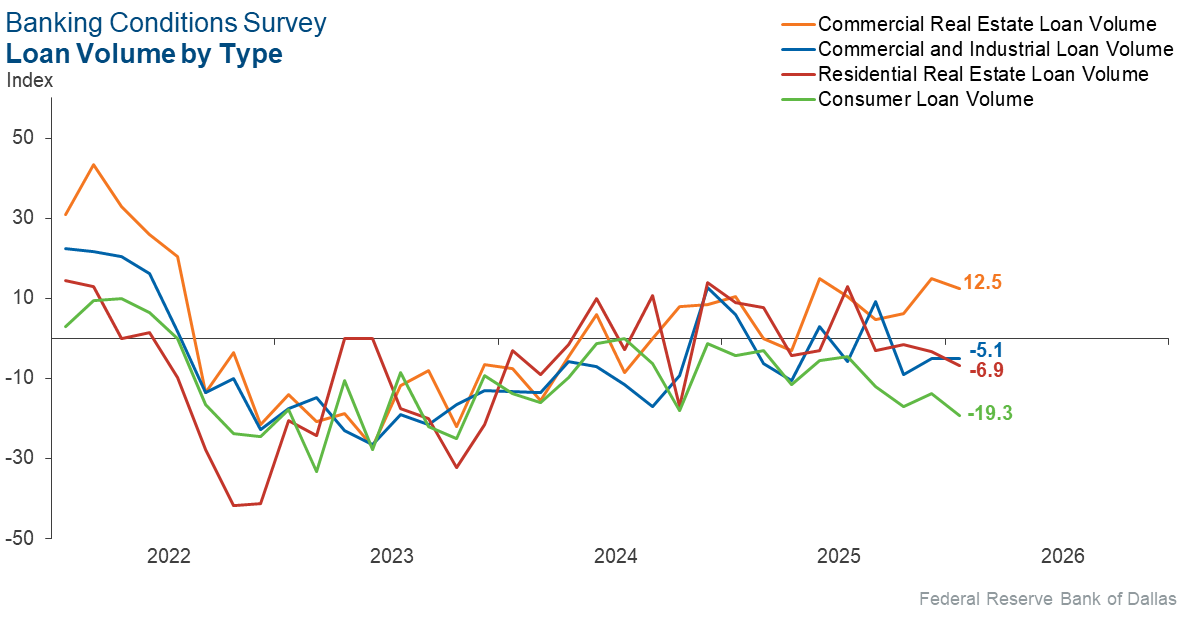
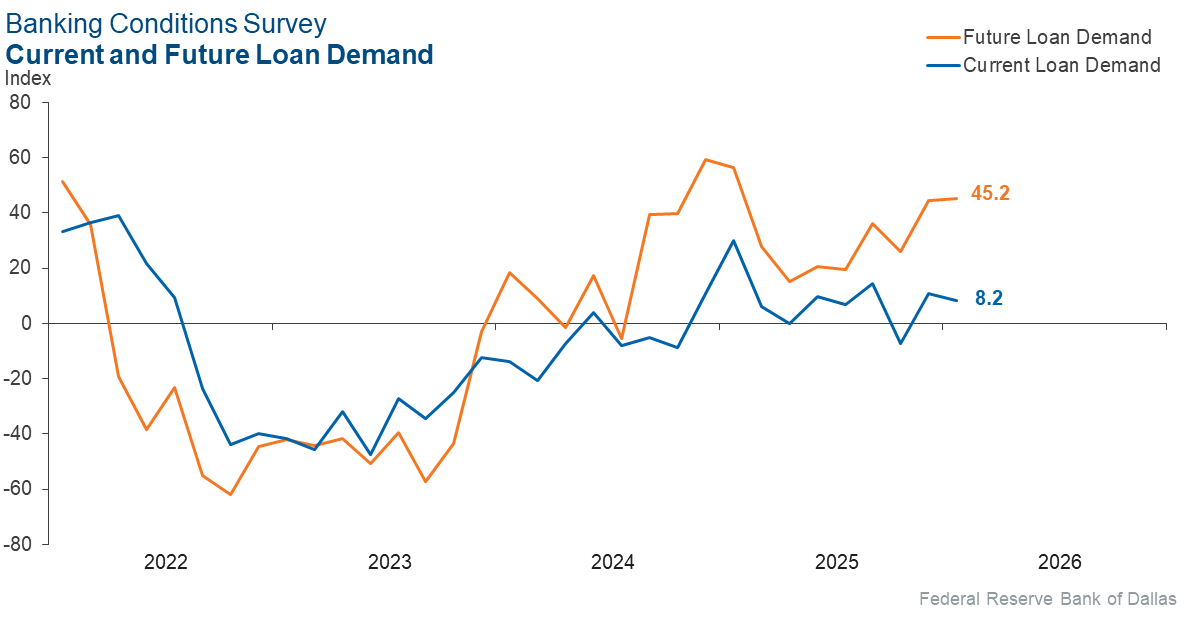
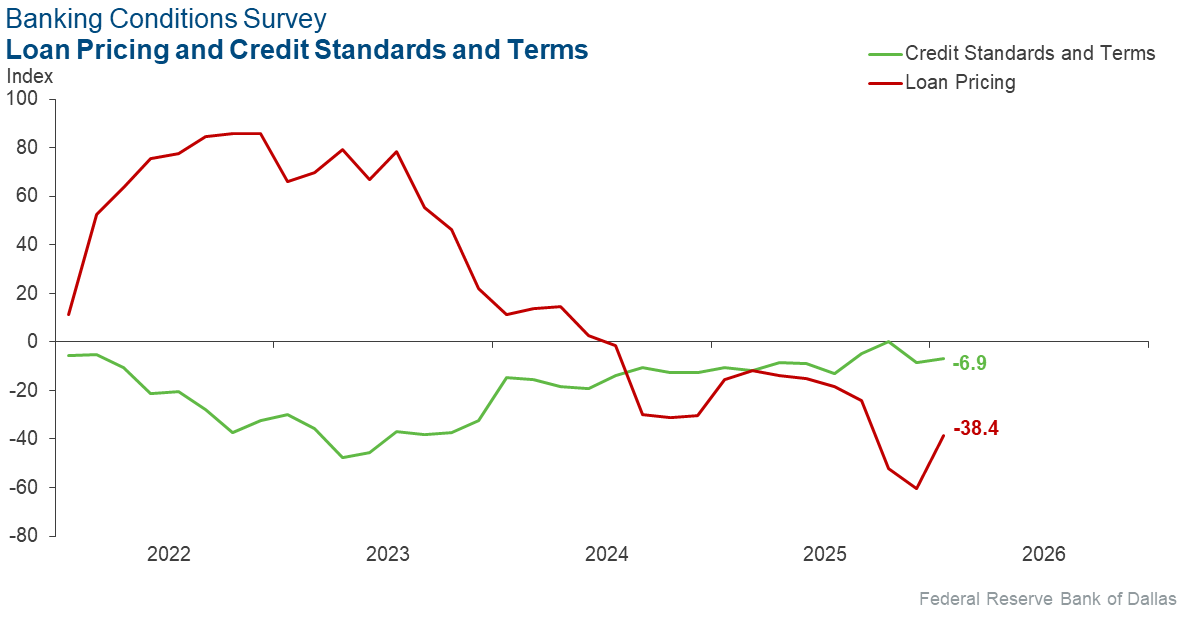
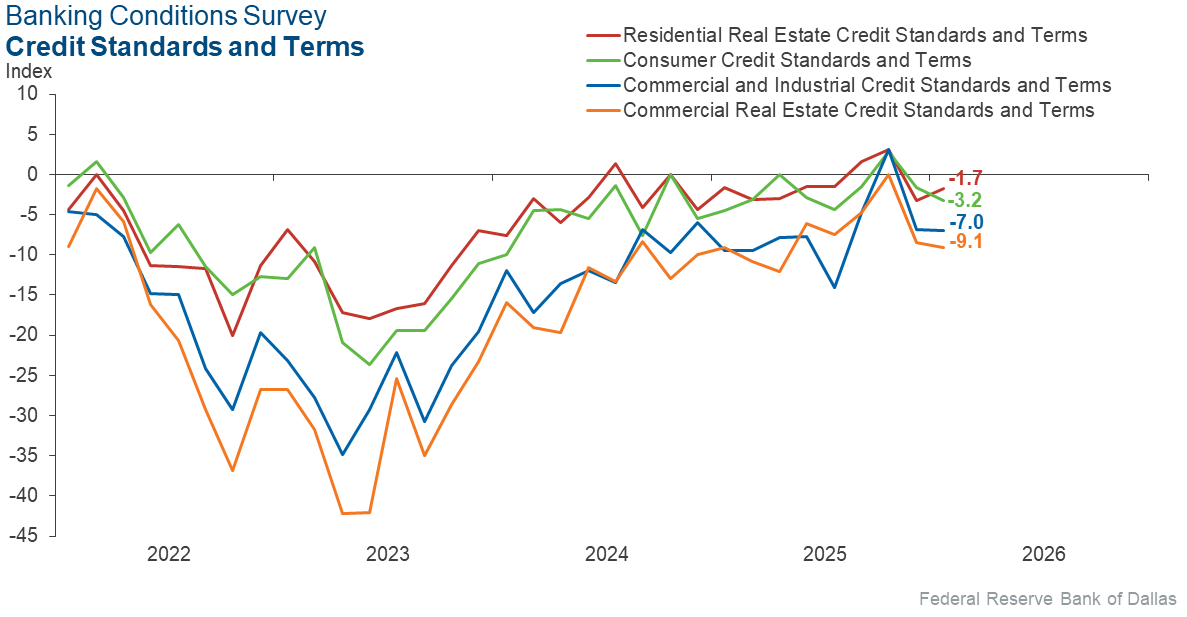
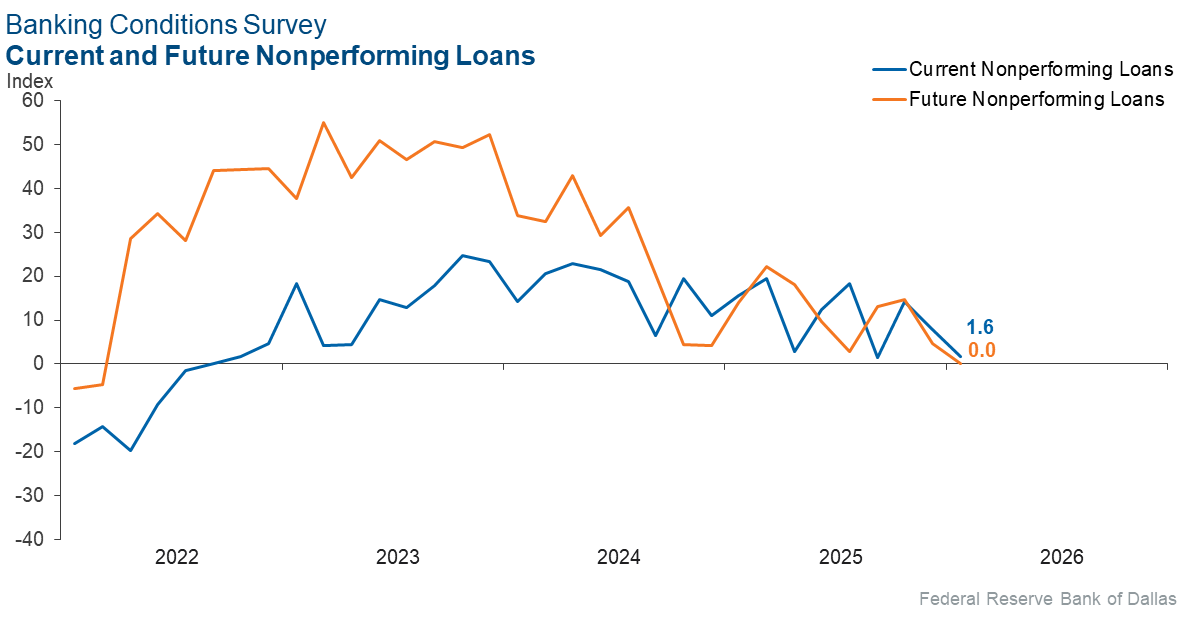
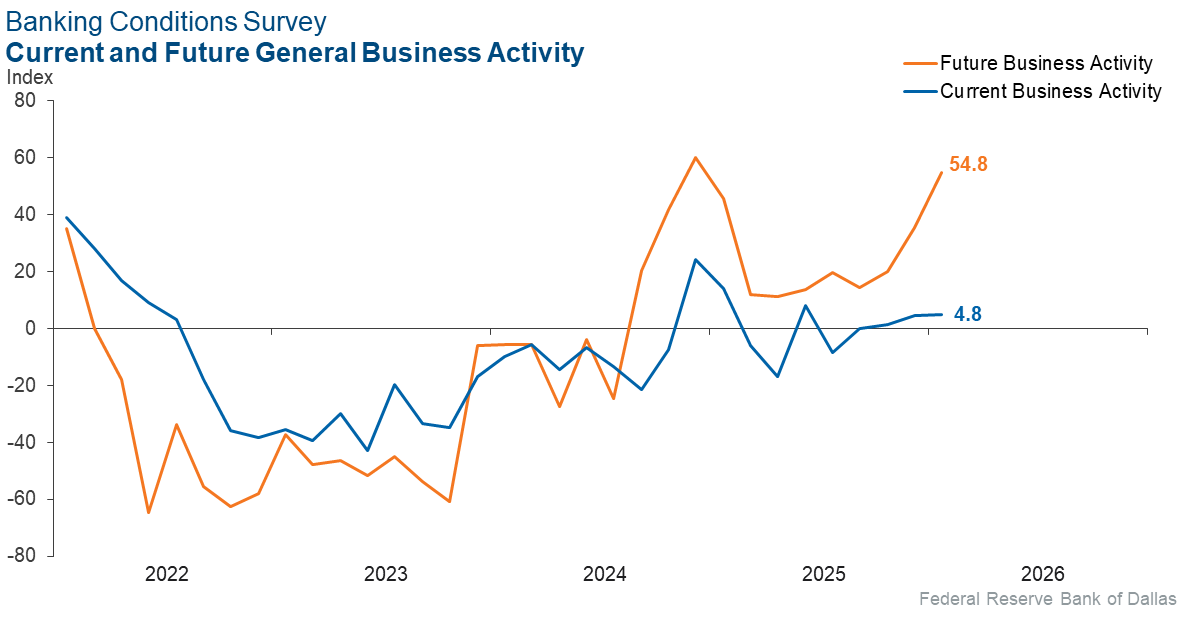
Loan volume and demand continued to increase in February. The expansion in overall loan volume has been supported entirely by commercial real estate loans; residential real estate, consumer and commercial and industrial loan volumes have been declining since the end of 2025. Credit standards and terms tightened, but loan pricing continued to decline. Overall loan performance deteriorated a touch. Bankers reported increasing general business activity. Their outlooks leaned optimistic. Survey respondents broadly expect sizeable growth in loan demand and business activity six months from now and stable loan performance.
Next release: March 30, 2026
Data were collected February 3–11, and 62 financial institutions responded to the survey. The Federal Reserve Bank of Dallas conducts the Banking Conditions Survey twice each quarter to obtain a timely assessment of activity at banks and credit unions headquartered in the Eleventh Federal Reserve District. CEOs or senior loan officers of financial institutions report on how conditions have changed for indicators such as loan volume, nonperforming loans and loan pricing. Respondents are also asked to report on their banking outlook and their evaluation of general business activity.
Survey responses are used to calculate an index for each indicator. Each index is calculated by subtracting the percentage of respondents reporting a decrease (or tightening) from the percentage reporting an increase (or easing). When the share of respondents reporting an increase exceeds the share reporting a decrease, the index will be greater than zero, suggesting the indicator has increased over the prior reporting period. If the share of respondents reporting a decrease exceeds the share reporting an increase, the index will be below zero, suggesting the indicator has decreased over the prior reporting period. An index will be zero when the number of respondents reporting an increase is equal to the number reporting a decrease.
Results summary
Historical data are available from March 2017.
| Total Loans: Over the past six weeks, how have the following changed? | |||||
| Indicator | Current Index | Previous Index | % Reporting Increase | % Reporting No Change | % Reporting Decrease |
Loan volume | 4.9 | 13.8 | 37.7 | 29.5 | 32.8 |
Loan demand | 8.2 | 10.9 | 34.4 | 39.3 | 26.2 |
Nonperforming loans | 1.6 | 7.9 | 16.9 | 67.8 | 15.3 |
Loan pricing | –38.4 | –60.3 | 3.3 | 55.0 | 41.7 |
| Indicator | Current Index | Previous Index | % Reporting Eased | % Reporting No Change | % Reporting Tightened |
Credit standards and terms | –6.9 | –8.3 | 1.7 | 89.7 | 8.6 |
| Commercial and Industrial Loans: Over the past six weeks, how have the following changed? | |||||
| Indicator | Current Index | Previous Index | % Reporting Increase | % Reporting No Change | % Reporting Decrease |
Loan volume | –5.1 | –5.0 | 12.1 | 70.7 | 17.2 |
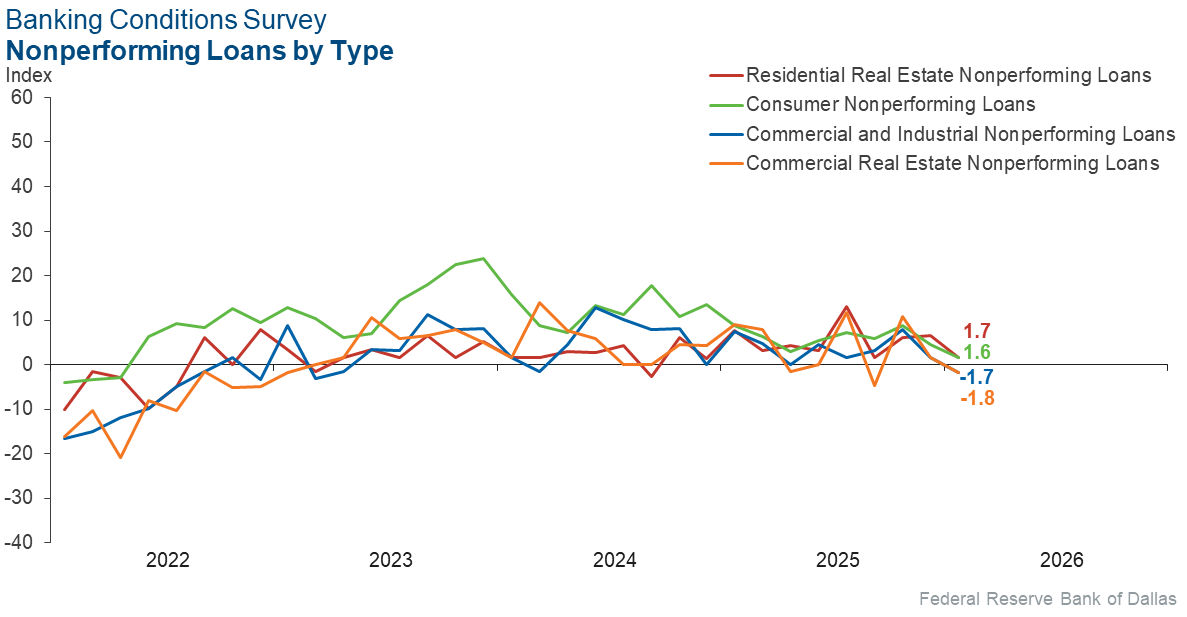
Nonperforming loans | –1.7 | 1.7 | 5.3 | 87.7 | 7.0 |
| Indicator | Current Index | Previous Index | % Reporting Eased | % Reporting No Change | % Reporting Tightened |
Credit standards and terms | –7.0 | –6.8 | 1.8 | 89.5 | 8.8 |
| Commercial Real Estate Loans: Over the past six weeks, how have the following changed? | |||||
| Indicator | Current Index | Previous Index | % Reporting Increase | % Reporting No Change | % Reporting Decrease |
Loan volume | 12.5 | 15.0 | 41.1 | 30.4 | 28.6 |
Nonperforming loans | –1.8 | 1.7 | 10.7 | 76.8 | 12.5 |
| Indicator | Current Index | Previous Index | % Reporting Eased | % Reporting No Change | % Reporting Tightened |
Credit standards and terms | –9.1 | –8.5 | 1.8 | 87.3 | 10.9 |
| Residential Real Estate Loans: Over the past six weeks, how have the following changed? | |||||
| Indicator | Current Index | Previous Index | % Reporting Increase | % Reporting No Change | % Reporting Decrease |
Loan volume | –6.9 | –3.3 | 20.7 | 51.7 | 27.6 |
Nonperforming loans | 1.7 | 6.6 | 8.6 | 84.5 | 6.9 |
| Indicator | Current Index | Previous Index | % Reporting Eased | % Reporting No Change | % Reporting Tightened |
Credit standards and terms | –1.7 | –3.3 | 1.8 | 94.7 | 3.5 |
| Consumer Loans: Over the past six weeks, how have the following changed? | |||||
| Indicator | Current Index | Previous Index | % Reporting Increase | % Reporting No Change | % Reporting Decrease |
Loan volume | –19.3 | –13.9 | 6.5 | 67.7 | 25.8 |
Nonperforming loans | 1.6 | 4.6 | 8.2 | 85.2 | 6.6 |
| Indicator | Current Index | Previous Index | % Reporting Eased | % Reporting No Change | % Reporting Tightened |
Credit standards and terms | –3.2 | –1.6 | 0.0 | 96.8 | 3.2 |
| Banking Outlook: What is your expectation for the following items six months from now? | |||||
| Indicator | Current Index | Previous Index | % Reporting Increase | % Reporting No Change | % Reporting Decrease |
Total loan demand | 45.2 | 44.6 | 62.9 | 19.4 | 17.7 |
Nonperforming loans | 0.0 | 4.6 | 19.4 | 61.3 | 19.4 |
| General Business Activity: What is your evaluation of the level of activity? | |||||
| Indicator | Current Index | Previous Index | % Reporting Better | % Reporting No Change | % Reporting Worse |
Over the past six weeks | 4.8 | 4.7 | 27.4 | 50.0 | 22.6 |
Six months from now | 54.8 | 35.4 | 62.9 | 29.0 | 8.1 |
Survey participants are given the opportunity to submit comments on current issues that may be affecting their businesses. Some comments have been edited for grammar and clarity.
- [We are concerned about] the influence of nonregulated industries competing in the banking industry (crypto, etc). Specifically related to our institution, areas we are closely monitoring are businesses within the oil and gas industry and single-family housing affordability.
- The administration's fight with the Federal Open Market Committee and daily tariff announcements are doing harm to business.
- Fraud losses are continuing to outpace loan losses. The volume of fraud activity has reached a level that we have never seen. The cost of preventing fraud continues to escalate as well. Human resources and software platforms/AI are the primary expenses.
- Most of Texas is suffering from a severe drought. Sooner or later this is going to have an impact on the business climate in Texas. Yes, there are several cities working on desalination, but if we don’t get spring rains, we may experience curtailments to industry and possible plant shutdowns.
- We have seen a little increase in commercial real estate opportunities, but we are barely managing to keep ahead of payoffs.
Historical data can be downloaded dating back to March 2017. For the definitions, see data definitions.
NOTE: The following series were discontinued in May 2020: volume of core deposits, cost of funds, non-interest income and net interest margin.
Questions regarding the Banking Conditions Survey can be addressed to Mariam Yousuf at mariam.yousuf@dal.frb.org.
Sign up for our email alert to be automatically notified as soon as the latest Banking Conditions Survey is released on the web.