Dallas Fed Energy Survey

Third Quarter | September 27, 2017
Oil and Gas Activity Expands at a Slower Pace
What's New This Quarter
This quarter’s special questions include forecasts for U.S. production and the expected impact of Hurricane Harvey on the energy sector.
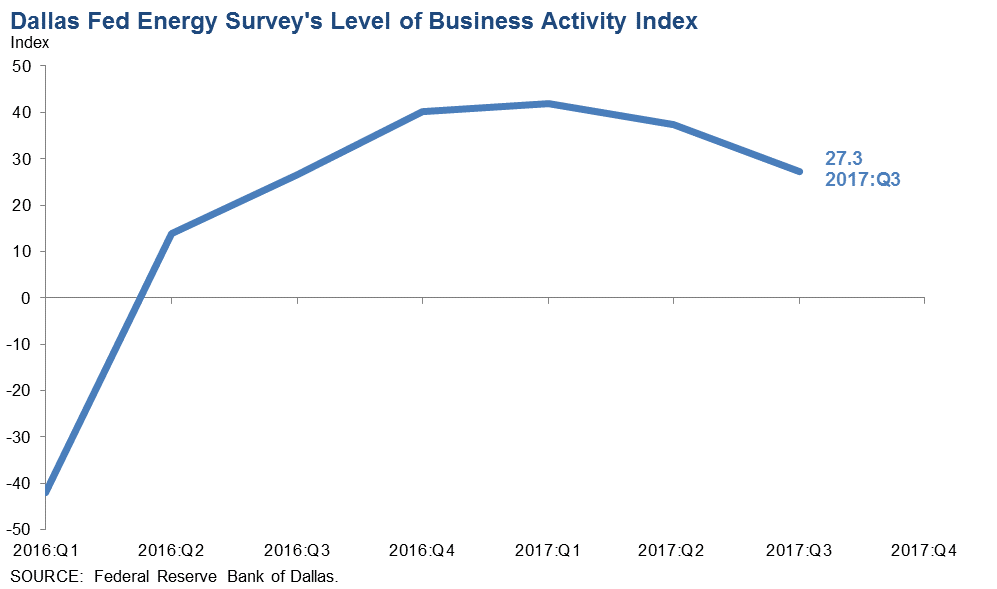
Business activity continued to increase in the third quarter, but at a slower pace, according to oil and gas executives responding to the Dallas Fed Energy Survey. The business activity index—the survey’s broadest measure of conditions facing Eleventh District energy firms—fell from 37.3 in the second quarter to 27.3 in the third but remained positive for the sixth quarter in a row.
Positive readings in the survey generally indicate expansion, while readings below zero generally indicate contraction. All indexes in the latest survey reflected expansion on a quarterly basis.
Oil and gas production increased for the fourth quarter in a row, according to executives at exploration and production (E&P) firms. The oil production index advanced from 10.2 in the second quarter to 19.3 in the third quarter. Likewise, the natural gas production index rose from 10.6 to 17.3.
Equipment utilization among oilfield services firms increased, with the corresponding index at 34.4 in the third quarter, down 11 points from the second quarter. Measures of selling prices and input costs suggested easing pressure on margins for oilfield services firms. The index of prices received for oilfield services jumped from 9.1 to 22.5, while the index of input costs decreased from 37.0 to 28.5.
Labor market indexes point to rising employment and employee hours, albeit at a slower pace than last quarter. Growth in employment was driven primarily by oilfield services firms. The employment index was 24.6 for services firms versus 5.2 for E&P firms. The employee hours indexes also showed a large gap: 32.3 for services firms versus 3.9 for E&P firms. The aggregate wages and benefits index dipped from 22.8 to 18.4.
The company outlook index posted a sixth consecutive positive reading and rose from 20.3 in the second quarter to 28.2 in the third quarter. The uncertainty index regarding the outlook plunged from 35.0 to 4.9. Only 22.5 percent of firms reported increased uncertainty about the future, down from 46.7 percent last quarter.
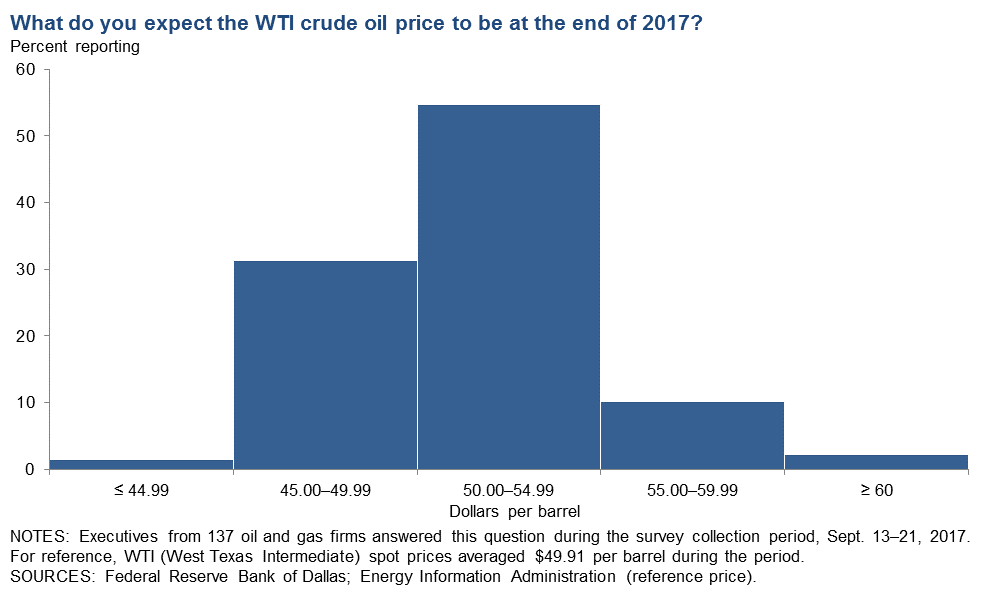
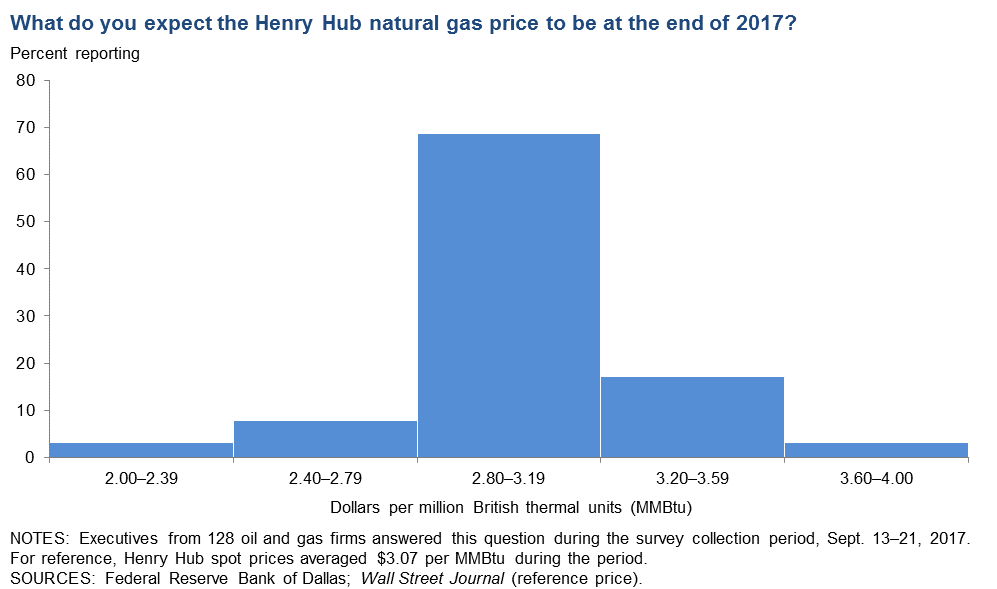
On average, respondents expect West Texas Intermediate (WTI) oil prices to be at $50.20 per barrel by year-end, with responses ranging from $40 to $63 per barrel. Respondents expect Henry Hub natural gas prices will end the year at $3.02 per million British thermal unit (MMBtu). For reference, WTI spot prices averaged $49.91 per barrel and Henry Hub spot prices averaged $3.07 per MMBtu during the survey collection period.
Next release: December 28, 2017
Data were collected Sept. 13-21, and 143 energy firms responded to the survey. Of the respondents, 78 were exploration and production firms and 65 were oilfield services firms. The Dallas Fed conducts the Dallas Fed Energy Survey quarterly to obtain a timely assessment of energy activity among oil and gas firms located or headquartered in the Eleventh District. Firms are asked whether business activity, employment, capital expenditures and other indicators increased, decreased or remained unchanged compared with the prior quarter and with the same quarter a year ago. Survey responses are used to calculate an index for each indicator. Each index is calculated by subtracting the percentage of respondents reporting a decrease from the percentage reporting an increase. When the share of firms reporting an increase exceeds the share reporting a decrease, the index will be greater than zero, suggesting the indicator has increased over the previous quarter. If the share of firms reporting a decrease exceeds the share reporting an increase, the index will be below zero, suggesting the indicator has decreased over the previous quarter. |
Third Quarter | September 27, 2017
Price Forecasts
West Texas Intermediate Crude
| West Texas Intermediate crude oil price (dollars per barrel), year-end 2017 | ||||
| Indicator | Survey Average | Low Forecast | High Forecast | Price During Survey |
Current quarter | $50.20 | $40.00 | $63.00 | $49.91 |
Prior quarter | $48.79 | $30.00 | $65.00 | $43.80 |
Henry Hub Natural Gas
| Henry Hub natural gas price (dollars per MMBtu), year-end 2017 | ||||
| Indicator | Survey Average | Low Forecast | High Forecast | Price During Survey |
Current quarter | $3.02 | $2.00 | $4.00 | $3.07 |
Prior quarter | $3.01 | $2.00 | $4.00 | $2.89 |
NOTE: Price during survey is an average of daily spot prices during the survey collection period.
SOURCES: Energy Information Administration; Wall Street Journal.
Third Quarter | September 27, 2017
Special Questions
Data were collected Sept. 13–21, and 140 oil and gas firms responded to the special questions survey.
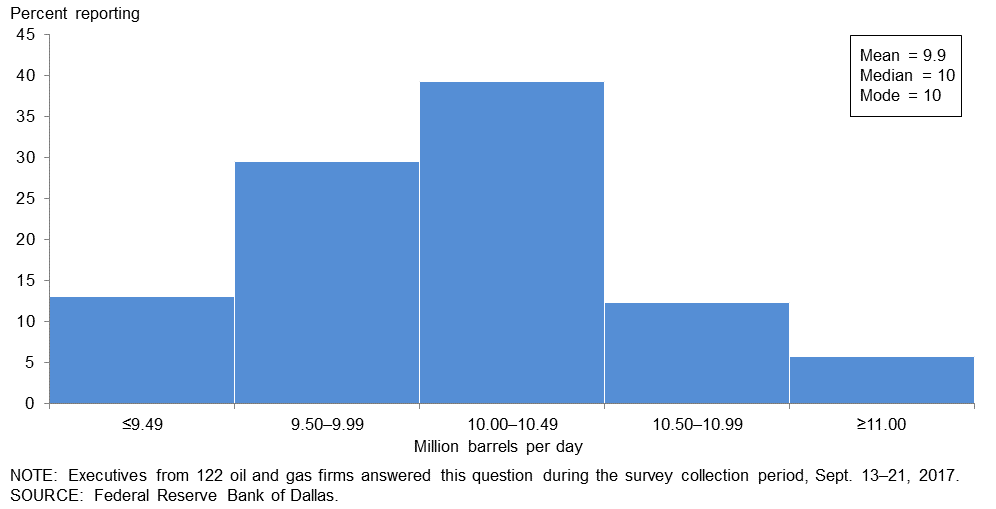
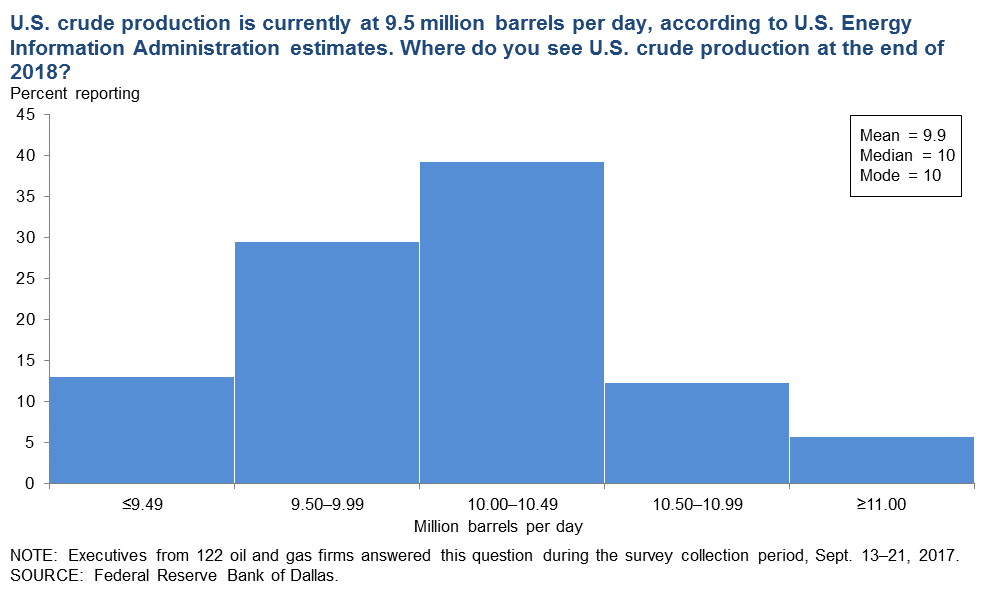
U.S. crude production is currently at 9.5 million barrels per day, according to U.S. Energy Information Administration estimates. Where do you see U.S. crude production at the end of 2018?
Responses were generally above current production levels, with about 30 percent of responses falling between 9.5 and 9.99 million barrels per day (mb/d) and 39 percent between 10 and 10.49 mb/d. The average response was 9.9 mb/d. More than a third of executives entered exactly 10 mb/d. For reference, the Energy Information Administration’s September Short-Term Energy Outlook (STEO) forecast for year-end 2018 was 10.1 mb/d, while the International Energy Agency’s September Oil Market Report (OMR) forecast was 10.4 mb/d.
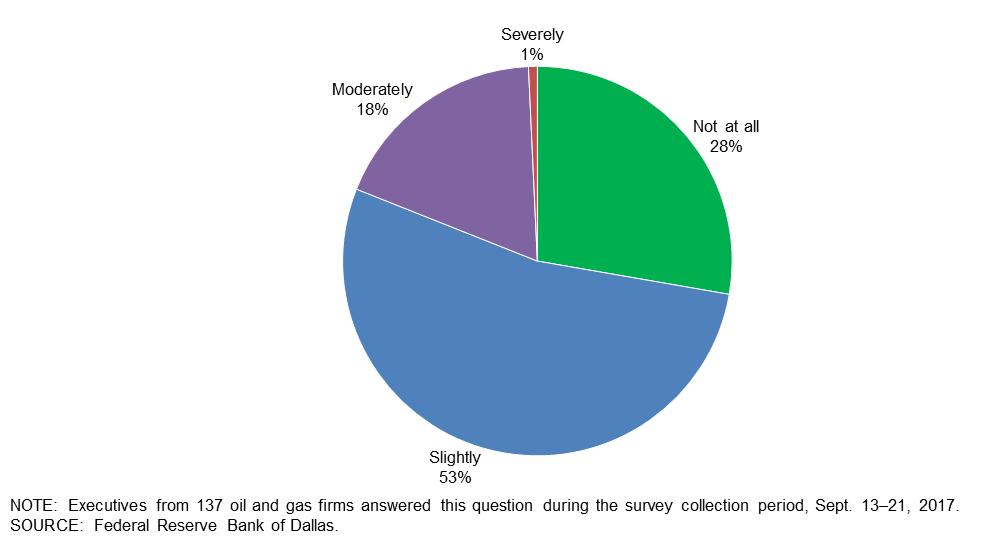
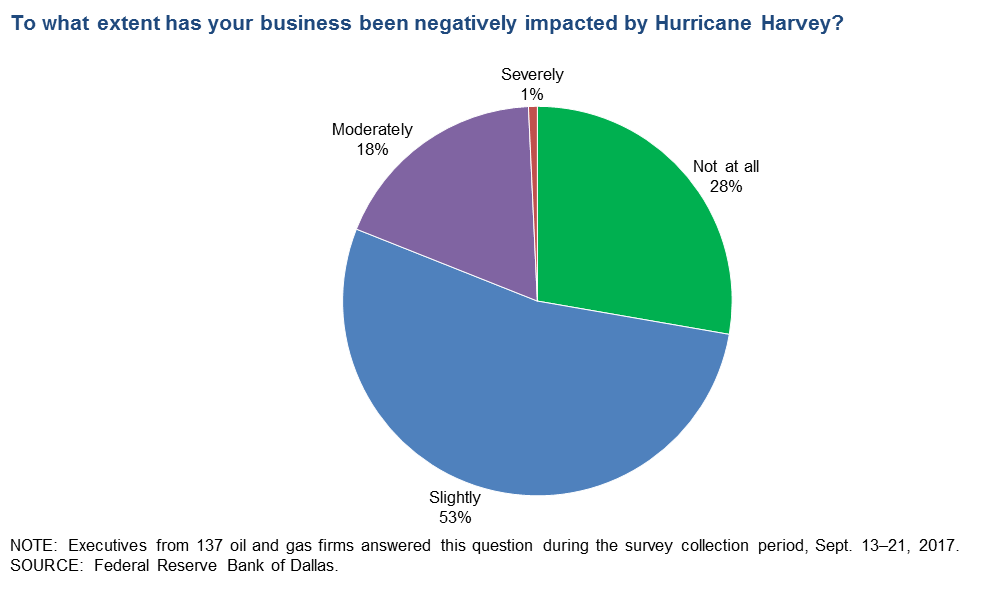
To what extent has your business been negatively impacted by Hurricane Harvey?
A little more than half of the executives—53 percent—said Hurricane Harvey had a slight negative impact on their business. Eighteen percent noted a moderate negative impact and only 1 percent noted a severe negative impact on their business. The remaining 28 percent of executives said their business was not at all impacted by Hurricane Harvey.
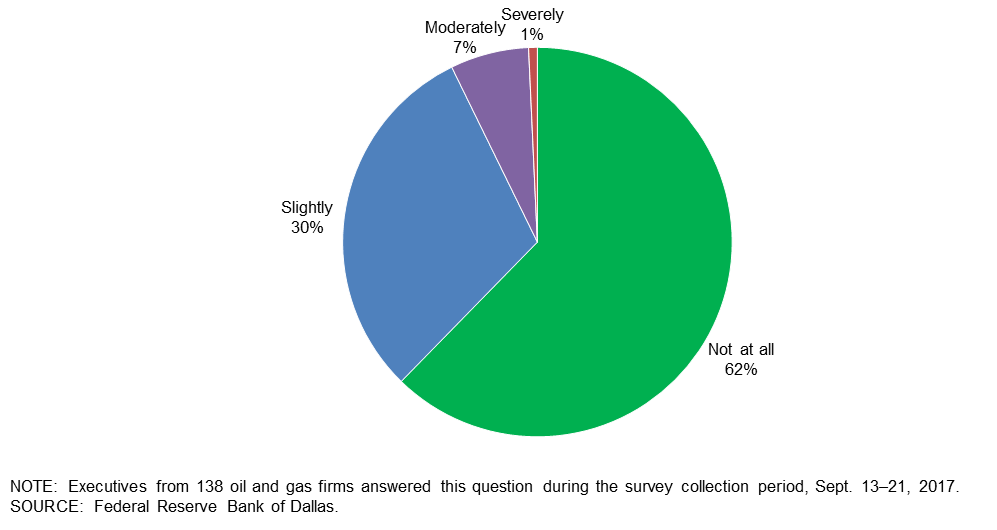
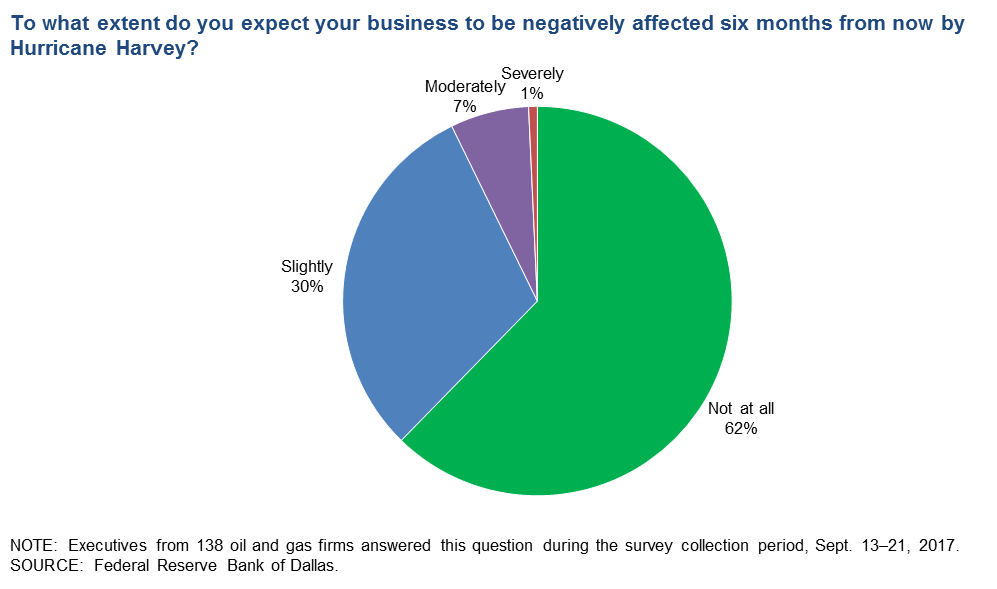
To what extent do you expect your business to be negatively affected six months from now by Hurricane Harvey?
The majority of oil and gas executives responding—62 percent—expect that their business will not be negatively affected six months from now by Hurricane Harvey. Thirty percent expect that their business will be slightly affected, while the remaining 8 percent expect that their business will be moderately or severely affected six months from now.
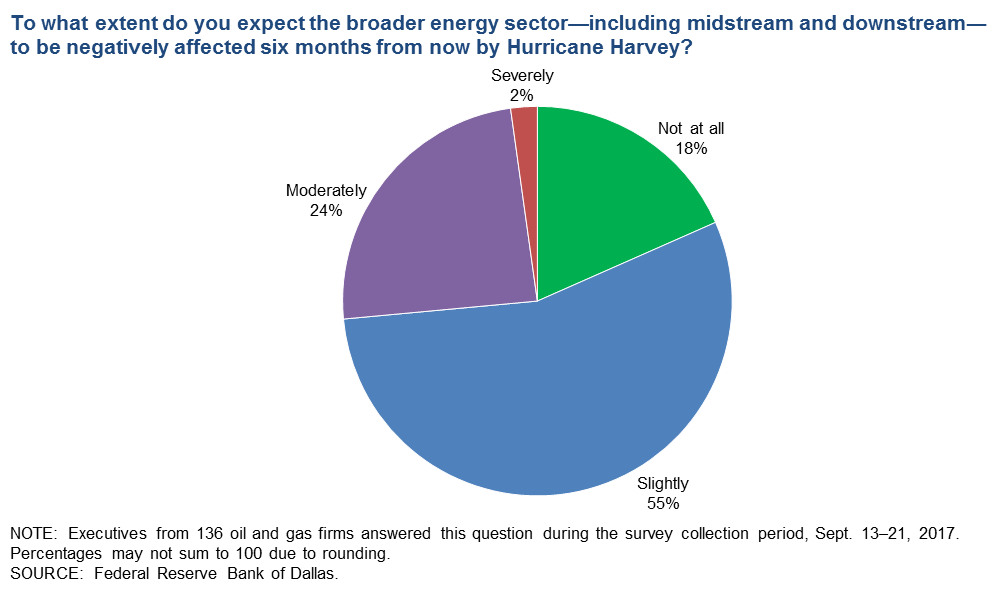
To what extent do you expect the broader energy sector—including midstream and downstream—to be negatively affected six months from now by Hurricane Harvey?
More than half of the executives—55 percent—expect Hurricane Harvey will still have slight negative effects on the broader energy sector six months from now. Almost a quarter of all respondents (24 percent) expect the sector to experience moderately negative effects. Eighteen percent expect no impact from Hurricane Harvey six months from now.

Special Questions Comments »
Third Quarter | September 27, 2017
Historical data are available from first quarter 2016 to the most current release quarter.
Business Indicators: Quarter/Quarter
| Business Indicators: All Firms Current Quarter (versus previous quarter) | |||||
| Indicator | Current Index | Previous Index | % Reporting Increase | % Reporting No Change | % Reporting Decrease |
Level of Business Activity | 27.3 | 37.3 | 40.6 | 46.2 | 13.3 |
Capital Expenditures | 21.8 | 18.4 | 38.7 | 44.4 | 16.9 |
Supplier Delivery Time | 12.3 | 2.9 | 20.3 | 71.7 | 8.0 |
Employment | 14.0 | 22.6 | 23.8 | 66.4 | 9.8 |
Employee Hours | 16.9 | 25.7 | 27.5 | 62.0 | 10.6 |
Wages and Benefits | 18.4 | 22.8 | 25.4 | 67.6 | 7.0 |
| Indicator | Current Index | Previous Index | % Reporting Improved | % Reporting No Change | % Reporting Worsened |
Company Outlook | 28.2 | 20.3 | 37.8 | 52.6 | 9.6 |
| Indicator | Current Index | Previous Index | % Reporting Increase | % Reporting No Change | % Reporting Decrease |
Uncertainty | 4.9 | 35.0 | 22.5 | 59.9 | 17.6 |
| Business Indicators: E&P Firms Current Quarter (versus previous quarter) | |||||
| Indicator | Current Index | Previous Index | % Reporting Increase | % Reporting No Change | % Reporting Decrease |
Level of Business Activity | 15.4 | 25.7 | 32.1 | 51.3 | 16.7 |
Oil Production | 19.3 | 10.2 | 37.2 | 44.9 | 17.9 |
Natural Gas Wellhead Production | 17.3 | 10.6 | 33.3 | 50.7 | 16.0 |
Capital Expenditures | 16.9 | 16.0 | 39.0 | 39.0 | 22.1 |
Expected Level of Capital Expenditures Next Year | 27.3 | 17.9 | 45.5 | 36.4 | 18.2 |
Supplier Delivery Time | 12.2 | 5.9 | 20.3 | 71.6 | 8.1 |
Employment | 5.2 | 5.7 | 16.7 | 71.8 | 11.5 |
Employee Hours | 3.9 | 8.7 | 15.6 | 72.7 | 11.7 |
Wages and Benefits | 10.2 | 18.8 | 19.2 | 71.8 | 9.0 |
Finding and Development Costs | 23.7 | 18.8 | 30.3 | 63.2 | 6.6 |
Lease Operating Expenses | 15.6 | 13.1 | 27.3 | 61.0 | 11.7 |
| Indicator | Current Index | Previous Index | % Reporting Improved | % Reporting No Change | % Reporting Worsened |
Company Outlook | 27.0 | 10.1 | 36.5 | 54.1 | 9.5 |
| Indicator | Current Index | Previous Index | % Reporting Increase | % Reporting No Change | % Reporting Decrease |
Uncertainty | 6.5 | 37.2 | 22.1 | 62.3 | 15.6 |
| Business Indicators: O&G Support Services Firms Current Quarter (versus previous quarter) | |||||
| Indicator | Current Index | Previous Index | % Reporting Increase | % Reporting No Change | % Reporting Decrease |
Level of Business Activity | 41.6 | 49.3 | 50.8 | 40.0 | 9.2 |
Utilization of Equipment | 34.4 | 45.4 | 42.2 | 50.0 | 7.8 |
Capital Expenditures | 27.7 | 20.9 | 38.5 | 50.8 | 10.8 |
Supplier Delivery Time | 12.5 | 0.0 | 20.3 | 71.9 | 7.8 |
Lag Time in Delivery of Firm's Services | 11.3 | 7.5 | 16.1 | 79.0 | 4.8 |
Employment | 24.6 | 40.3 | 32.3 | 60.0 | 7.7 |
Employment Hours | 32.3 | 43.3 | 41.5 | 49.2 | 9.2 |
Wages and Benefits | 28.1 | 26.8 | 32.8 | 62.5 | 4.7 |
Input Costs | 28.5 | 37.0 | 33.3 | 61.9 | 4.8 |
Prices Received for Services | 22.5 | 9.1 | 30.6 | 61.3 | 8.1 |
| Indicator | Current Index | Previous Index | % Reporting Improved | % Reporting No Change | % Reporting Worsened |
Company Outlook | 29.5 | 31.3 | 39.3 | 50.8 | 9.8 |
| Indicator | Current Index | Previous Index | % Reporting Increase | % Reporting No Change | % Reporting Decrease |
Uncertainty | 3.1 | 32.9 | 23.1 | 56.9 | 20.0 |
Business Indicators: Year/Year
| Business Indicators: All Firms Current Quarter (versus same quarter a year ago) | |||||
| Indicator | Current Index | Previous Index | % Reporting Increase | % Reporting No Change | % Reporting Decrease |
Level of Business Activity | 47.4 | 49.2 | 62.4 | 22.6 | 15.0 |
Capital Expenditures | 41.3 | 28.2 | 57.3 | 26.7 | 16.0 |
Supplier Delivery Time | 17.8 | 9.8 | 27.1 | 63.6 | 9.3 |
Employment | 20.1 | 16.0 | 34.3 | 51.5 | 14.2 |
Employee Hours | 25.0 | 28.8 | 34.8 | 55.3 | 9.8 |
Wages and Benefits | 28.1 | 29.0 | 36.4 | 55.3 | 8.3 |
| Indicator | Current Index | Previous Index | % Reporting Improved | % Reporting No Change | % Reporting Worsened |
Company Outlook | 40.9 | 41.4 | 54.2 | 32.5 | 13.3 |
| Business Indicators: E&P Firms Current Quarter (versus same quarter a year ago) | |||||
| Indicator | Current Index | Previous Index | % Reporting Increase | % Reporting No Change | % Reporting Decrease |
Level of Business Activity | 40.2 | 39.0 | 56.9 | 26.4 | 16.7 |
Oil Production | 16.6 | 17.8 | 47.2 | 22.2 | 30.6 |
Natural Gas Wellhead Production | 22.9 | 17.2 | 44.3 | 34.3 | 21.4 |
Capital Expenditures | 37.2 | 17.4 | 58.6 | 20.0 | 21.4 |
Expected Level of Capital Expenditures Next Year | 18.6 | 13.3 | 38.6 | 41.4 | 20.0 |
Supplier Delivery Time | 20.3 | 5.0 | 29.0 | 62.3 | 8.7 |
Employment | 5.5 | –3.1 | 21.9 | 61.6 | 16.4 |
Employee Hours | 5.6 | 6.4 | 16.9 | 71.8 | 11.3 |
Wages and Benefits | 20.9 | 23.8 | 30.6 | 59.7 | 9.7 |
Finding and Development Costs | 25.7 | 17.7 | 35.7 | 54.3 | 10.0 |
Lease Operating Expenses | 19.4 | 5.0 | 31.9 | 55.6 | 12.5 |
| Indicator | Current Index | Previous Index | % Reporting Improved | % Reporting No Change | % Reporting Worsened |
Company Outlook | 30.9 | 25.5 | 47.1 | 36.8 | 16.2 |
| Business Indicators: O&G Support Services Firms Current Quarter (versus same quarter a year ago) | |||||
| Indicator | Current Index | Previous Index | % Reporting Increase | % Reporting No Change | % Reporting Decrease |
Level of Business Activity | 55.8 | 59.7 | 68.9 | 18.0 | 13.1 |
Utilization of Equipment | 56.7 | 54.1 | 66.7 | 23.3 | 10.0 |
Capital Expenditures | 45.9 | 39.3 | 55.7 | 34.4 | 9.8 |
Supplier Delivery Time | 15.0 | 14.5 | 25.0 | 65.0 | 10.0 |
Lag Time in Delivery of Firm's Services | 12.3 | 16.2 | 21.1 | 70.2 | 8.8 |
Employment | 37.7 | 36.1 | 49.2 | 39.3 | 11.5 |
Employment Hours | 47.5 | 51.6 | 55.7 | 36.1 | 8.2 |
Wages and Benefits | 36.6 | 34.4 | 43.3 | 50.0 | 6.7 |
Input Costs | 48.3 | 43.6 | 50.0 | 48.3 | 1.7 |
Prices Received for Services | 27.1 | 18.3 | 35.6 | 55.9 | 8.5 |
| Indicator | Current Index | Previous Index | % Reporting Improved | % Reporting No Change | % Reporting Worsened |
Company Outlook | 53.9 | 57.9 | 63.5 | 26.9 | 9.6 |
Third Quarter | September 27, 2017
Activity Chart
Third Quarter | September 27, 2017
Comments from Survey Respondents
These comments are from respondents’ completed surveys and have been edited for publication. Comments from the Special Questions survey can be found below.
Exploration and Production Firms
- With the oil price downturn beginning at the end of May 2017, access to equity by public companies has been limited and thereby has reduced the public sector’s appetite for expansion through acquisitions and the entrance of new equity issuers (IPOs). This, in turn, has had a ripple effect on the appetite of private equity providers to expose dollars for greenfield leasing and drilling activities. In spite of attractive returns in the STACK, our equity provider has effectively shut us down, and we are seeing other equity providers do the same not only in the SCOOP/STACK, but also in the Delaware Basin. It has nothing to do with the drill bit returns, but rather with concern regarding who will ultimately buy the asset, at what price and when.
- Any production/supply reduction (or status quo, for that matter) that is experienced in the next six months is entirely synthetic. If OPEC/Russia were to take their foot off the brake, supply would increase fairly dramatically, consequently negatively impacting crude prices. Domestic production will continue to increase in the $48–$52-per-barrel environment as access to capital will be sufficient to materially maintain capital expenditure budgets at least into the first half of 2018. As trite and overused as the statement has become ... the cure for low oil prices is low oil prices.
- It is very difficult to feel confident in the long-term outlook for oil and gas wellhead prices. The many factors for the U.S. and the world markets seem to be in new territory. The announcement by countries such as France and China that they will guide their economies away from fossil fuel use, whether it can happen or not in a meaningful time frame, is a difficult scenario for small, independent companies such as mine to plan for. Plans for capital spending are uncertain for those operating stripper production.
- Continued depression of oil prices below $50 per barrel is taking its toll on capital investment, as operating cash is not sufficient. New capital must be introduced to fund expansion.
- The business environment continues to be tough.
- As an offshore operator, there is a better working environment with our primary regulator, helping reduce uncertainty in that regard.
- There is an improving mood in the industry.
- We have found several projects that work at the lower crude price and are expecting to increase our production from these areas.
- Natural gas production this quarter is down, owing to wells shut in during Hurricane Harvey. We expect this to be a temporary situation. The wells are now coming back online.
- I am always surprised that U.S. oil producers, especially the high-cost shale oil players, rely on the unstable OPEC cartel for their livelihoods.
- In the absence of an “event”—material, political, economic or military—crude should trade in a fairly narrow channel in the $50–$60-per-barrel range. If there is an event, particularly a military event, whether in Asia or the Middle East, there is the potential for grossly exaggerated price inflation, particularly if the event is in the Middle East. As somewhat a pessimist, I expect an event.
- The current administration has fast-tracked various permits and removed many Environmental Protection Agency and federal rules from blocking healthy growth.
Oil and Gas Support Services Firms
- Positive cash flow is increasingly the focus of our customers, onshore U.S. drillers, and positive cash flow appears to be increasingly difficult to achieve. The rush continues toward the Permian Basin (Delaware Basin specifically).
- The U.S. onshore rig count has peaked. If oil prices don't improve, we expect business growth to stop. As the market stagnates, we will find it more difficult to increase our prices for products and services.
- Drilling activity continues, although the increase in the rig count has slowed. There is overall pessimism as to the potential for the oil price to increase anytime soon (two-plus years).
- The ability to find employees to fill open positions is becoming problematic. Immigration and Customs Enforcement raids of various oilfield servicing and other industries in the South Plains district have reduced the available workforce by 40 to 50 percent, resulting in significant wage pressures due to competition between all industries drawing from the same reduced employee pool.
- I am still optimistic about West Texas activity levels. Pipeline and other infrastructure projects are doing well. It was interesting to see the effects of that much water in and around hurricane-affected areas. East Texas is still lagging behind the rest of the industry, but there are hopeful signs that activity might be picking up.
- We are still trying to find that new “normal.” With gross margins down significantly, we are breaking even most months and occasionally posting a small companywide profit.
- For starters, the Internal Revenue Service has no compassion for the small businesses; no matter rain or shine, they want their money. We have paid penalty fees and interest on borrowing, and we get no credit whatsoever. We had 63 employees, and now we are down to 36 employees in my trucking oilfield business company (vacuum trucks). I put it up for sale and had no luck; I am left with no choice but to close the business by the end of this year. The oilfield industry is not easy; waiting two to three months to get paid and paying the IRS every week is not an easy task. Good luck to the rest of the companies out there working in the oil industry. Be safe!
- The unknowns are still, in no particular order: OPEC, expiration of hedging contracts, and return on investment. With OPEC, the questions are the same as last quarter: Will they continue their cuts, are they enforceable and are they enforced? Hedging contracts should expire at the end of the year for almost all those who hedged their oil; the question is, what will be the effect? Will drilling decrease? Will there be bankruptcies? But the big question is whether “other people’s money” flowing into the oil business will continue to saturate leasing, drilling and completions. For the time being, the oil and gas business is an attractive place for investors who know little or nothing about the realities of the oil and gas industry. Whether they will continue to be happy with the return on their investment, particularly in horizontal wells, remains to be seen.
- I don't see oil or natural gas prices changing in the near future.
- I have a stable outlook quarter to quarter.
- We are seeing some improvement in our equipment rentals. The last quarter of this year is going to be busy, and the first quarter of 2018 is looking promising. Rates need to get a little better, money is still tight and we need capital. While there seems to be some interest in funding, regulatory factors are still holding the banks back. Rising interest rates will not help us. The Affordable Care Act continues to be the worst thing that could happen to my company. Our rates have doubled, our services are less and deductibles are higher—it’s a nightmare. We badly need help in this area.
- The labor shortage is getting bad. We are trying to hire technicians. We will be using man camps and flex scheduling for the first time.
Special Questions Comments
Exploration and Production Firms
- Harvey significantly affected natural gas and oil demand. Refineries shut down, and oil prices suffered initially but have since recovered. Natural gas prices fell and have not fully recovered. Demand fell much more than supply.
- Refining margins have improved for those refineries that are operating. It is ironic that downstream, which was most affected by Harvey, will be a beneficiary, other than those refiners that had damage.
- Harvey has demonstrated, once again, that our reliance on foreign crude can be interrupted, and we should continue to encourage domestic production.
- Gas sales and oil load pickups were curtailed in 75 percent of my production. A drilling well in the Eagle Ford had to lay the derrick down and leave the well shut-in for five days.
- A significant percentage of our gas wells were shut in as a precaution during Hurricane Harvey. They are coming back online, so we do not expect to suffer damage other than temporary loss of production.
- Some uncertainty exists in the industry due to the effects of Hurricane Harvey. Capacity issues are looming.
- If the global warming people jump on the storms like Harvey and Irma, that will cause municipalities to consider blocking shale development, which would restrict supply and cause prices to increase.
- Hurricane Harvey has only slightly affected upstream business for most of South Texas where my company operates.
- Harvey shut in all of our Texas production. We expect to see six weeks of downtime impact from the storm.
- Hurricane Harvey’s epic impact on the midstream and downstream businesses is just temporary, but it is a forewarning of what could happen. Had Harvey made a direct hit at full hurricane force, the impact would be more lasting and disruptive.
- I was surprised to see gasoline shortages between Dallas and San Antonio on a driving trip Sept. 9-11, with major outages in San Antonio.
Oil and Gas Support Services Firms
- Hurricane Harvey affected the city of Houston greatly, as well as the Gulf Coast cities. Houston is one of the hubs of energy in Texas, so there will be effects for quite some time. Gasoline prices have increased all over the United States. Refineries were shut down for a week, with one still shut down for leaks. The cost of insurance for cars, homes and health will skyrocket due to Hurricane Harvey and now Hurricane Irma. People have lost their lives, and a health crisis is on the verge of breaking out due to the floods both here in Texas and now in the state of Florida.
- We found that business in the Eagle Ford was only stopped for three to four days after the hurricane. Other areas saw no impact on activity. Unless the aftermath negatively impacts demand for oil, the longer-term impact should be minimal.
- Outside of the immediate storm impact/damage and work interruption, the biggest issue with Harvey will be the slow invoice and payment processing from our customers in the Houston area who were out of their offices for over a week. This will have ripple effects for weeks.
Questions regarding the Dallas Fed Energy Survey can be addressed to Michael Plante at Michael.Plante@dal.frb.org or Kunal Patel at Kunal.Patel@dal.frb.org.
Sign up for our e-mail alert to be automatically notified as soon as the latest Dallas Fed Energy Survey is released on the web.