Dallas Fed Energy Survey

Fourth Quarter | January 3, 2019
Oil and Gas Sector Growth Stalls amid Sharp Oil Price Decline
What's New This Quarter
Special questions this quarter focus on capital spending in 2019, operating margins for oilfield services firms and exploration and production firms’ primary goals for the coming year.
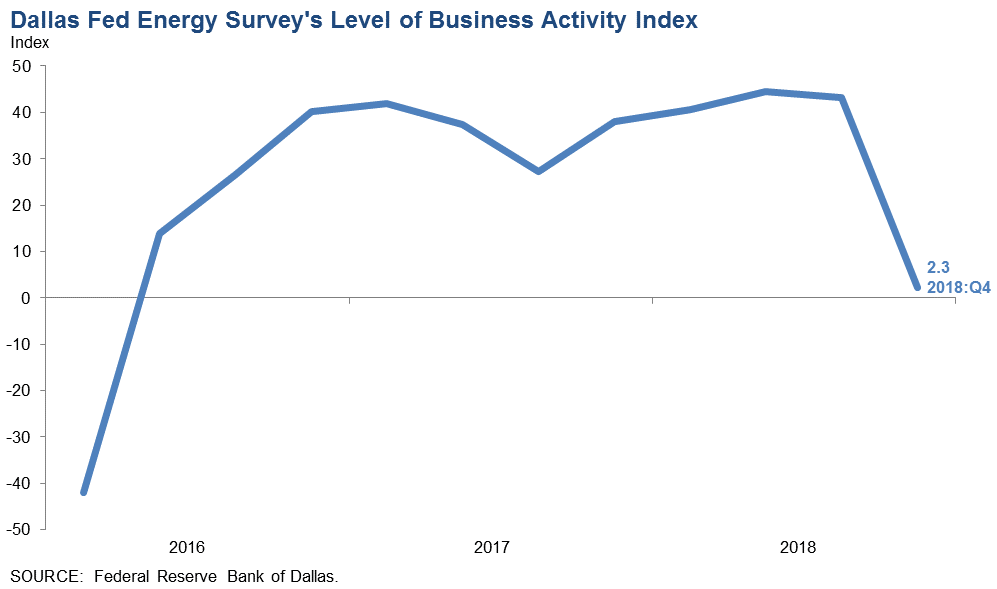
Growth in energy sector activity slowed significantly in fourth quarter 2018, according to oil and gas executives responding to the Dallas Fed Energy Survey. The business activity index—the survey’s broadest measure of conditions facing Eleventh District energy firms—remained positive, but barely so, plunging from 43.3 in the third quarter to 2.3 in the fourth. Readings near zero indicate activity was largely unchanged from the prior quarter, a break from the 10-quarter-long trend of rising activity. The decrease in the fourth-quarter index was driven by both exploration and production (E&P) and oilfield services firms.
Positive readings in the survey generally indicate expansion, while readings below zero suggest contraction.
Oil and gas production increased for the ninth consecutive quarter, according to executives at E&P firms. The oil production index moved down from 34.8 in the third quarter to 29.1 in the fourth. Additionally, the natural gas production index fell from 35.5 to 24.8.
The index for utilization of equipment by oilfield services firms dropped sharply in the fourth quarter, with the corresponding index at 1.6, down 43 points from the third quarter. This suggests utilization rates remained relatively unchanged from the third quarter. Input costs on the services side increased but at a slower pace as the index declined from 46.6 to 36.7. Meanwhile, the index of prices received for oilfield services fell sharply from 23.2 to zero, suggesting prices were unchanged on a quarter-over-quarter basis. Looking at the special question responses, operating margins declined for oilfield services firms in the fourth quarter relative to the third.
Labor market indexes pointed to moderation in both employment and work hours growth in the fourth quarter, particularly for oilfield services, while wage growth accelerated. The employment index for services fell sharply, from 31.7 to 17.5. The hours worked index for services also dropped, from 41.0 to 19.4. The declines were smaller for E&P firms as the employment index moved down from 17.4 to 11.5 and the hours worked index fell from 12.8 to 7.7. The aggregate wages and benefits index advanced from 23.5 to 32.9.
The company outlook index posted its first negative reading since first quarter 2016, plunging 57 points to -10.2 in the fourth quarter. This drop was particularly prominent among oilfield services firms, where the company outlook slumped 64 points to -17.2. The uncertainty index jumped 34 points to 42.4, pointing to heightened uncertainty regarding firms’ outlooks. Almost 58 percent of firms reported greater uncertainty.
When asked about expectations for where West Texas Intermediate (WTI) oil prices would be by year-end 2019, the average response was $59.97 per barrel. This is close to $11 higher than the average spot price during the survey period, which was $49.22 per barrel. Responses ranged from $45 to $80.
On average, respondents expect Henry Hub natural gas prices to be $3.34 per million British thermal units (MMBtu) at the end of 2019. Responses ranged from $2 to $5.50. For reference, Henry Hub spot prices averaged $3.97 per MMBtu during the survey collection period.
Next release: March 27, 2019
|
Data were collected Dec. 12–20, and 167 energy firms responded to the survey. Of the respondents, 104 were exploration and production firms and 63 were oilfield services firms. The Dallas Fed conducts the Dallas Fed Energy Survey quarterly to obtain a timely assessment of energy activity among oil and gas firms located or headquartered in the Eleventh District. Firms are asked whether business activity, employment, capital expenditures and other indicators increased, decreased or remained unchanged compared with the prior quarter and with the same quarter a year ago. Survey responses are used to calculate an index for each indicator. Each index is calculated by subtracting the percentage of respondents reporting a decrease from the percentage reporting an increase. When the share of firms reporting an increase exceeds the share reporting a decrease, the index will be greater than zero, suggesting the indicator has increased over the previous quarter. If the share of firms reporting a decrease exceeds the share reporting an increase, the index will be below zero, suggesting the indicator has decreased over the previous quarter. |
Fourth Quarter | January 3, 2019
Price Forecasts
West Texas Intermediate Crude
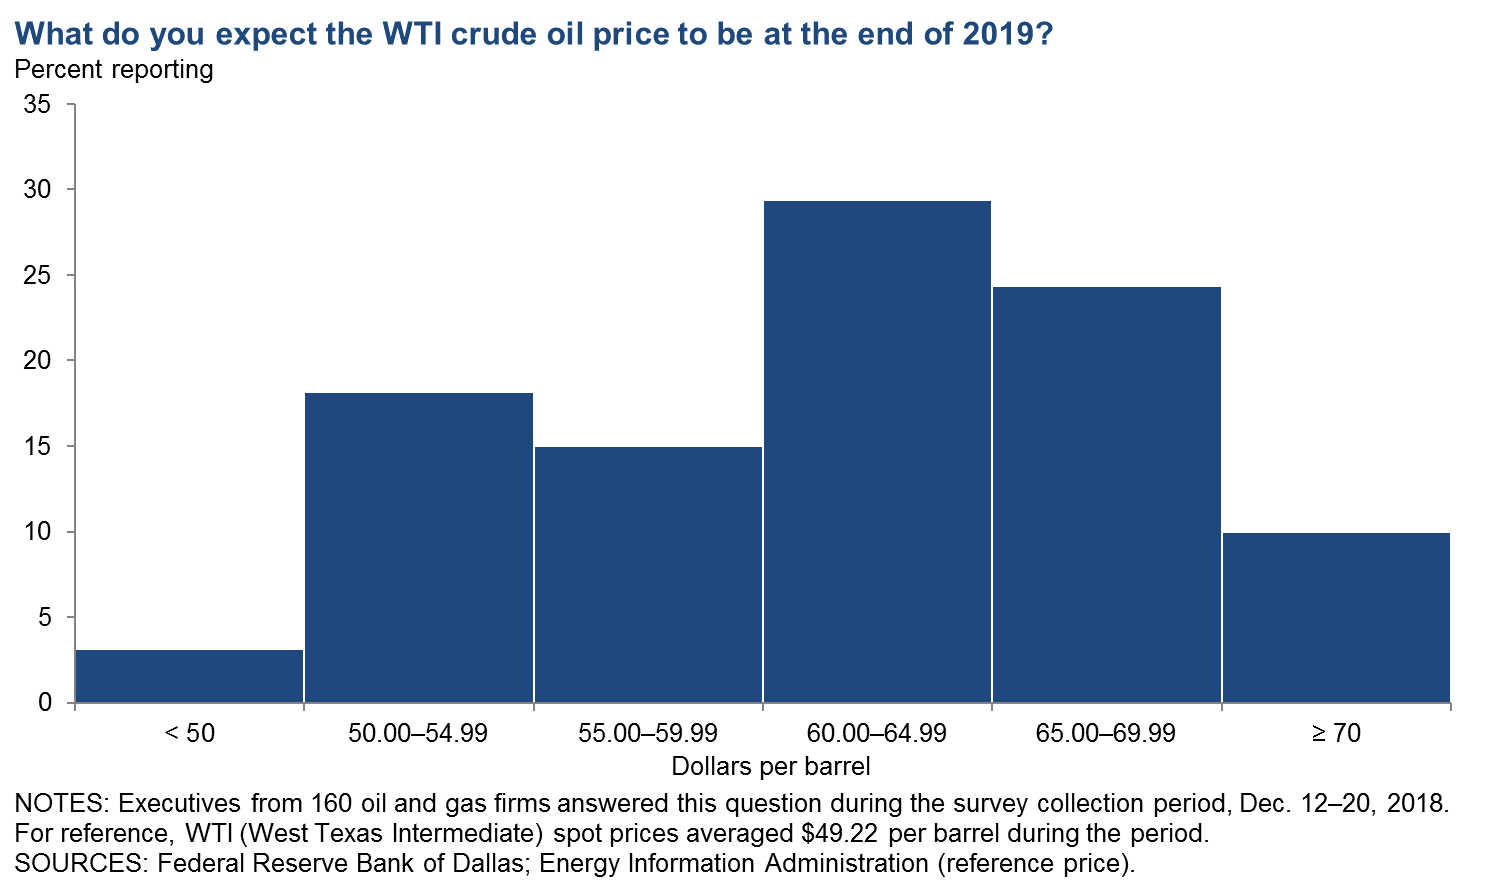
| West Texas Intermediate crude oil price (dollars per barrel), year-end 2019 | ||||
| Indicator | Survey Average | Low Forecast | High Forecast | Price During Survey |
Current quarter | $59.97 | $45.00 | $80.00 | $49.22 |
Prior quarter | N/A | N/A | N/A | N/A |
| NOTE: Price during survey is an average of daily spot prices during the survey collection period. SOURCES: Energy Information Administration; Federal Reserve Bank of Dallas |
||||
Henry Hub Natural Gas
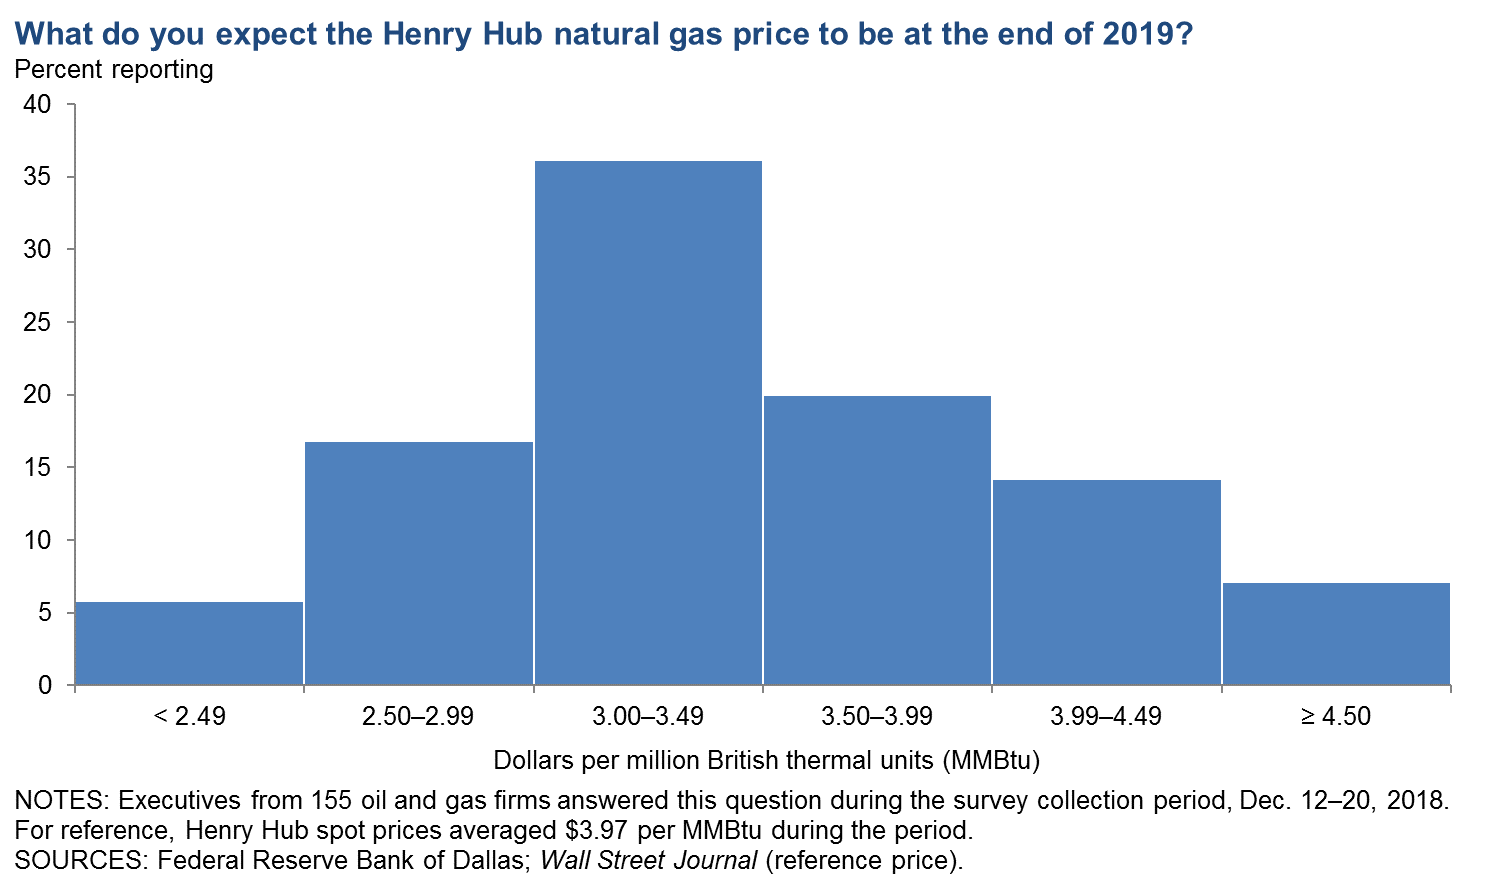
| Henry Hub natural gas price (dollars per MMBtu), year-end 2019 | ||||
| Indicator | Survey Average | Low Forecast | High Forecast | Price During Survey |
Current quarter | $3.34 | $2.00 | $5.50 | $3.97 |
Prior quarter | N/A | N/A | N/A | N/A |
| NOTE: Price during survey is an average of daily spot prices during the survey collection period. SOURCES: Wall Street Journal; Federal Reserve Bank of Dallas |
||||
Fourth Quarter | January 3, 2019
Special Questions
Data were collected December 12–20, and 163 oil and gas firms responded to the special questions survey.
All Firms
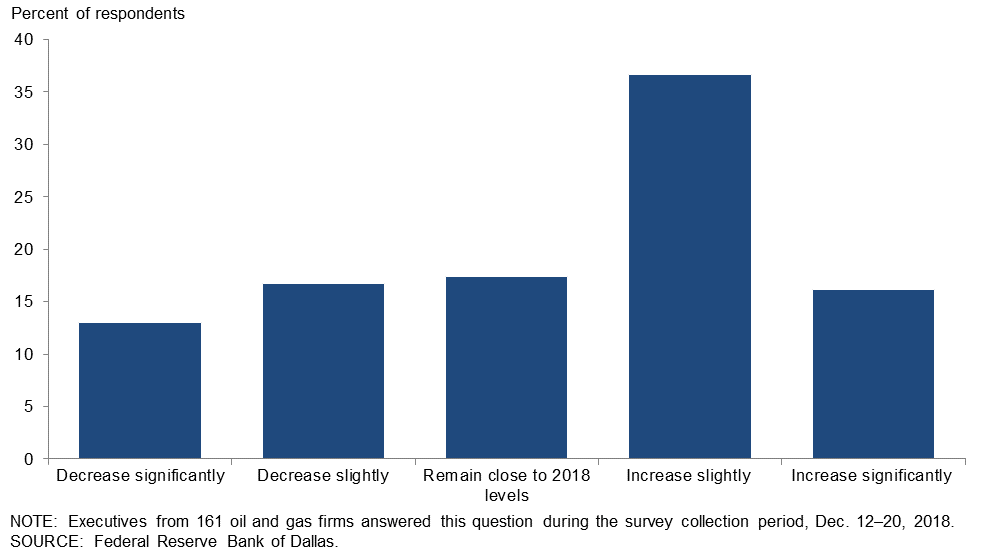
What are your expectations for your firm’s capital spending in 2019 versus 2018?
Reponses were mixed among executives, although most expect their firm’s capital spending to increase in 2019 compared with 2018. Thirty-seven percent of executives said they expect capital spending to slightly increase, while an additional 16 percent anticipate a significant increase. Seventeen percent expect their firm’s capital spending to decrease slightly and 13 percent anticipate a significant decrease. Seventeen percent expect spending to remain near 2018 levels in 2019.
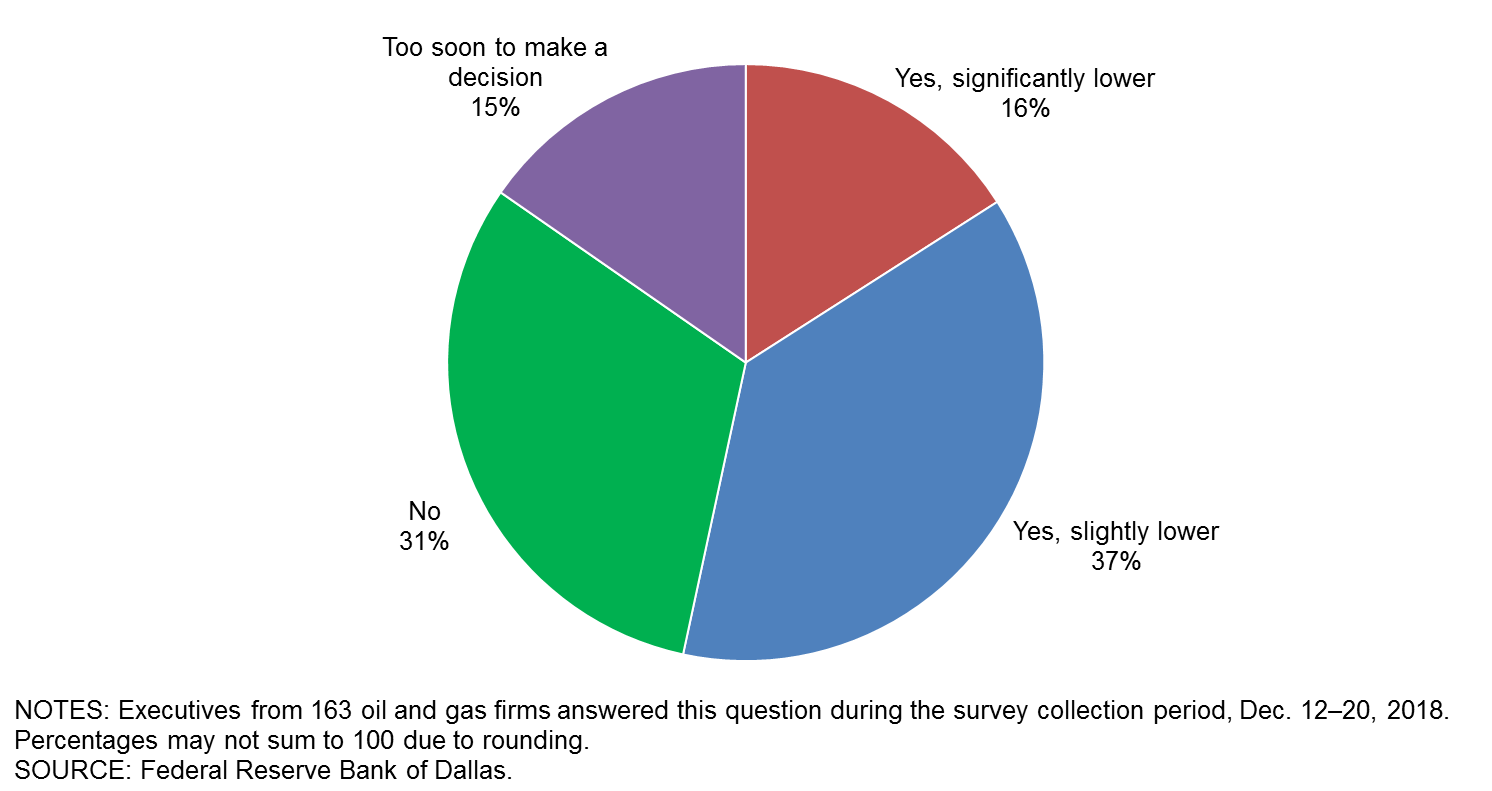
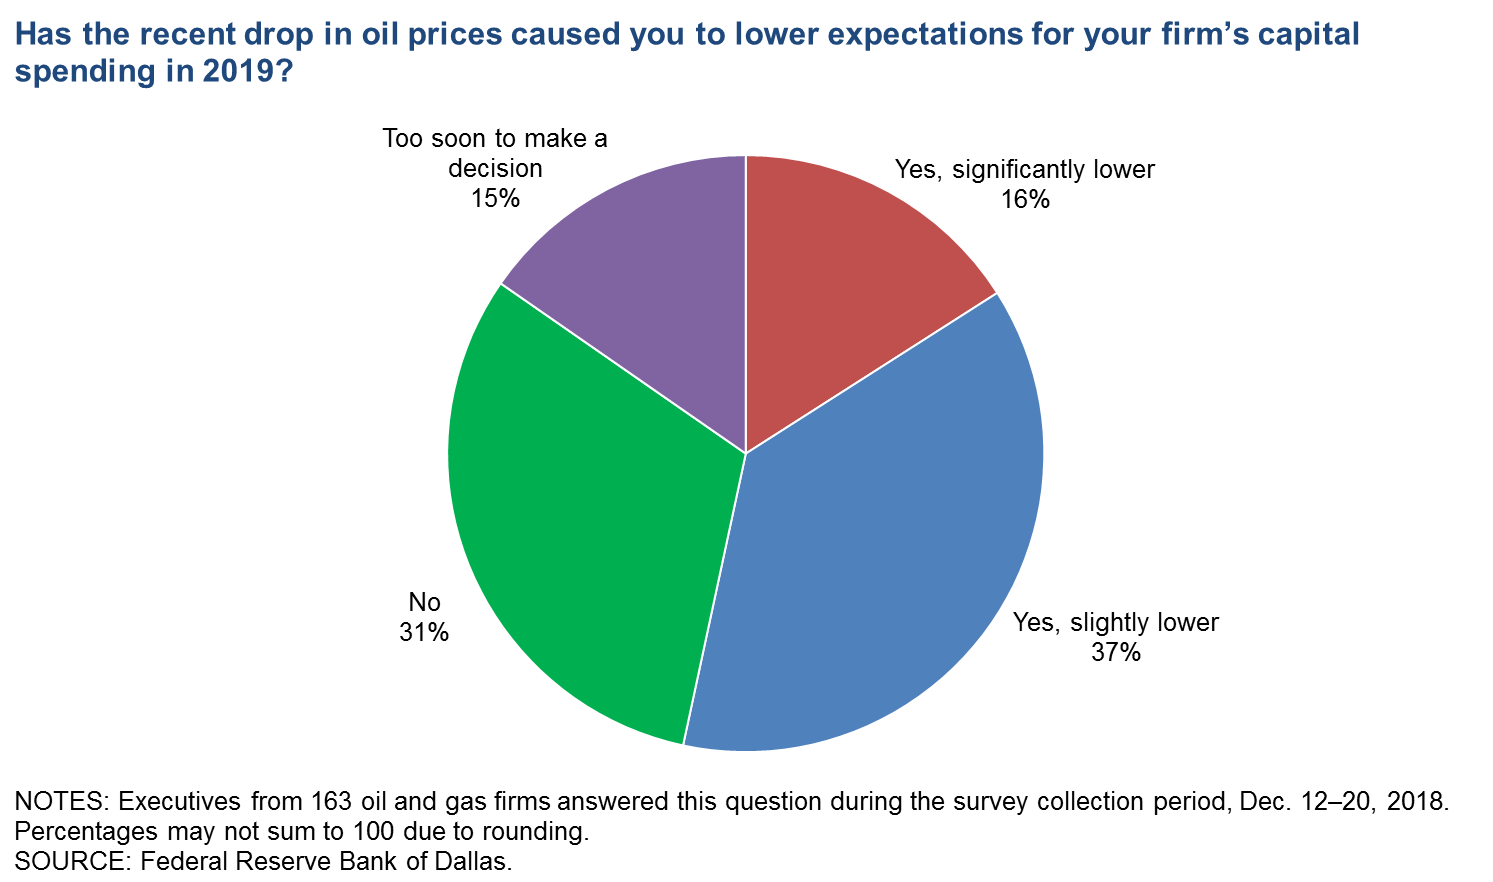
Has the recent drop in oil prices caused you to lower expectations for your firm’s capital spending in 2019?
Slightly more than half of the executives responding—53 percent—said the recent drop in oil prices caused them to lower expectations for capital spending in 2019. Of the 53 percent, 37 percent noted that they lowered their capital spending expectations slightly, while 16 percent said they lowered it significantly. Thirty-one percent noted no impact, while 15 percent noted that it was “too soon to make a decision.”
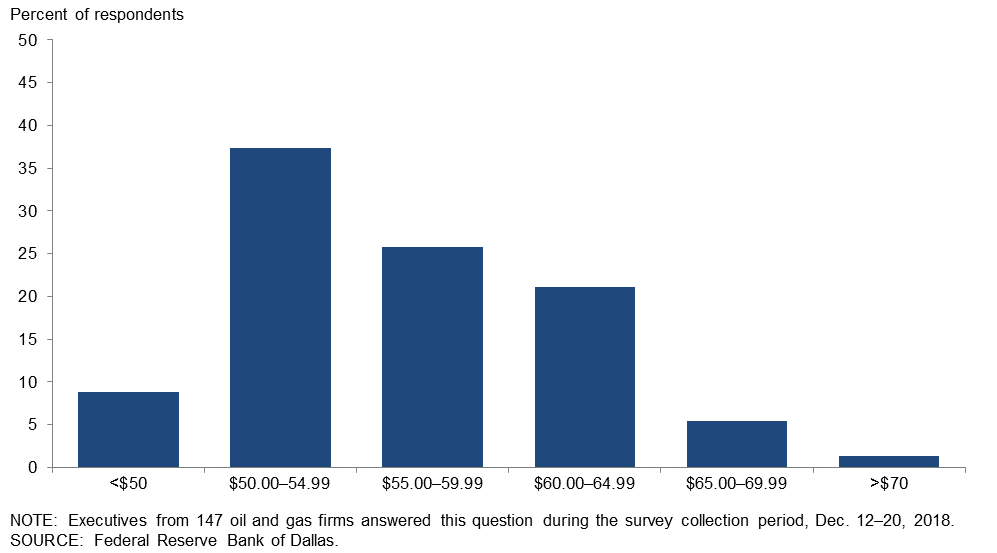
What West Texas Intermediate crude oil price is your firm using for capital planning in 2019?
For this special question, executives were asked to provide a specific price for WTI crude oil used for capital planning in 2019 at their firms. Prices averaged $54 per barrel, generally ranging from $50 to $64.99. Only 9 percent of responses were below $50.
Exploration and Production (E&P) Firms
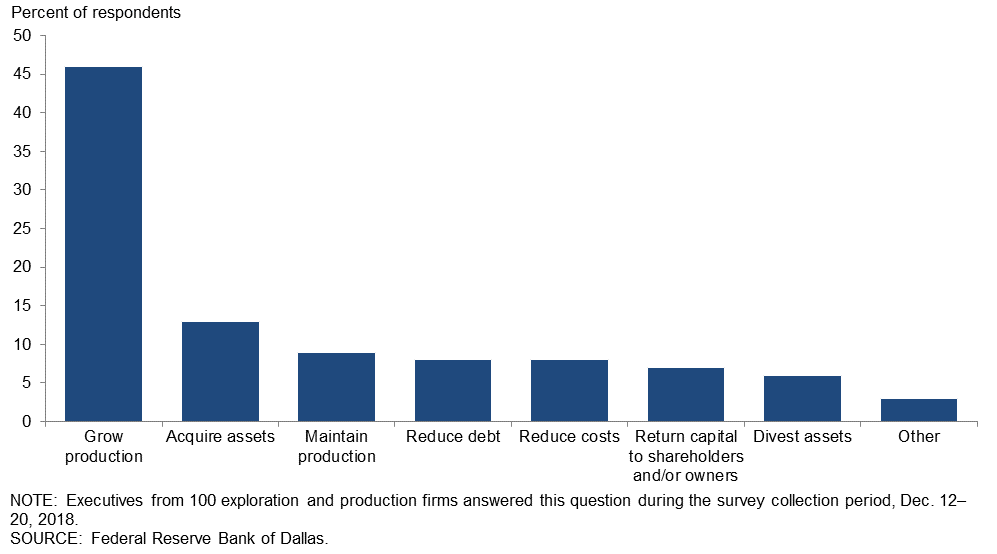
Which of the following is your firm’s primary goal in 2019?
Executives from E&P firms were presented with eight potential goals for 2019 and asked to select their firm’s primary one from the list. Forty-six percent of executives selected “grow production” as the primary goal in 2019. A total of 13 percent said “acquire assets” and 9 percent indicated “maintain production.”
Oilfield Services Firms
Has your firm’s operating margin in fourth quarter 2018 increased, decreased or remained unchanged compared with third quarter 2018?
When comparing fourth quarter 2018 to the third quarter, more executives from support services firms reported a decrease than an increase.
| Response | Percent |
| Increased | 20 |
| Decreased | 39 |
| Unchanged | 41 |
| NOTES: Executives from 59 oil and gas support services firms answered this question during the survey collection period, Dec. 12–20, 2018. Percentages may not sum to 100 due to rounding. SOURCE: Federal Reserve Bank of Dallas. | |
Has your firm’s operating margin in fourth quarter 2018 increased, decreased or remained unchanged compared with fourth quarter 2017?
When comparing fourth quarter 2018 to fourth quarter 2017, more executives from support services firms reported an increase than a decrease.
| Response | Percent |
| Increased | 47 |
| Decreased | 25 |
| Unchanged | 27 |
| NOTES: Executives from 59 oil and gas support services firms answered this question during the survey collection period, Dec. 12–20, 2018. Percentages may not sum to 100 due to rounding. SOURCE: Federal Reserve Bank of Dallas. |
|
Special Questions Comments
Exploration and Production Firms
- I can’t help but feel we are in for another extended period of low prices. The only way for me to survive is to quit spending money.
- I would encourage less interference in the markets so public equity would re-enter the sector. The result would be substantially more business activity and more domestic energy.
- Our primary goal is to continue with a robust capital program within free cash flow.
- Capital providers are likely to place more focus on discounted cash-flow analysis as compared to emphasis on balance-sheet increases (in the form of undeveloped reserves). I believe it is going to require $70 per barrel West Texas Intermediate (WTI) to justify continued development of unconventional reserves. Lifting costs of $40–$50 per barrel are needed to operate producing wells at a marginal profit, but sunk capital (i.e., leasehold acquisition) costs and administrative overhead costs are real costs as well, and those costs require an additional $10–$20 per barrel WTI price to result in marginal profitability.
- Just when the uncertainty related to our balance sheet was lifted, and our agreement with our large mineral owner was improved, oil prices tumbled to cast a cloud over our 2019 outlook. I do expect oil prices to rebound by the summer.
- This is beginning to look, and feel, like 2015 all over again. Wasn’t prorationing set up for events such as: realizing oil and gas prices are far below the market indices due to widened differentials and supply excess due to outsized shale production? I think we could use that again to support employment, state/county/local governments and bridge/road funding, and prevent wasting resources by putting a prorationing damper on what some would call “irrational exuberance” in production.
- We feel there will be some good buying opportunities of properties that have acreage which is held by production and development prospects.
- The volatility in the market continues to be due to the synthetic nature of supply. OPEC cutting production, Iran pumping more, Russia lying and the change in sanction implications all lead to a situation that makes it very difficult to plan and execute.
- We are a natural gas company, so the crude oil price does not significantly impact our business planning.
Oil and Gas Support Services Firms
- We are holding the line and hanging on.
- Just when the seismic business seemed to be gathering steam, we have a political reset in Mexico creating a full stop for onshore Mexico; Canadian differentials reaching ridiculous levels; and the price of WTI dropping to near $50. This is a reminder of how difficult this business is to navigate and plan long term.
- Service rates for our production services continue to be static and lower than in previous years. Most oil and gas companies continue to exert their will for cheaper services. The exceptions are those truly committed to profitable service providers and a safer workplace. Labor rates for drivers have skyrocketed, while trucking rates are also static.
- Of course, operating margins have decreased!
Fourth Quarter | January 3, 2019
Historical data are available from first quarter 2016 to the most current release quarter.
Business Indicators: Quarter/Quarter
| Business Indicators: All Firms Current Quarter (versus previous quarter) | |||||
| Indicator | Current Index | Previous Index | % Reporting Increase | % Reporting No Change | % Reporting Decrease |
Level of Business Activity | 2.3 | 43.3 | 26.3 | 49.7 | 24.0 |
Capital Expenditures | 8.9 | 35.3 | 31.7 | 45.5 | 22.8 |
Supplier Delivery Time | –3.7 | 8.5 | 5.6 | 85.2 | 9.3 |
Employment | 13.8 | 22.5 | 23.4 | 67.1 | 9.6 |
Employee Hours | 12.1 | 22.9 | 21.1 | 69.9 | 9.0 |
Wages and Benefits | 32.9 | 23.5 | 36.6 | 59.8 | 3.7 |
| Indicator | Current Index | Previous Index | % Reporting Improved | % Reporting No Change | % Reporting Worsened |
Company Outlook | –10.2 | 46.4 | 24.8 | 40.1 | 35.0 |
| Indicator | Current Index | Previous Index | % Reporting Increase | % Reporting No Change | % Reporting Decrease |
Uncertainty | 42.4 | 8.8 | 57.6 | 27.3 | 15.2 |
| Business Indicators: E&P Firms Current Quarter (versus previous quarter) | |||||
| Indicator | Current Index | Previous Index | % Reporting Increase | % Reporting No Change | % Reporting Decrease |
Level of Business Activity | 3.9 | 41.8 | 26.0 | 51.9 | 22.1 |
Oil Production | 29.1 | 34.8 | 46.6 | 35.9 | 17.5 |
Natural Gas Wellhead Production | 24.8 | 35.5 | 40.6 | 43.6 | 15.8 |
Capital Expenditures | 7.7 | 32.7 | 33.7 | 40.4 | 26.0 |
Expected Level of Capital Expenditures Next Year | 7.9 | 41.8 | 37.3 | 33.3 | 29.4 |
Supplier Delivery Time | –5.9 | 6.5 | 4.0 | 86.1 | 9.9 |
Employment | 11.5 | 17.4 | 20.2 | 71.2 | 8.7 |
Employee Hours | 7.7 | 12.8 | 14.4 | 78.8 | 6.7 |
Wages and Benefits | 32.6 | 17.5 | 35.6 | 61.4 | 3.0 |
Finding and Development Costs | 6.7 | 23.1 | 18.4 | 69.9 | 11.7 |
Lease Operating Expenses | 9.8 | 21.7 | 23.5 | 62.7 | 13.7 |
| Indicator | Current Index | Previous Index | % Reporting Improved | % Reporting No Change | % Reporting Worsened |
Company Outlook | –6.0 | 46.3 | 27.3 | 39.4 | 33.3 |
| Indicator | Current Index | Previous Index | % Reporting Increase | % Reporting No Change | % Reporting Decrease |
Uncertainty | 48.5 | 5.5 | 62.1 | 24.3 | 13.6 |
| Business Indicators: O&G Support Services Firms Current Quarter (versus previous quarter) | |||||
| Indicator | Current Index | Previous Index | % Reporting Increase | % Reporting No Change | % Reporting Decrease |
Level of Business Activity | 0.0 | 45.9 | 27.0 | 46.0 | 27.0 |
Utilization of Equipment | 1.6 | 44.8 | 25.8 | 50.0 | 24.2 |
Capital Expenditures | 11.1 | 40.0 | 28.6 | 54.0 | 17.5 |
Supplier Delivery Time | 0.0 | 11.8 | 8.2 | 83.6 | 8.2 |
Lag Time in Delivery of Firm's Services | –3.4 | 7.0 | 3.3 | 90.0 | 6.7 |
Employment | 17.5 | 31.7 | 28.6 | 60.3 | 11.1 |
Employment Hours | 19.4 | 41.0 | 32.3 | 54.8 | 12.9 |
Wages and Benefits | 33.3 | 34.5 | 38.1 | 57.1 | 4.8 |
Input Costs | 36.7 | 46.6 | 40.0 | 56.7 | 3.3 |
Prices Received for Services | 0.0 | 23.2 | 16.7 | 66.7 | 16.7 |
| Indicator | Current Index | Previous Index | % Reporting Improved | % Reporting No Change | % Reporting Worsened |
Company Outlook | –17.2 | 46.5 | 20.7 | 41.4 | 37.9 |
| Indicator | Current Index | Previous Index | % Reporting Increase | % Reporting No Change | % Reporting Decrease |
Uncertainty | 32.3 | 14.7 | 50.0 | 32.3 | 17.7 |
Business Indicators: Year/Year
| Business Indicators: All Firms Current Quarter (versus same quarter a year ago) | |||||
| Indicator | Current Index | Previous Index | % Reporting Increase | % Reporting No Change | % Reporting Decrease |
Level of Business Activity | 38.2 | 68.3 | 59.2 | 19.7 | 21.0 |
Capital Expenditures | 37.9 | 58.6 | 55.8 | 26.3 | 17.9 |
Supplier Delivery Time | 4.6 | 19.5 | 18.4 | 67.8 | 13.8 |
Employment | 24.5 | 35.6 | 41.3 | 41.9 | 16.8 |
Employee Hours | 24.4 | 38.5 | 35.3 | 53.8 | 10.9 |
Wages and Benefits | 55.8 | 50.0 | 60.9 | 34.0 | 5.1 |
| Indicator | Current Index | Previous Index | % Reporting Improved | % Reporting No Change | % Reporting Worsened |
Company Outlook | 21.0 | 68.9 | 46.2 | 28.7 | 25.2 |
| Business Indicators: E&P Firms Current Quarter (versus same quarter a year ago) | |||||
| Indicator | Current Index | Previous Index | % Reporting Increase | % Reporting No Change | % Reporting Decrease |
Level of Business Activity | 34.0 | 59.9 | 56.7 | 20.6 | 22.7 |
Oil Production | 42.1 | 49.0 | 63.2 | 15.8 | 21.1 |
Natural Gas Wellhead Production | 33.7 | 45.2 | 50.0 | 33.7 | 16.3 |
Capital Expenditures | 35.1 | 57.2 | 56.7 | 21.6 | 21.6 |
Expected Level of Capital Expenditures Next Year | 17.9 | 56.1 | 45.3 | 27.4 | 27.4 |
Supplier Delivery Time | 0.0 | 14.5 | 11.7 | 76.6 | 11.7 |
Employment | 15.8 | 22.6 | 33.7 | 48.4 | 17.9 |
Employee Hours | 12.4 | 22.8 | 23.7 | 64.9 | 11.3 |
Wages and Benefits | 58.4 | 42.8 | 61.5 | 35.4 | 3.1 |
Finding and Development Costs | 19.8 | 38.5 | 32.3 | 55.2 | 12.5 |
Lease Operating Expenses | 28.7 | 30.7 | 40.4 | 47.9 | 11.7 |
| Indicator | Current Index | Previous Index | % Reporting Improved | % Reporting No Change | % Reporting Worsened |
Company Outlook | 16.0 | 63.0 | 44.7 | 26.6 | 28.7 |
| Business Indicators: O&G Support Services Firms Current Quarter (versus same quarter a year ago) | |||||
| Indicator | Current Index | Previous Index | % Reporting Increase | % Reporting No Change | % Reporting Decrease |
Level of Business Activity | 45.0 | 84.2 | 63.3 | 18.3 | 18.3 |
Utilization of Equipment | 40.6 | 74.6 | 54.2 | 32.2 | 13.6 |
Capital Expenditures | 42.3 | 61.4 | 54.2 | 33.9 | 11.9 |
Supplier Delivery Time | 12.1 | 28.6 | 29.3 | 53.4 | 17.2 |
Lag Time in Delivery of Firm's Services | 9.0 | 30.9 | 17.9 | 73.2 | 8.9 |
Employment | 38.3 | 59.6 | 53.3 | 31.7 | 15.0 |
Employment Hours | 44.0 | 67.9 | 54.2 | 35.6 | 10.2 |
Wages and Benefits | 51.7 | 63.2 | 60.0 | 31.7 | 8.3 |
Input Costs | 48.3 | 67.9 | 55.4 | 37.5 | 7.1 |
Prices Received for Services | 34.5 | 45.3 | 50.9 | 32.7 | 16.4 |
| Indicator | Current Index | Previous Index | % Reporting Improved | % Reporting No Change | % Reporting Worsened |
Company Outlook | 30.6 | 80.4 | 49.0 | 32.7 | 18.4 |
Fourth Quarter | January 3, 2019
Activity Chart
Fourth Quarter | January 3, 2019
Comments from Survey Respondents
These comments are from respondents’ completed surveys and have been edited for publication. Comments from the Special Questions survey can be found below the special questions.
Exploration and Production Firms
- Between the Permian differential and the decline in the WTI price, we have revised our capital expenditure budget and will watch markets closely over the first quarter to determine if cuts are necessary.
- The administration’s head fake with the Saudis regarding Iran sanctions, followed by leverage on Saudi Arabia with the Khashoggi murder, has compromised oil price market dynamics. The volatility in commodity and capital markets is unsettling, along with the challenge to the administration’s ongoing leadership posed by the Democratic majority in the House. The administration is our largest uncertainty in our business at this point, as they want low oil prices and will do everything in their power to deliver low oil prices.
- The biggest distraction to conducting business is the uncertainty provided by the erratic and dysfunctional behavior of the current presidential administration.
- Uncertainty around the price of crude oil has hurt our attitude moving forward.
- The Midland/Cushing crude oil price differential is the most disturbing element of our current internal model. The editor of Oil & Gas Investor magazine said it well when he said that no one has their oil production currently constrained even though the differential is abnormally and extraordinarily high. The driver of the current blown-out differential is entirely based on speculators. Regulators should be investigating this situation.
- We are currently seeing 25 percent price reductions in pressure pumping, quarter over quarter.
- Product differentials from indices are widening and painful. We are starting to see some operating companies and service companies suffering from attrition losses after layoffs and retirements. “Newbies” have freshly minted degrees and don’t know “squat” yet but are getting paid as if they do. It’s hard to get a phone call returned anymore. Inaccurate delivery of mail (incoming checks) by the U.S. Postal Service is impacting us on the revenue side, but also we are hearing from our partners and operators that they are not receiving important documents and payments from us due to lost mail issues in other recipient cities.
- It was hard for me to look past $65-per-barrel West Texas Intermediate (WTI), even when the price pushed the mid-$70s, because of the ease to create supply from the unconventional basins. That said, I didn’t think we would see mid-$40s as I thought both better capital discipline in U.S. companies and a stronger desire by exporting nations to maintain a floor would hold a supply/demand balance to keep prices around $60 per barrel. Seeing this pullback obviously creates uncertainty, although it is a little more difficult to make a huge adjustment to our capital program offshore with the level of pre-planning involved. Let’s hope the exporting nations stay focused on maintaining a floor.
- New pipelines from the Permian to the Gulf Coast will be a game changer.
- Relying upon the Saudis and Russians to run a profitable oil company is not a winning strategy. There will be many consolidations in the shale plays to kick off 2019, and there will be major write-downs of reserves. Conventional plays will be a flavor of the day for investors.
- Uncertainty has increased.
- I expect the dramatic, unexpected and significant drop in oil prices will significantly decrease revenue for the first half of 2019. I intend to mitigate this by stopping all drilling and deferring any new projects.
- The “in and out” from the list of producing countries and quantities of deliverable crude is such that an educated guess is about all that can be offered in terms of the price of crude oil. Consumption will obviously continue to increase on some level as a function of global business/production and implicit expansion of certain national economies—but with, and subject to, a very pronounced issue of who will be the producers. The world climate suggests that the potential for regional conflict is at least as pronounced now as last year at this time.
- Oil should be taxed to provide for infrastructure construction and improvements of roads. It should also be taxed to partially reduce the use of gasoline, which creates more pollution compared to natural gas or electrical power for automobiles, trucks and other forms of transportation.
- It feels like the capital markets (equity and debt) are backing up fairly hard, which will have a noted impact on capital spending if sustained. Coupled with the fall in oil prices in the past six weeks, this could cause 2019 plans to get pared back.
- We are buying old existing production from public companies that are focused on the flavor of the month, which is horizontal plays.
- Commodity price volatility is of concern and hampers planning. Material price increases, especially tubular goods, are driving higher development costs.
- The November 2018 oil price decline, if it lasts longer, will affect our 2019 budget forecast. A recession worldwide, as forecasted by quite a few, could also negatively affect our budget for 2019.
- We are cutting back capital to unconventional resources and increasing capital to exploration for conventional.
- We see oil prices down for 60–120 days. Then, oil will be back up to $60 to $65 per barrel.
- Pipeline constraints are costing me; I’m ready for this to be over.
- Near-term price uncertainty has made us more cautious going into 2019, which will result in a cutback in capital expenditures.
- Crude prices cure crude prices on the high side as well as the low side.
Oil and Gas Support Services Firms
- Regarding the increased uncertainty, while most media are focusing on supply issues (OPEC, Russia, U.S.), we are most concerned about demand, particularly in Asia, which seems impossible to predict or even analyze.
- We saw a significant slowdown in the fourth quarter due to a number of factors. The Permian takeaway capacity for oil and gas caused a significant slowdown in well completions. We have also seen budget-related activity reductions in other basins. Many E&P companies spent their 2018 budget by the end of the third quarter (higher services prices, better completion efficiency, etc.). We expect first quarter to improve, but with oil prices in the low $50s per barrel, business is not expected to be as robust as originally budgeted. A bright spot is natural gas prices, but this has a limited impact in some markets due to pipeline constraints. While NYMEX Henry Hub natural gas is priced at $4.50 per million British thermal units, there are Permian operators paying pipelines to take their gas rather than flare it due to constraints. It seems that the most important factor for E&P companies drilling for natural gas is location, location, location.
- There is no certainty about 2019 with respect to crude pricing.
- The lack of clarity regarding E&P capital expenditure plans is creating uncertainty about fiscal year 2019 activity for upstream E&P spending.
- The Fed is hurting our outlook. Increased interest rates are hurting or defeating any expansion and/or drilling plans.
- We’re still busy and thankful! Experienced landmen are working. East Texas is doing well, so I have moved operations to East Texas.
- The blow to confidence is due to the recent dramatic fall in crude oil prices, which will have a negative impact on E&P spending in 2019.
- The fourth-quarter activity decrease is expected to reverse by the end of first quarter 2019 and is driven by E&P company spending.
- Exploration companies dialed back at the end of the year due to the significant drop in oil prices. Several seismic deals with private equity funding have been pushed into 2019 as this commodity price uncertainty has slowed (but hopefully not killed) investment and has forced delays in spending until our customers have more clarity in the direction of oil prices. This is a classic example of why budgeting is very tricky in the oil services sector.
Questions regarding the Dallas Fed Energy Survey can be addressed to Michael Plante at Michael.Plante@dal.frb.org or Kunal Patel at Kunal.Patel@dal.frb.org.
Sign up for our email alert to be automatically notified as soon as the latest Dallas Fed Energy Survey is released on the web.