Dallas Fed Energy Survey

Second Quarter | June 26, 2019
Oil and Gas Activity Flat amid Surging Uncertainty and Increasingly Pessimistic Outlooks
What’s New This Quarter
Special questions this quarter focus on capital spending plan changes for 2019, cost inflation for completion services, and initiatives undertaken regarding water usage.
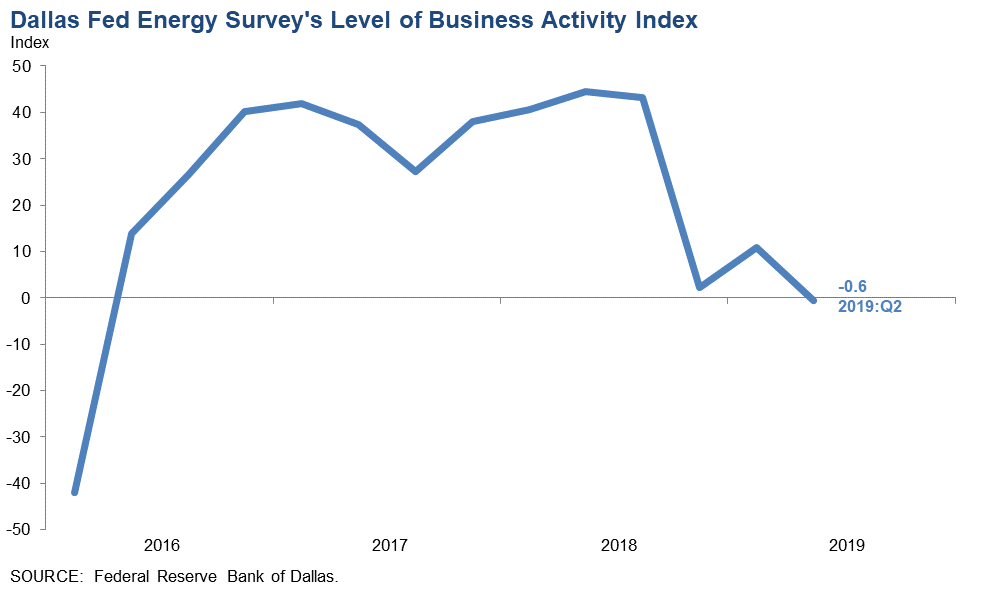
Activity in the oil and gas sector was flat in second quarter 2019 after three years of growth, according to oil and gas executives responding to the Dallas Fed Energy Survey. The business activity index—the survey’s broadest measure of conditions facing Eleventh District energy firms—fell to -0.6 in the second quarter, from 10.8 in the first quarter. The near-zero reading indicates activity levels were largely unchanged from the prior quarter. The second-quarter decline was driven by exploration and production (E&P) and oilfield services firms.
Positive survey readings generally indicate expansion; those below zero suggest contraction.
Oil and gas production increased for the 11th consecutive quarter, according to E&P executives. However, the oil production index indicated a slightly slower rate of growth, edging down from 21.1 in the first quarter to 17.4 in the second quarter. The natural gas production index also dipped, from 16.7 to 13.4. The index for capital expenditures fell from 5.0 in the first quarter to -6.1 in the second quarter, indicating a slight reduction in capital spending among E&P firms.
Among oilfield services firms, the equipment utilization index fell 13 points to 3.4 in the second quarter. Input costs continued rising, with the index inching higher, from 25.0 to 27.1. At the same time, the prices received for services index dipped further into negative territory, from -1.7 to -12.1, suggesting a steepening decline in oilfield services prices. The operating margins index fell sharply, from -6.6 to -32.8, indicating notably lower margins for oilfield services firms during the second quarter.
After remaining in positive territory for 10 straight quarters, the aggregate employment index dropped to -2.5 from 6.0, suggesting a turnabout for hiring in the quarter. Meanwhile, the aggregate employee hours worked index remained positive, but barely so, edging down from 9.7 to 3.1. The index for aggregate wages and benefits suggests moderating wage growth, as it retreated from 23.5 to 14.5.
The company outlook index, after returning to positive territory last quarter, was once again negative for the latest three months, falling 28 points to -4.5, pointing to more pessimism about future conditions. The decline in company outlooks this quarter was particularly prominent among oilfield services firms, where the index slumped 38 points to -15.7. The dimming outlooks coincided with a surge in uncertainty, as the aggregate uncertainty index jumped 31 points to 50, the highest level since the index was introduced in 2017.
On average, respondents expect West Texas Intermediate (WTI) oil prices will be $57.14 per barrel by year-end 2019, with responses ranging from $32 to $79 per barrel. Respondents expect Henry Hub natural gas prices to be $2.67 per million British thermal units (MMBtu) at year-end. For reference, WTI spot prices averaged $53.20 per barrel during the survey collection period, and Henry Hub spot prices averaged $2.42 per MMBtu.
Next release: September 25, 2019
|
Data were collected June 12–20, and 161 energy firms responded to the survey. Of the respondents, 101 were exploration and production firms and 60 were oilfield services firms. The Dallas Fed conducts the Dallas Fed Energy Survey quarterly to obtain a timely assessment of energy activity among oil and gas firms located or headquartered in the Eleventh District. Firms are asked whether business activity, employment, capital expenditures and other indicators increased, decreased or remained unchanged compared with the prior quarter and with the same quarter a year ago. Survey responses are used to calculate an index for each indicator. Each index is calculated by subtracting the percentage of respondents reporting a decrease from the percentage reporting an increase. When the share of firms reporting an increase exceeds the share reporting a decrease, the index will be greater than zero, suggesting the indicator has increased over the previous quarter. If the share of firms reporting a decrease exceeds the share reporting an increase, the index will be below zero, suggesting the indicator has decreased over the previous quarter. |
Second Quarter | June 26, 2019
Price Forecasts
West Texas Intermediate Crude
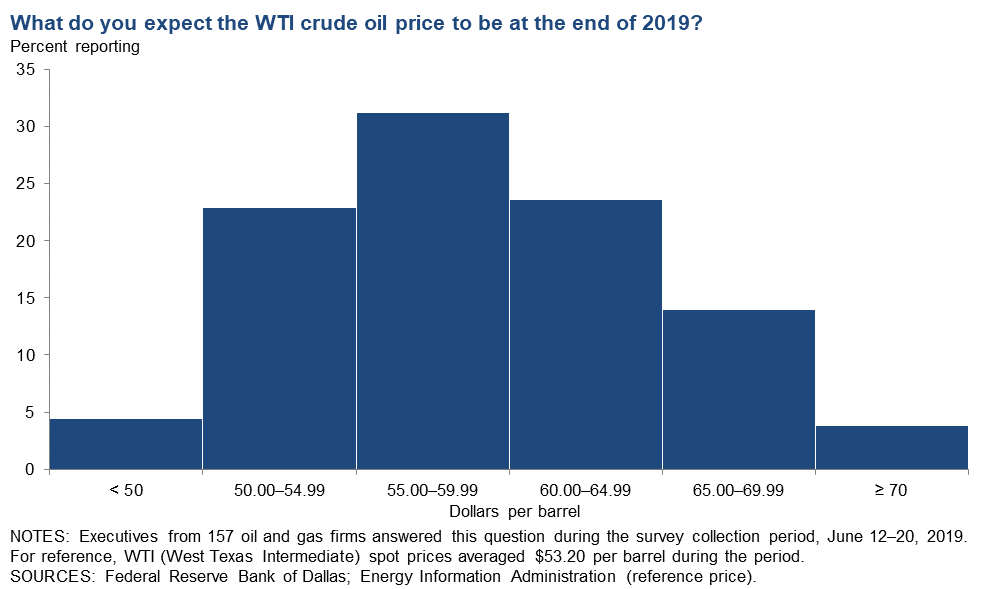
| West Texas Intermediate crude oil price (dollars per barrel), year-end 2019 | ||||
| Indicator | Survey Average | Low Forecast | High Forecast | Price During Survey |
Current quarter | $57.14 | $32.00 | $79.00 | $53.20 |
Prior quarter | $60.19 | $43.00 | $76.00 | $59.10 |
| NOTE: Price during survey is an average of daily spot prices during the survey collection period. SOURCES: Energy Information Administration; Federal Reserve Bank of Dallas | ||||
Henry Hub Natural Gas
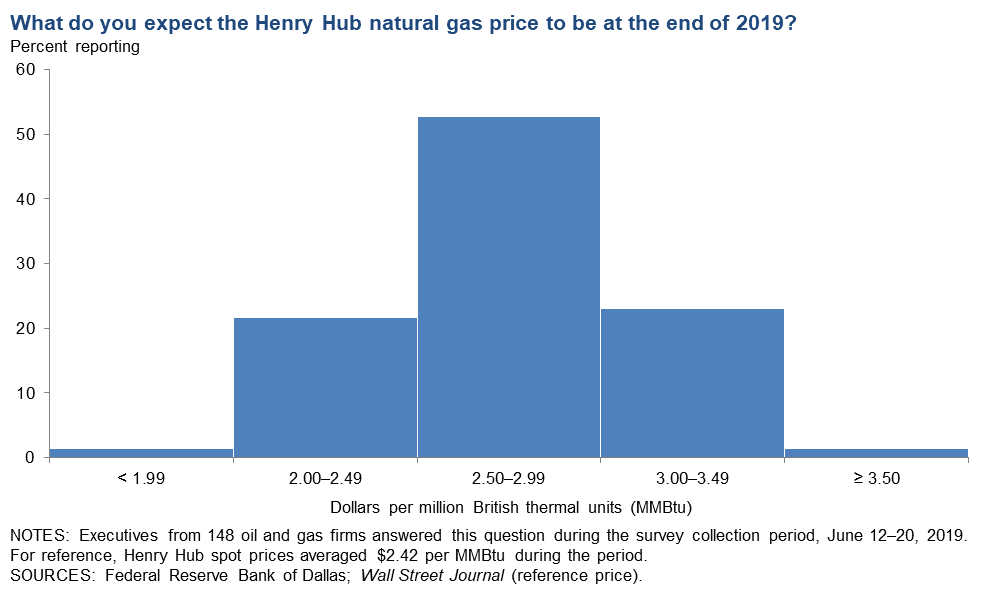
| Henry Hub natural gas price (dollars per MMBtu), year-end 2019 | ||||
| Indicator | Survey Average | Low Forecast | High Forecast | Price During Survey |
Current quarter | $2.67 | $1.75 | $4.00 | $2.42 |
Prior quarter | $2.96 | $2.15 | $5.00 | $2.89 |
| NOTE: Price during survey is an average of daily spot prices during the survey collection period. SOURCES: Energy Information Administration; Wall Street Journal. | ||||
Second Quarter | June 26, 2019
Special Questions
Data were collected June 12–20, and 155 oil and gas firms responded to the special questions survey.
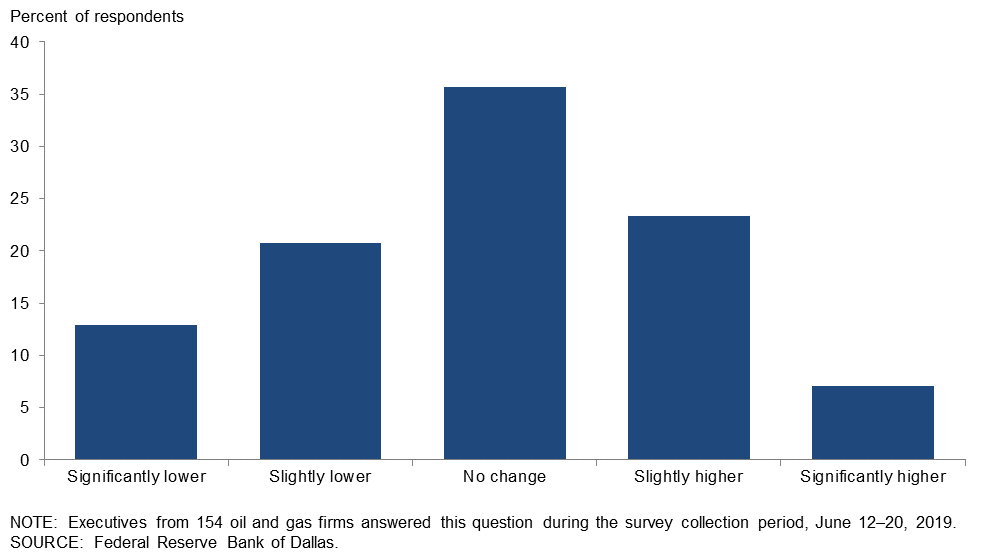
How does your firm’s capital spending budget for 2019 compare with what it was at the start of this year?
Responses of “No change” predominated, followed by ones indicating slight adjustment both higher and lower. Thirty-six percent of executives said their firm’s capital spending budget for 2019 was unchanged since the start of this year. Thirty-four percent reported lowering their spending plan, including 21 percent saying it is slightly lower and 13 percent saying significantly lower. Thirty percent reported an increase, including 23 percent of executives saying their budget is slightly higher and 7 percent saying it is significantly higher.
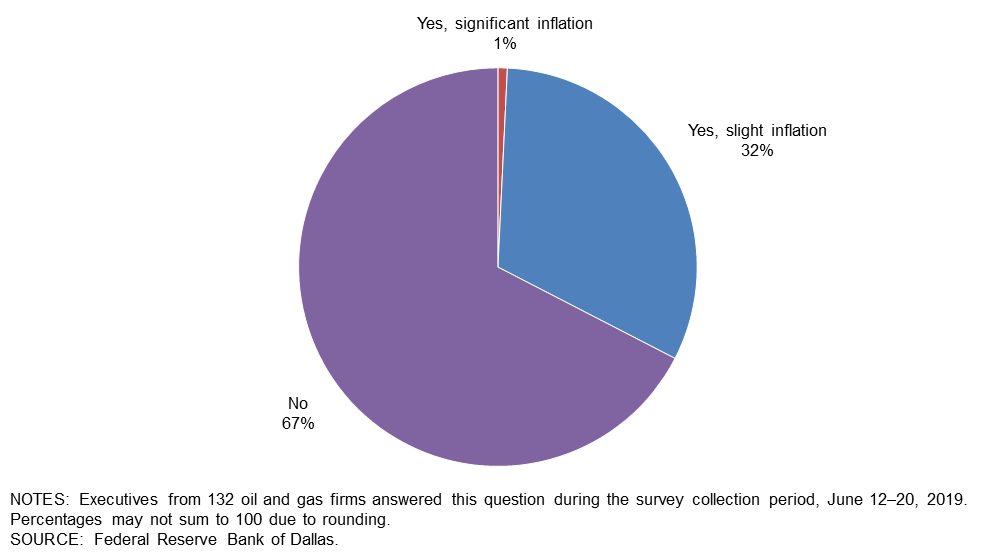
Do you expect cost inflation for completion services to pick up in the second half of 2019 and, if so, by how much?
The majority of the executives—67 percent—said that they don’t expect cost inflation for completion services to pick up in the second half of 2019. Thirty-two percent expect slight inflation, while 1 percent expects significant inflation.
Has your company undertaken any initiatives regarding water use/management? (Check all that apply.)
Roughly a quarter of respondents—26 percent—said they have invested in water infrastructure, while 16 percent stated they are involved in water recycling/reuse. Fifteen percent have worked with landowners or local governments to deal with water management issues, and 11 percent have instituted plans to reduce water use. Overall, a greater percentage of exploration and production firms—46 percent—have taken initiatives related to water management compared with 28 percent of service firms. (Details may be found in the table.)
| Response | Percent Reporting | ||
| All Firms | E&P | Services | |
| Invested in water infrastructure | 26 | 32 | 15 |
| Water recycling/reuse | 16 | 17 | 13 |
| Worked with landowners or local governments to deal with water management issues | 15 | 19 | 7 |
| Instituted plans to reduce water use | 11 | 13 | 7 |
| Other | 3 | 2 | 4 |
| We have not undertaken any initiatives related to water management | 61 | 54 | 72 |
| NOTE: Executives from 94 exploration and production firms and 54 oil and gas support services firms answered this question during the survey collection period, June 12–20, 2019. The “All Firms” column reports the percentage out of the total 148 responses. SOURCE: Federal Reserve Bank of Dallas. | |||
Special Questions Comments
Exploration and Production Firms
- We have always endeavored to operate responsibly and be respectful of the rights of our landowners, with an overall view to not waste and not have a detrimental impact on the land.
- Continued cost management is key for a sustainable enterprise and industry. It is quite easy to lose all the value that we have gained so far.
Additional Comments »
Second Quarter | June 26, 2019
Historical data are available from first quarter 2016 to the most current release quarter.
Business Indicators: Quarter/Quarter
| Business Indicators: All Firms Current Quarter (versus previous quarter) | |||||
| Indicator | Current Index | Previous Index | % Reporting Increase | % Reporting No Change | % Reporting Decrease |
Level of Business Activity | –0.6 | 10.8 | 24.2 | 50.9 | 24.8 |
Capital Expenditures | –3.1 | 6.7 | 22.8 | 51.3 | 25.9 |
Supplier Delivery Time | –2.6 | –0.6 | 5.1 | 87.2 | 7.7 |
Employment | –2.5 | 6.0 | 15.6 | 66.3 | 18.1 |
Employee Hours | 3.1 | 9.7 | 17.6 | 67.9 | 14.5 |
Wages and Benefits | 14.5 | 23.5 | 23.4 | 67.7 | 8.9 |
| Indicator | Current Index | Previous Index | % Reporting Improved | % Reporting No Change | % Reporting Worsened |
Company Outlook | –4.5 | 23.3 | 24.8 | 45.9 | 29.3 |
| Indicator | Current Index | Previous Index | % Reporting Increase | % Reporting No Change | % Reporting Decrease |
Uncertainty | 50.0 | 18.6 | 58.1 | 33.8 | 8.1 |
| Business Indicators: E&P Firms Current Quarter (versus previous quarter) | |||||
| Indicator | Current Index | Previous Index | % Reporting Increase | % Reporting No Change | % Reporting Decrease |
Level of Business Activity | –5.0 | 7.7 | 18.8 | 57.4 | 23.8 |
Oil Production | 17.4 | 21.1 | 42.9 | 31.6 | 25.5 |
Natural Gas Wellhead Production | 13.4 | 16.7 | 39.2 | 35.1 | 25.8 |
Capital Expenditures | –6.1 | 5.0 | 22.2 | 49.5 | 28.3 |
Expected Level of Capital Expenditures Next Year | 7.1 | 16.3 | 30.3 | 46.5 | 23.2 |
Supplier Delivery Time | –1.0 | –1.9 | 5.2 | 88.7 | 6.2 |
Employment | –5.0 | 1.0 | 15.0 | 65.0 | 20.0 |
Employee Hours | 5.1 | 5.8 | 16.2 | 72.7 | 11.1 |
Wages and Benefits | 13.0 | 23.1 | 22.0 | 69.0 | 9.0 |
Finding and Development Costs | 3.0 | –1.9 | 12.2 | 78.6 | 9.2 |
Lease Operating Expenses | 12.4 | 2.8 | 20.6 | 71.1 | 8.2 |
| Indicator | Current Index | Previous Index | % Reporting Improved | % Reporting No Change | % Reporting Worsened |
Company Outlook | 2.0 | 24.0 | 27.0 | 48.0 | 25.0 |
| Indicator | Current Index | Previous Index | % Reporting Increase | % Reporting No Change | % Reporting Decrease |
Uncertainty | 55.0 | 17.3 | 63.0 | 29.0 | 8.0 |
| Business Indicators: O&G Support Services Firms Current Quarter (versus previous quarter) | |||||
| Indicator | Current Index | Previous Index | % Reporting Increase | % Reporting No Change | % Reporting Decrease |
Level of Business Activity | 6.6 | 16.1 | 33.3 | 40.0 | 26.7 |
Utilization of Equipment | 3.4 | 16.4 | 30.5 | 42.4 | 27.1 |
Capital Expenditures | 1.7 | 9.7 | 23.7 | 54.2 | 22.0 |
Supplier Delivery Time | –5.1 | 1.7 | 5.1 | 84.7 | 10.2 |
Lag Time in Delivery of Firm's Services | –10.2 | 3.4 | 3.4 | 83.1 | 13.6 |
Employment | 1.7 | 14.5 | 16.7 | 68.3 | 15.0 |
Employment Hours | 0.0 | 16.4 | 20.0 | 60.0 | 20.0 |
Wages and Benefits | 17.3 | 24.1 | 25.9 | 65.5 | 8.6 |
Input Costs | 27.1 | 25.0 | 28.8 | 69.5 | 1.7 |
Prices Received for Services | –12.1 | –1.7 | 10.3 | 67.2 | 22.4 |
Operating Margin | –32.8 | –6.6 | 6.9 | 53.4 | 39.7 |
| Indicator | Current Index | Previous Index | % Reporting Improved | % Reporting No Change | % Reporting Worsened |
Company Outlook | –15.7 | 22.0 | 21.1 | 42.1 | 36.8 |
| Indicator | Current Index | Previous Index | % Reporting Increase | % Reporting No Change | % Reporting Decrease |
Uncertainty | 41.7 | 21.0 | 50.0 | 41.7 | 8.3 |
Business Indicators: Year/Year
| Business Indicators: All Firms Current Quarter (versus same quarter a year ago) | |||||
| Indicator | Current Index | Previous Index | % Reporting Increase | % Reporting No Change | % Reporting Decrease |
Level of Business Activity | 11.2 | 30.5 | 43.0 | 25.2 | 31.8 |
Capital Expenditures | 9.4 | 20.7 | 40.7 | 28.0 | 31.3 |
Supplier Delivery Time | –4.7 | 1.3 | 7.4 | 80.5 | 12.1 |
Employment | 12.5 | 19.7 | 30.9 | 50.7 | 18.4 |
Employee Hours | 10.6 | 23.4 | 26.5 | 57.6 | 15.9 |
Wages and Benefits | 34.8 | 39.0 | 43.4 | 48.0 | 8.6 |
| Indicator | Current Index | Previous Index | % Reporting Improved | % Reporting No Change | % Reporting Worsened |
Company Outlook | –0.7 | 28.3 | 35.4 | 28.5 | 36.1 |
| Business Indicators: E&P Firms Current Quarter (versus same quarter a year ago) | |||||
| Indicator | Current Index | Previous Index | % Reporting Increase | % Reporting No Change | % Reporting Decrease |
Level of Business Activity | 5.4 | 26.8 | 40.9 | 23.7 | 35.5 |
Oil Production | 23.3 | 39.2 | 51.1 | 21.1 | 27.8 |
Natural Gas Wellhead Production | 15.6 | 34.4 | 45.6 | 24.4 | 30.0 |
Capital Expenditures | 6.4 | 15.3 | 42.6 | 21.3 | 36.2 |
Expected Level of Capital Expenditures Next Year | 9.6 | 9.6 | 36.2 | 37.2 | 26.6 |
Supplier Delivery Time | –2.2 | 1.0 | 7.5 | 82.8 | 9.7 |
Employment | 7.3 | 6.2 | 28.4 | 50.5 | 21.1 |
Employee Hours | 9.5 | 13.3 | 22.3 | 64.9 | 12.8 |
Wages and Benefits | 30.5 | 32.7 | 40.0 | 50.5 | 9.5 |
Finding and Development Costs | 3.3 | 3.0 | 19.6 | 64.1 | 16.3 |
Lease Operating Expenses | 8.7 | 12.4 | 22.8 | 63.0 | 14.1 |
| Indicator | Current Index | Previous Index | % Reporting Improved | % Reporting No Change | % Reporting Worsened |
Company Outlook | 3.4 | 22.9 | 37.8 | 27.8 | 34.4 |
| Business Indicators: O&G Support Services Firms Current Quarter (versus same quarter a year ago) | |||||
| Indicator | Current Index | Previous Index | % Reporting Increase | % Reporting No Change | % Reporting Decrease |
Level of Business Activity | 20.7 | 36.8 | 46.6 | 27.6 | 25.9 |
Utilization of Equipment | 17.8 | 32.7 | 44.6 | 28.6 | 26.8 |
Capital Expenditures | 14.3 | 29.9 | 37.5 | 39.3 | 23.2 |
Supplier Delivery Time | –9.0 | 1.8 | 7.1 | 76.8 | 16.1 |
Lag Time in Delivery of Firm's Services | –8.9 | 7.3 | 5.4 | 80.4 | 14.3 |
Employment | 21.1 | 42.1 | 35.1 | 50.9 | 14.0 |
Employment Hours | 12.2 | 41.1 | 33.3 | 45.6 | 21.1 |
Wages and Benefits | 42.1 | 50.0 | 49.1 | 43.9 | 7.0 |
Input Costs | 36.9 | 40.0 | 43.9 | 49.1 | 7.0 |
Prices Received for Services | –8.8 | 21.8 | 17.5 | 56.1 | 26.3 |
Operating Margin | –22.9 | 17.0 | 17.5 | 42.1 | 40.4 |
| Indicator | Current Index | Previous Index | % Reporting Improved | % Reporting No Change | % Reporting Worsened |
Company Outlook | –7.4 | 37.7 | 31.5 | 29.6 | 38.9 |
Second Quarter | June 26, 2019
Activity Chart
Second Quarter | June 26, 2019
Comments from Survey Respondents
These comments are from respondents’ completed surveys and have been edited for publication. Comments from the Special Questions survey can be found below the special questions.
Exploration and Production (E&P) Firms
- We drill and produce from conventional oil and/or natural gas reservoirs. Unconventional producers have driven up the costs of leases and/or the dollar amount of bonus expectations from mineral owners. These expectations are slow to readjust. However, the biggest impact has been the rapid and accelerating lack of investor interest in both conventional and unconventional oil and gas. The securities of oil and gas companies now sell at a fraction of what they once commanded. Huge losses in these shares hamper new exploration. It looks like another round of bankruptcies and mergers.
- There is an article titled “Frackers Scrounge for Cash as Wall Street Closes Doors,” by Christopher M. Matthews and Rebecca Elliott, in the Wall Street Journal. It is very true that cash is drying up, and it is going to be hard to get financing to drill our wells.
- The erratic nature of energy prices makes it very hard to invest currently. It also makes hedging a very difficult decision.
- Credit availability from banks in the reserve-based lending structure has decreased, given their focus on leverage statistics beyond the covenant of 4.0 debt/LTM EBITDA [debt to last-12-months earnings before interest, tax, depreciation and amortization]. The banks don’t want to lend at leverage above 3.0 times debt/LTM EBITDA.
- Living within cash flow is essential today. While borrowing costs remain low, the appetite for expansion/exploitation has diminished to the point that investment is substantially curtailed.
- A qualified labor pool remains an issue, resulting in an increase in wages to retain personnel and service rates.
- Continued fluctuations in oil pricing have hampered the ability to forecast expectations. Accordingly, we are guarded about future capital expenditures and acquisitions.
- We had to shut-in a large natural gas field due to Waha Hub negative pricing.
- The big drop in the oil price, from the uncertainty in the Middle East, makes us concerned that oversupply is overtaking demand and we will see a further weakening in the price of oil. This will stop our company's capital investment as we cut spending to weather the coming storm.
- We are confining our “new” business to acquisition of existing production. From the day-to-day event-driven market price for crude, coupled with the perpetually growing production levels, there is little basis for engaging in “wishful” projections that ignore the reality of supply in excess of demand without apparent change in either component in the near or intermediate term. A reversal in the current supply/demand relationship will likely depend on the occurrence of an event or events that are less than desirable.
- Permian Basin overproduction continues to pull oil and gas prices down from index prices. We are now seeing Midcontinent gas prices sagging. The increase in Federal Reserve interest rates are cutting cash-flows. Industry decision-making is slowing and everybody is trying to delay spending. We need to start a conversation between industry and government about bringing back pro-rationing (daily production allowables and monthly market factors) again. Nobody’s generating free cash flow.
- Futures prices continue to decrease as expenses increase. We are experiencing very tough, and unpredictable, business conditions. I continue to maintain strict fiscal discipline and operate with the expectation that my revenue will be lower each month than the prior month. I am participating in drilling wells, but taking smaller interests, mainly just to support the pipeline of deal submittals I get to see. I am trying to hold costs and increase net revenue interest in all new projects undertaken.
- Tariffs are raising prices of steel and other services and are a disastrous tool of the current regime in Washington. Regulations also add to uncertainty in forward planning efforts. The Fed must remain independent of political strings and pressure.
- Pipeline constraints resulting in lower prices are having a huge impact on cash flow. We are getting between a $5 and $7 reduction in the price per barrel, which has been as high as $20 per barrel.
- We believe we are heading into a period of increased uncertainty due to global political pressures that will likely be enhanced by the U.S. presidential elections.
Oil and Gas Support Services Firms
- Wages continue to go up, while revenue rates are level at best. It’s a dog-eat-dog world, and the competition is fierce.
- The impact of low pipeline takeaway capacity impacted Permian Basin activity in first quarter 2019, and in the second quarter, we saw a further decline in activity as a result of a worsening outlook in the financial markets, plus the drop in oil and natural gas prices. The result is a very poor second quarter and a dismal outlook for the third quarter. If oil prices improve, we might see some improvement in the second half of 2019, but today our second-half forecast is between flat and down.
- E&P companies must come to the realization that service and input costs will begin increasing. Today’s service price levels cannot continue much longer before something cracks: quality, reliability, safety, etc. If that means pulling back on capital expenditures, then that’s what needs to happen.
- Global uncertainty combined with U.S. trade behavior is driving the market slowdown.
- Oilfield services are extremely competitive, and customer activity is being reduced daily, which compounds the worsening business environment.
- Clear signs of a slowing economy, lessening demand for hydrocarbons, and increasing investor sentiment away from hydrocarbons and U.S. shale continue to equate to a softening market. There are fears of a trade war without boundaries. There are many darkening clouds on the horizon at the moment.
- Political uncertainty seems to be affecting the price of crude. An increase in natural gas utilization seems to have no effect on price.
- Demand for onshore seismic data continues in a slow decline. There’s very little risk appetite from E&P companies, and every dollar seems precious.
- We see oversupply, oversupply and oversupply of both oil and gas; and lower demand because of the trade war and slowing economy in China. These factors mean lower oil prices and nearly worthless gas passing through the Waha natural gas hub.
- The cost and quality of health insurance is a major focus for our company.
- There’s an increase of oilfield services companies in the area, and major companies are signing contracts with big oilfield service companies and pushing small oilfield service companies out of the competition.
Questions regarding the Dallas Fed Energy Survey can be addressed to Michael Plante at Michael.Plante@dal.frb.org or Kunal Patel at Kunal.Patel@dal.frb.org.
Sign up for our email alert to be automatically notified as soon as the latest Dallas Fed Energy Survey is released on the web.