Dallas Fed Energy Survey

Second Quarter | June 24, 2020
Collapse in Oil and Gas Activity, Employment Deepens
What’s New This Quarter
Special questions this quarter focus on production shut-ins and curtailments, government assistance programs to the private sector, the outlook for both oilfield activity and global oil consumption, and the ability of firms to remain solvent over the next year.
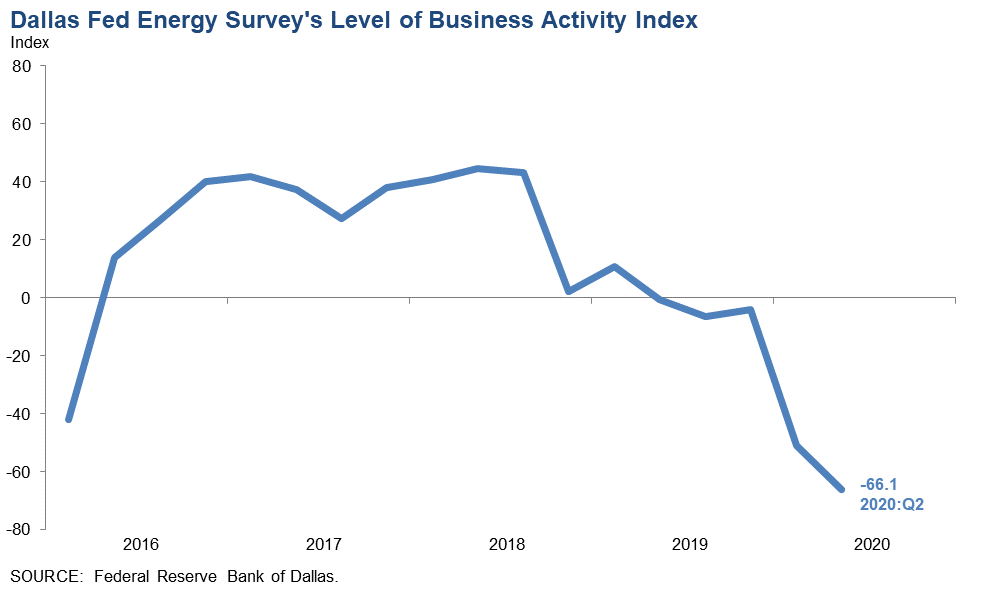
Activity in the oil and gas sector deteriorated further in second quarter 2020, according to oil and gas executives responding to the Dallas Fed Energy Survey. The business activity index—the survey’s broadest measure of conditions facing Eleventh District energy firms—fell from -50.9 in the first quarter to -66.1 in the second quarter. It was the lowest reading in the survey’s four-year history and indicative of significant contraction in activity. The business activity index for oilfield services firms plunged from -46.3 to -73.5, while the business activity index for exploration and production (E&P) firms fell from -53.3 to -62.6.
Production indexes suggest oil and gas production sank relative to the previous quarter. According to E&P executives, the oil production index declined sharply, falling 36 points to -62.6. The natural gas production index also fell significantly, from -21.2 to -47.8. The oil production index is at its lowest point in the survey’s four-year history.
The index for capital expenditures for E&P firms declined from -49.0 in the first quarter to -66.1 in the second, indicating a further reduction in capital spending. Additionally, the index for capital expenditures for oilfield services firms declined from -50.0 to -73.5.
Most indexes point to worsening conditions among oilfield services firms. The equipment utilization index fell from -47.2 in the first quarter to -69.2 in the second, a survey low. The operating margins index dropped from -50.0 to -68.6. While firms found relief as input costs collapsed—that index fell from -11.3 to -50.0—the index of prices received for services also slid further into negative territory, from -37.7 to -64.7.
The aggregate employment index posted a fifth consecutive negative reading, declining from -24.0 to -46.1, which suggests an acceleration in job cuts. Additionally, the aggregate employee hours worked index dropped from -32.1 to -47.0. The index for aggregate wages and benefits fell further into negative territory, from -8.2 to -41.7.
The company outlook index reading improved but remained deeply negative at -51.0 in the second quarter, indicating outlooks deteriorated. While uncertainty remained elevated, slightly fewer firms noted rising uncertainty this quarter than last, and the aggregate index fell 28 points to 35.7.
On average, respondents expect a West Texas Intermediate (WTI) oil price of $42.11 per barrel by year-end 2020, with responses ranging from $22 to $65 per barrel. Survey participants expect Henry Hub natural gas prices to be $2.15 per million British thermal units (MMBtu) by year-end. For reference, WTI spot prices averaged $37.75 per barrel during the survey collection period, and Henry Hub spot prices averaged $1.61 per MMBtu.
Next release: September 23, 2020
|
Data were collected June 10–18, and 168 energy firms responded. Of the respondents, 115 were exploration and production firms and 53 were oilfield services firms. The Dallas Fed conducts the Dallas Fed Energy Survey quarterly to obtain a timely assessment of energy activity among oil and gas firms located or headquartered in the Eleventh District. Firms are asked whether business activity, employment, capital expenditures and other indicators increased, decreased or remained unchanged compared with the prior quarter and with the same quarter a year ago. Survey responses are used to calculate an index for each indicator. Each index is calculated by subtracting the percentage of respondents reporting a decrease from the percentage reporting an increase. When the share of firms reporting an increase exceeds the share reporting a decrease, the index will be greater than zero, suggesting the indicator has increased over the previous quarter. If the share of firms reporting a decrease exceeds the share reporting an increase, the index will be below zero, suggesting the indicator has decreased over the previous quarter. |
Second Quarter | June 24, 2020
Price Forecasts
West Texas Intermediate Crude
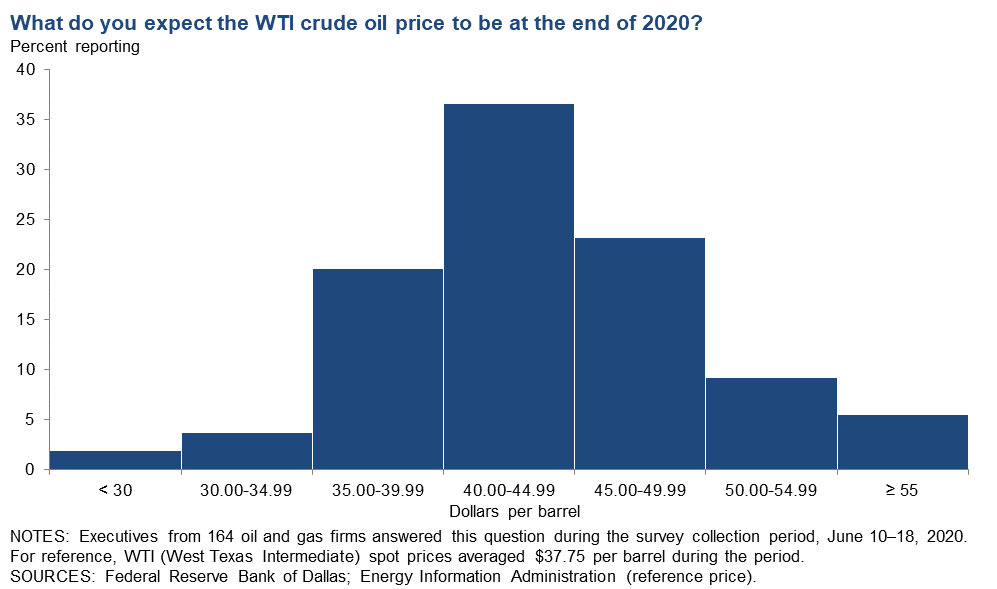
| West Texas Intermediate crude oil price (dollars per barrel), year-end 2020 | ||||
| Indicator | Survey Average | Low Forecast | High Forecast | Price During Survey |
Current quarter | $42.11 | $22.00 | $65.00 | $37.75 |
Prior quarter | $40.50 | $20.00 | $65.00 | $28.27 |
| NOTE: Price during survey is an average of daily spot prices during the survey collection period. SOURCES: Energy Information Administration; Federal Reserve Bank of Dallas. | ||||
Henry Hub Natural Gas
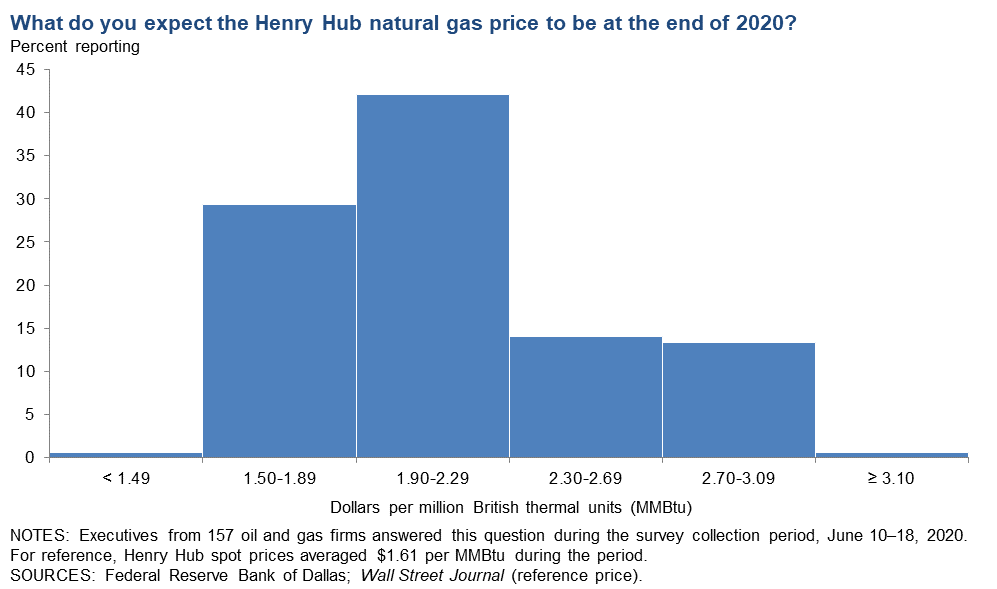
| Henry Hub natural gas price (dollars per MMBtu), year-end 2020 | ||||
| Indicator | Survey Average | Low Forecast | High Forecast | Price During Survey |
Current quarter | $2.15 | $1.25 | $3.50 | $1.61 |
Prior quarter | $2.03 | $0.97 | $4.00 | $1.84 |
| NOTE: Price during survey is an average of daily spot prices during the survey collection period. SOURCES: Federal Reserve Bank of Dallas; Wall Street Journal. | ||||
Second Quarter | June 24, 2020
Special Questions
Data were collected June 10–18; 165 oil and gas firms responded to the special questions survey.
Exploration and Production (E&P) Firms
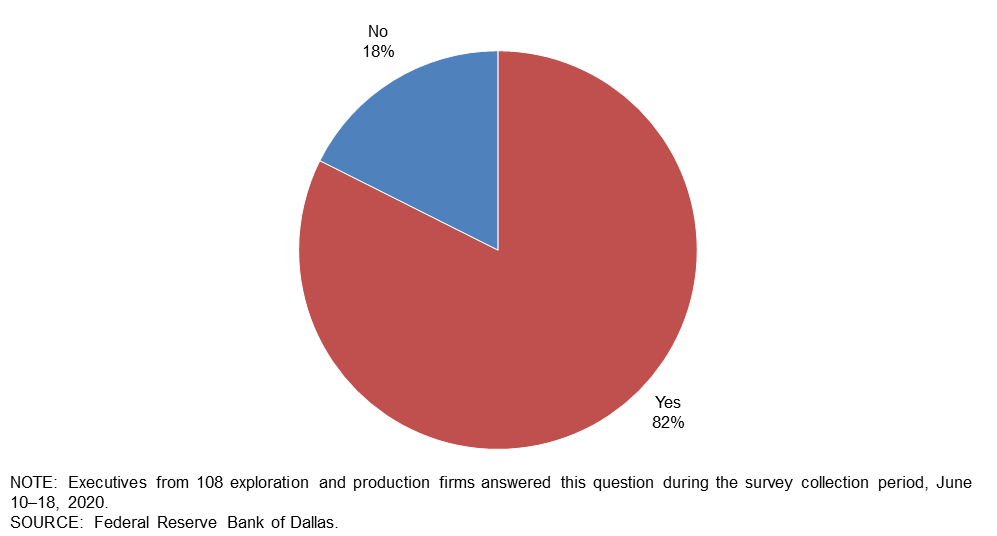
Did your firm shut in or curtail any production in the second quarter?
Eighty-two percent of E&P executives said their firm shut in or curtailed production in the second quarter. The remaining 18 percent did not shut in or curtail production.
If you shut in or curtailed any production, what was the primary reason driving that decision?
Of the firms that shut in or curtailed production, the majority of executives—94 percent—cited low wellhead prices as the primary reason driving that decision. Four percent of executives cited pipeline or refinery operators refusing to accept crude oil, and 1 percent noted that storage was unavailable.
| Reason | Percent of Respondents |
| Wellhead price too low | 94 |
| Pipeline or refinery refused to take oil | 4 |
| Storage not available | 1 |
| Other | 0 |
| NOTES: Executives from 89 exploration and production firms answered this question during the survey collection period, June 10–18, 2020. This question was only posed to executives who indicated that their firm shut in or curtailed any production in second quarter 2020. Percentages don't sum to 100 due to rounding. SOURCE: Federal Reserve Bank of Dallas. |
|
Does your firm still have any oil production shut in or curtailed as of now?
Of the firms that shut in or curtailed production in the second quarter, the majority—71 percent—still have some oil production shut in or curtailed. The remaining 29 percent have no oil production shut in or curtailed.
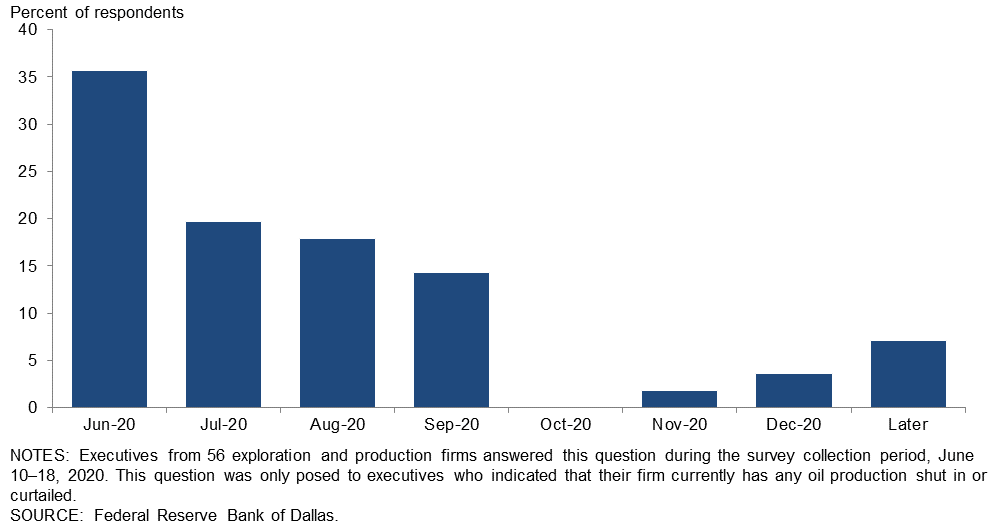
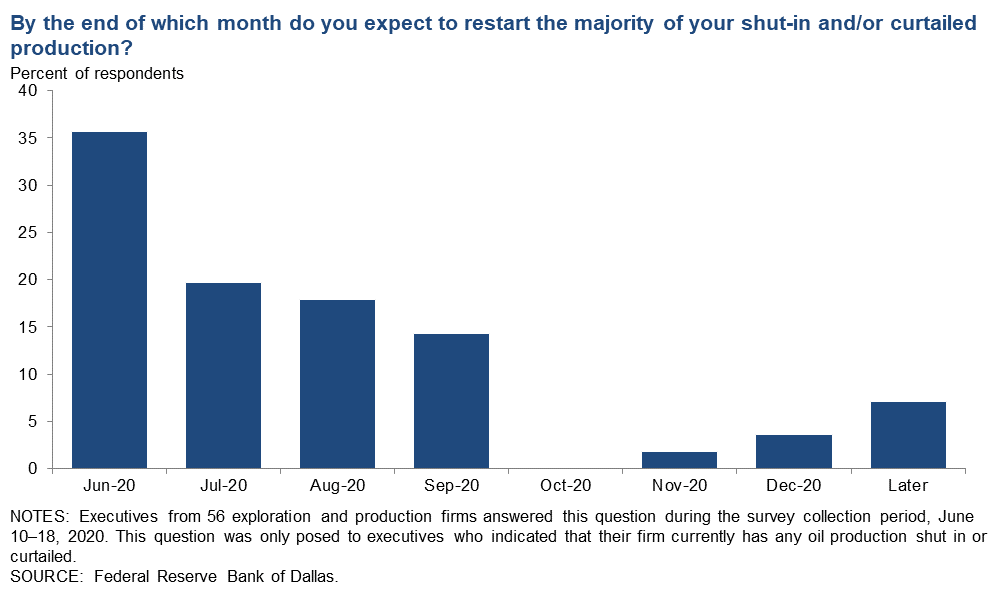
By the end of which month do you expect to restart the majority of your shut-in and/or curtailed production?
This question was posed to E&P executives whose firms still have production shut in and/or curtailed. Thirty-six percent said they expect to restart the majority of their shut-in and/or curtailed production in June 2020. Twenty percent expect to do so by July, 18 percent by August and 14 percent by September. The remaining 13 percent expect to put off restarting to November 2020 or later. (Percentages don’t sum to 100 due to rounding.)
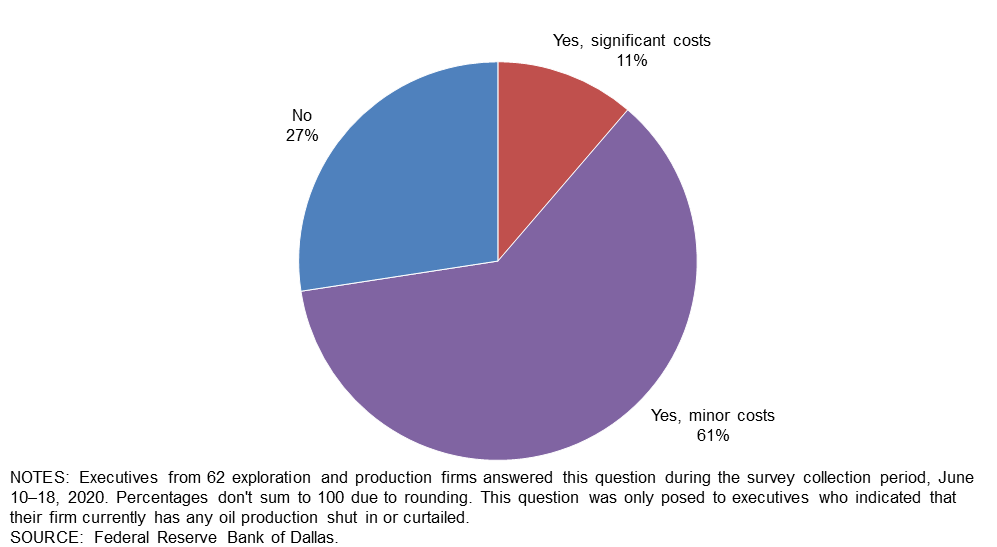
Do you expect extra costs when putting the wells back online?
This question was only posed to E&P executives whose firms still have production shut in and/or curtailed. More than half of executives—61 percent—expect minor costs when placing shut-in and/or curtailed wells back online. Twenty-seven percent anticipate no costs, while 11 percent expect significant costs. (Percentages don’t sum to 100 due to rounding.)
All Firms
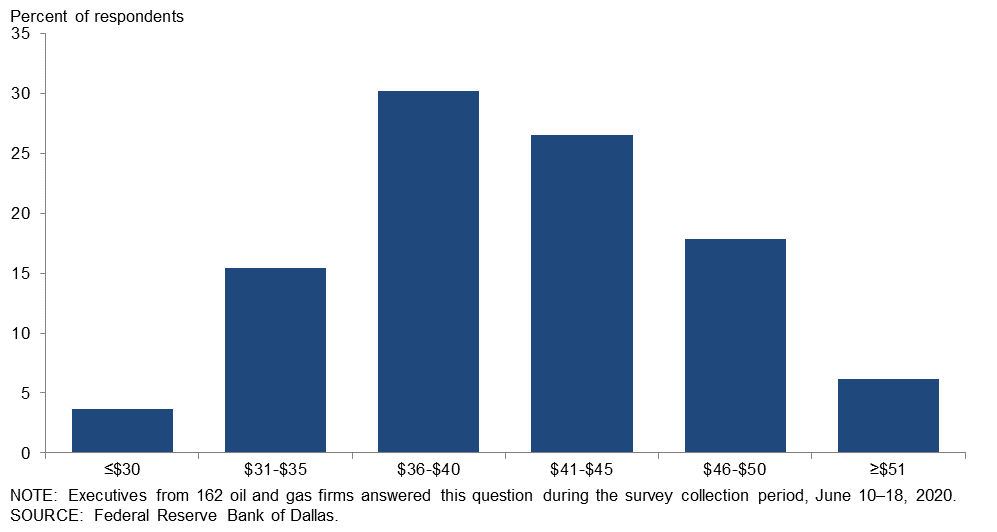
At what price do you expect the majority of producers in the U.S. to restart horizontal shut-in wells?
Thirty percent of executives said that they expect the majority of producers in the U.S. to restart horizontal shut-in wells if oil prices were $36 to $40 per barrel. Twenty-seven percent of executives anticipate that the majority of producers in the U.S. would restart horizontal shut-in wells if oil prices were between $41 and $45 per barrel. Nineteen percent believe firms would restart horizontal shut-in wells if prices were below $36 a barrel, while 24 percent believe firms would restart wells when prices are at or above $46.
Which of the following government assistance programs has your firm applied for? (Select all that apply.)
Executives were able to select more than one answer for this special question because firms could apply to more than one government assistance program if they met the requirements. Forty-nine percent of firms applied to the Small Business Administration (SBA) Paycheck Protection Program. Ten percent applied for the SBA Economic Injury Disaster Loan, 1 percent applied for SBA Express Bridge Loans, 2 percent applied to the Federal Reserve Main Street Lending Program and none applied to the SBA Debt Relief program. Forty-seven percent of firms didn’t apply to any government assistance program.
| Percent of Respondents | |
| Small Business Administration (SBA) Paycheck Protection Program | 49 |
| SBA Economic Injury Disaster Loan | 10 |
| Federal Reserve Main Street Lending | 2 |
| SBA Express Bridge Loans | 1 |
| SBA Debt Relief | 0 |
| None of the above | 47 |
| NOTE: Executives from 160 oil and gas firms answered this question during the survey collection period, June 10–18, 2020. SOURCE: Federal Reserve Bank of Dallas. |
|
If you applied, were you successful in accessing the program(s)?
This question was only posed to executives whose firms applied to government assistance program(s). Of the firms that applied, 89 percent successfully accessed program(s). Six percent were unable to access any program(s), and 4 percent were still waiting on a decision. One percent of firms were unsure of the status of their application.
| Percent of Respondents | |
| Yes | 89 |
| No | 6 |
| Still waiting on decision | 4 |
| Don't know | 1 |
| NOTE: Executives from 85 oil and gas firms answered this question during the survey collection period, June 10–18, 2020. SOURCE: Federal Reserve Bank of Dallas. |
|
Do you have any comments or thoughts on these programs that you would like to share with us?
Executives were able to write in a comment for this special question. A number highlighted how these governmental assistance programs allowed their company to avoid layoffs. Some expressed that the programs weren’t well-designed for the oil and gas industry because affiliation rules prevented private-equity-backed firms from participating in them. Still others highlighted issues in the implementation of the programs.
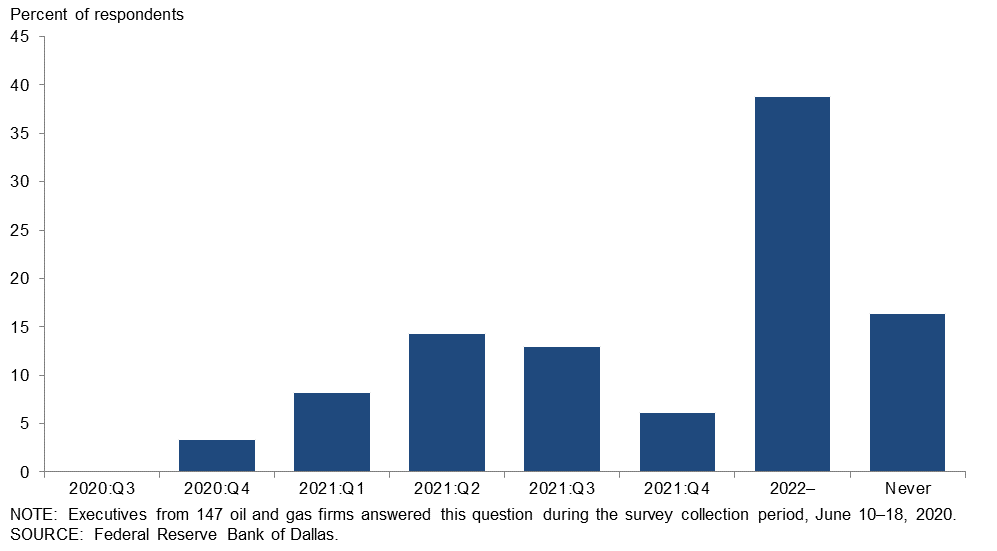
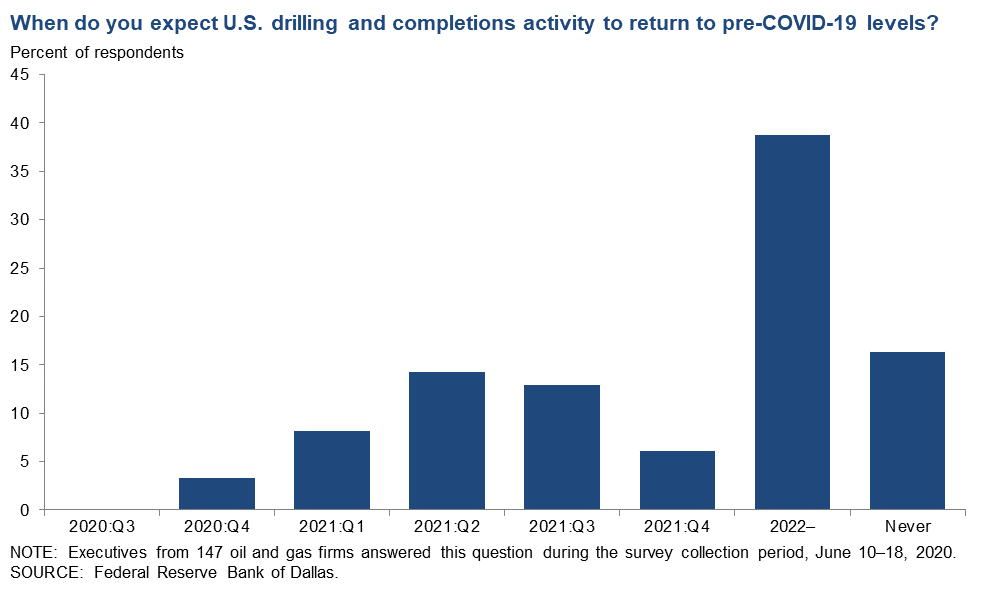
When do you expect U.S. drilling and completions activity to return to pre-COVID-19 levels?
Forty-one percent of executives expect drilling and completion activity to return to pre-COVID-19 levels sometime in 2021. Thirty-nine percent expect a return in 2022 or later, while 16 percent don’t foresee a return to prior levels. Three percent expect a return to pre-COVID-19 levels later in 2020. The chart below provides additional detail by quarter.
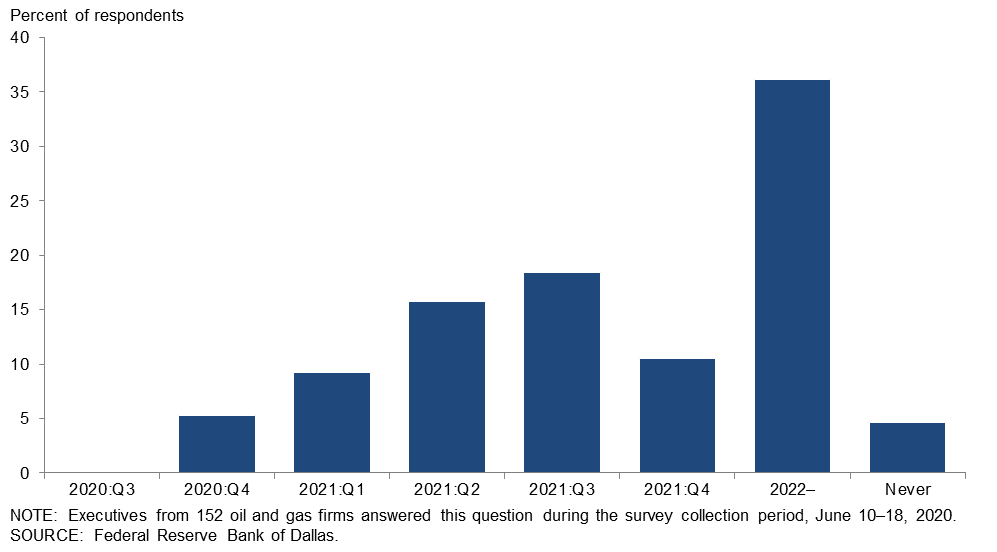
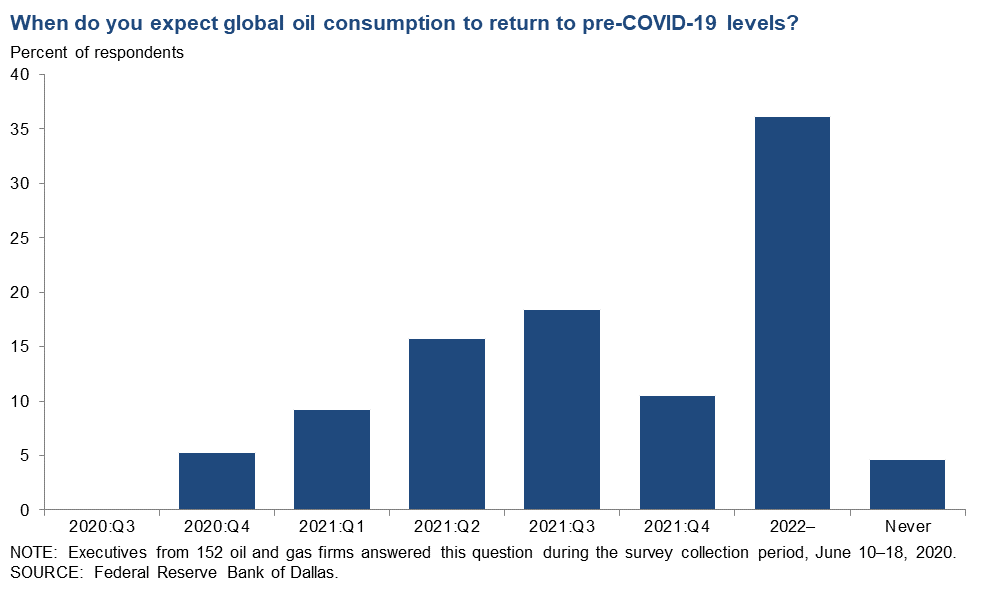
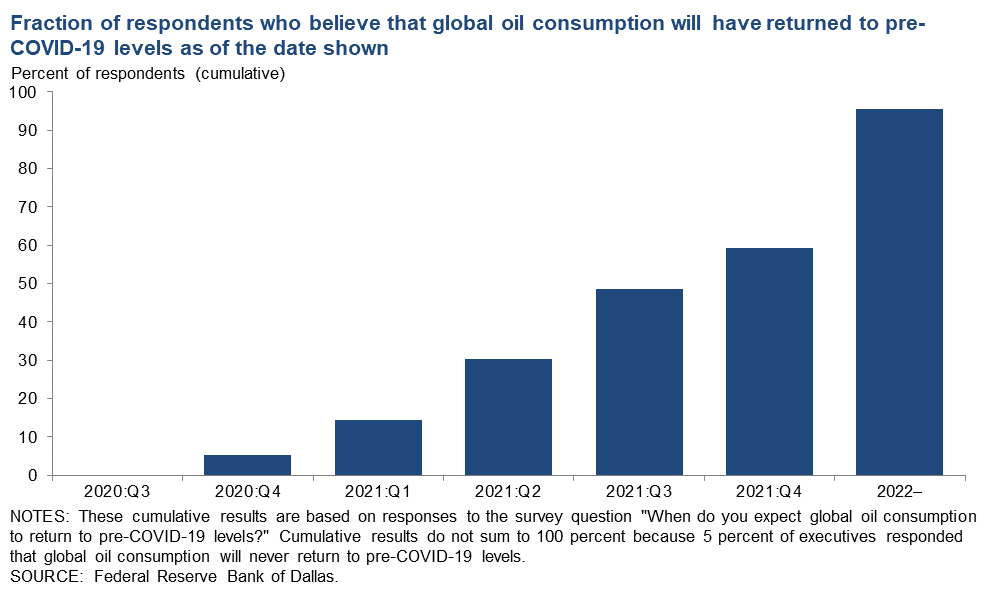
When do you expect global oil consumption to return to pre-COVID-19 levels?
Slightly more than half of executives—54 percent—expect global oil consumption to return to pre-COVID-19 levels sometime in 2021. The third quarter was the most-picked quarter in 2021 (18 percent). Thirty-six percent expect a return in 2022 or later, and 5 percent don’t foresee a return to prior levels. The remaining 5 percent expect a return to pre-COVID-19 levels later 2020.
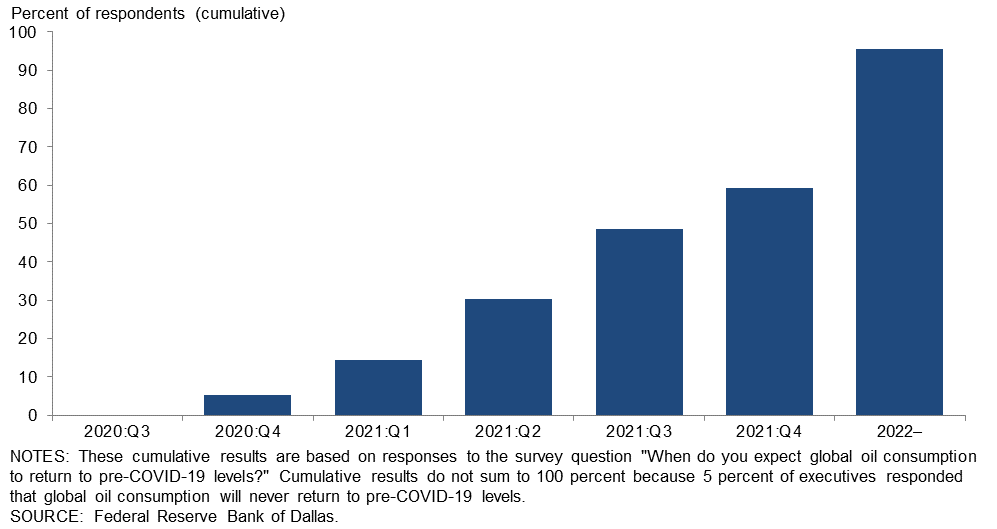
On a cumulative basis, 59 percent of executives expect global oil consumption to return to pre-COVID-19 levels by the end of 2021, and 95 percent of respondents expect it to return sometime by 2022 or later.
Fraction of respondents who believe that global oil consumption will have returned to pre-COVID-19 levels as of the date shown
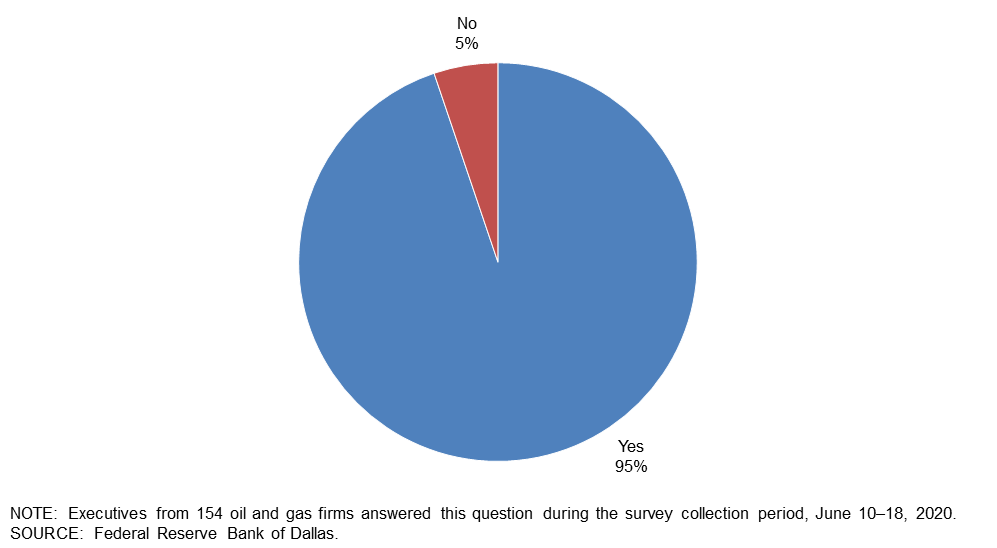
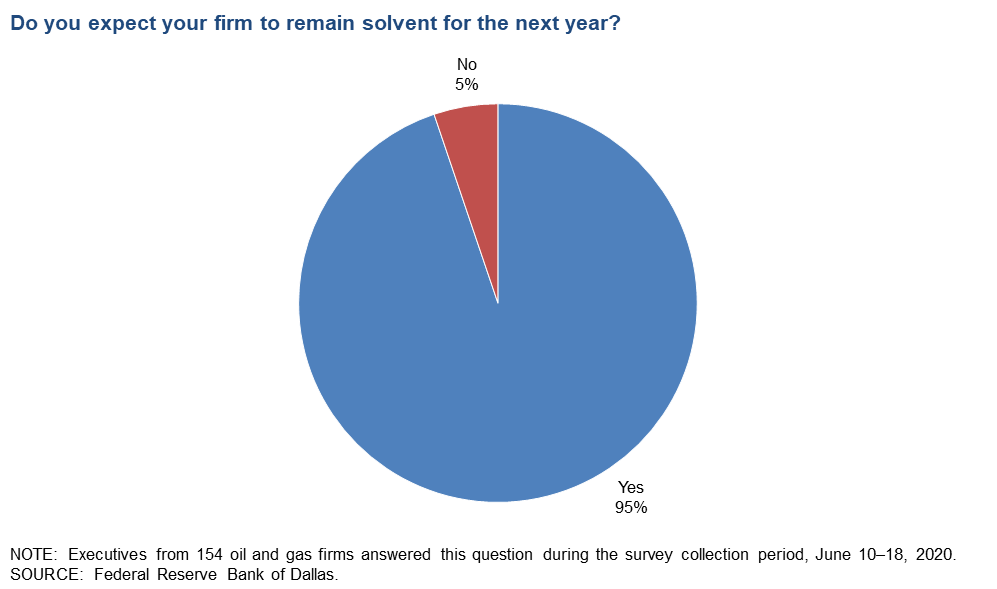
Do you expect your firm to remain solvent for the next year?
Almost all executives—95 percent—expect their firm to remain solvent for the next year. The remaining 5 percent said they anticipate being insolvent within the next year.
Special Questions Comments
Exploration and Production Firms
- We are a small company with the major advantage that we have no debt and are able to manage within our cash flow. Cash flow is down with shut-ins and prices, so we are not starting new projects, but we will survive to become active again when demand returns.
- I am anticipating that the COVID-19 pandemic is over by fourth quarter 2021, and that it is not followed by another pandemic.
- Collectively, producers in the oil industry are our own worst enemy. Instead of adapting and responding to market signals, we are constantly managing unmanageable levels of debt. This drives irrational decisions that over the long haul are detrimental to the economic health of the oil and gas industry.
- This downturn will weed out a lot of shale players who were effective "money changers" who took willing investors and Wall Street for a "churning" experience in shale over the last five years or so. Hopefully, real money might begin to look at real projects that make a real return on investment as we move forward. I am much less optimistic looking forward because of the extreme mismanagement by the Republicans in Washington.
- This is a summary timeline for the E&P [exploration and production] industry. First, it was dismal during the "lockdown." Second, it is/will be miserable during the "transition" (June–December 2020). Third, it will be somber in the “new normal” (2021). The oil industry went in a deep hole in first quarter 2020. We reached the bottom, and now we are trying to climb up. It will be quite a while (2022+) to get back up the hole to the pre-COVID-19 level of activity and service pricing.
- With the "Great Crew Change" retirement of "boomers," and COVID-19 work-at-home isolation, the industry is depopulating itself of knowledgeable and experienced personnel. That collective knowledge drain is not being effectively replaced by "newbies." The newer younger employees don't know much, and while they can stare at computers and run applications, they are making critical land, legal, financial and business errors at an astonishing rate but try to self-buffer from the real world impact of their errors with mental Maginot Lines of mercurial ego! I'm seeing this happen more and more frequently with contractors, purchasers, operators and business-partner companies. It's causing everything in this industry to move at a glacial pace because so many errors and problems have to be reported to a knowledgeable supervisor somewhere who can then give some one-on-one "counseling" to the error-creator who tries to defend their error to the company who reported it in the first place. We wind up having to write more memos and e-mails or make phone calls to a voice-message recorder than ever before just to keep basic functions moving that used to be routine and automatic.
- I am a professional geologist and independent producer who has been involved in the oil and gas business for almost 50 years, and I have never experienced an environment such as what we are living through today. The sustainable investing (no carbon) position of many large Wall Street firms casts a long shadow on the capital-intensive petroleum industry. In my view, we will need transportation fuels and chemicals for the foreseeable future. This is even though electric cars will overtake internal combustion engine cars within the next 20 years.
- A Joe Biden presidency will inflict additional damage to the oil and gas industry.
- We are well-positioned to weather this environment given our low-leverage, dynamic hedging program and flexibility as an operator.
- My answer to the question around when we expect to restart shut-in wells was "don't know" because it's really based on what oil prices will be next month, and so on. One thing for sure is it is not a date-driven decision whether to turn back on production that has been shut in, and that it is all driven by what the oil price is for those various months. If oil prices stay low through September, then we will keep production shut in until October, and so on.
Oil and Gas Support Services Firms
- We expect to remain solvent for the next year; however, if commodity prices do not recover or decline again, all bets are off.
- Times like these are purely about survival, and many of our competitors and customers will not survive without a material change in the energy space, which I don't expect for several quarters.
- Remaining solvent for many of us will include making many more sacrifices, trimming salaries and making other painful steps just to survive.
Additional Comments »
Second Quarter | June 24, 2020
Historical data are available from first quarter 2016 to the most current release quarter.
Business Indicators: Quarter/Quarter
| Business Indicators: All Firms Current Quarter (versus previous quarter) | |||||
| Indicator | Current Index | Previous Index | % Reporting Increase | % Reporting No Change | % Reporting Decrease |
Level of Business Activity | –66.1 | –50.9 | 6.5 | 20.8 | 72.6 |
Capital Expenditures | –68.5 | –49.4 | 8.9 | 13.7 | 77.4 |
Supplier Delivery Time | –17.8 | –10.8 | 7.4 | 67.5 | 25.2 |
Employment | –46.1 | –24.0 | 1.8 | 50.3 | 47.9 |
Employee Hours | –47.0 | –32.1 | 7.2 | 38.6 | 54.2 |
Wages and Benefits | –41.7 | –8.2 | 1.8 | 54.8 | 43.5 |
| Indicator | Current Index | Previous Index | % Reporting Improved | % Reporting No Change | % Reporting Worsened |
Company Outlook | –51.0 | –75.0 | 13.8 | 21.4 | 64.8 |
| Indicator | Current Index | Previous Index | % Reporting Increase | % Reporting No Change | % Reporting Decrease |
Uncertainty | 35.7 | 63.8 | 59.5 | 16.7 | 23.8 |
| Business Indicators: E&P Firms Current Quarter (versus previous quarter) | |||||
| Indicator | Current Index | Previous Index | % Reporting Increase | % Reporting No Change | % Reporting Decrease |
Level of Business Activity | –62.6 | –53.3 | 7.0 | 23.5 | 69.6 |
Oil Production | –62.6 | –26.4 | 7.8 | 21.7 | 70.4 |
Natural Gas Wellhead Production | –47.8 | –21.2 | 12.4 | 27.4 | 60.2 |
Capital Expenditures | –66.1 | –49.0 | 10.4 | 13.0 | 76.5 |
Expected Level of Capital Expenditures Next Year | –54.4 | –61.9 | 11.4 | 22.8 | 65.8 |
Supplier Delivery Time | –13.4 | –10.6 | 7.1 | 72.3 | 20.5 |
Employment | –40.3 | –22.8 | 0.9 | 57.9 | 41.2 |
Employee Hours | –38.9 | –28.5 | 7.1 | 46.9 | 46.0 |
Wages and Benefits | –38.2 | –6.7 | 0.9 | 60.0 | 39.1 |
Finding and Development Costs | –42.4 | –32.7 | 2.7 | 52.2 | 45.1 |
Lease Operating Expenses | –54.4 | –24.0 | 2.6 | 40.4 | 57.0 |
| Indicator | Current Index | Previous Index | % Reporting Improved | % Reporting No Change | % Reporting Worsened |
Company Outlook | –45.8 | –74.0 | 15.9 | 22.4 | 61.7 |
| Indicator | Current Index | Previous Index | % Reporting Increase | % Reporting No Change | % Reporting Decrease |
Uncertainty | 32.2 | 66.9 | 56.5 | 19.1 | 24.3 |
| Business Indicators: O&G Support Services Firms Current Quarter (versus previous quarter) | |||||
| Indicator | Current Index | Previous Index | % Reporting Increase | % Reporting No Change | % Reporting Decrease |
Level of Business Activity | –73.5 | –46.3 | 5.7 | 15.1 | 79.2 |
Utilization of Equipment | –69.2 | –47.2 | 7.7 | 15.4 | 76.9 |
Capital Expenditures | –73.5 | –50.0 | 5.7 | 15.1 | 79.2 |
Supplier Delivery Time | –27.5 | –11.3 | 7.8 | 56.9 | 35.3 |
Lag Time in Delivery of Firm's Services | –21.1 | –20.7 | 5.8 | 67.3 | 26.9 |
Employment | –58.5 | –26.4 | 3.8 | 34.0 | 62.3 |
Employment Hours | –64.2 | –38.9 | 7.5 | 20.8 | 71.7 |
Wages and Benefits | –49.0 | –11.3 | 3.8 | 43.4 | 52.8 |
Input Costs | –50.0 | –11.3 | 1.9 | 46.2 | 51.9 |
Prices Received for Services | –64.7 | –37.7 | 0.0 | 35.3 | 64.7 |
Operating Margin | –68.6 | –50.0 | 3.9 | 23.5 | 72.5 |
| Indicator | Current Index | Previous Index | % Reporting Improved | % Reporting No Change | % Reporting Worsened |
Company Outlook | –61.6 | –76.9 | 9.6 | 19.2 | 71.2 |
| Indicator | Current Index | Previous Index | % Reporting Increase | % Reporting No Change | % Reporting Decrease |
Uncertainty | 43.4 | 57.4 | 66.0 | 11.3 | 22.6 |
Business Indicators: Year/Year
| Business Indicators: All Firms Current Quarter (versus same quarter a year ago) | |||||
| Indicator | Current Index | Previous Index | % Reporting Increase | % Reporting No Change | % Reporting Decrease |
Level of Business Activity | –81.1 | –47.7 | 6.7 | 5.5 | 87.8 |
Capital Expenditures | –79.0 | –48.7 | 6.8 | 7.4 | 85.8 |
Supplier Delivery Time | –25.0 | –8.8 | 7.5 | 60.0 | 32.5 |
Employment | –52.4 | –25.0 | 5.6 | 36.4 | 58.0 |
Employee Hours | –54.9 | –28.0 | 6.2 | 32.7 | 61.1 |
Wages and Benefits | –39.0 | –4.0 | 7.3 | 46.3 | 46.3 |
| Indicator | Current Index | Previous Index | % Reporting Improved | % Reporting No Change | % Reporting Worsened |
Company Outlook | –76.5 | –74.8 | 7.8 | 7.8 | 84.3 |
| Business Indicators: E&P Firms Current Quarter (versus same quarter a year ago) | |||||
| Indicator | Current Index | Previous Index | % Reporting Increase | % Reporting No Change | % Reporting Decrease |
Level of Business Activity | –77.8 | –47.5 | 8.0 | 6.2 | 85.8 |
Oil Production | –62.8 | –17.0 | 14.2 | 8.8 | 77.0 |
Natural Gas Wellhead Production | –52.6 | –15.2 | 17.0 | 13.4 | 69.6 |
Capital Expenditures | –75.9 | –46.0 | 8.9 | 6.3 | 84.8 |
Expected Level of Capital Expenditures Next Year | –70.0 | –66.0 | 10.0 | 10.0 | 80.0 |
Supplier Delivery Time | –20.7 | –6.1 | 8.1 | 63.1 | 28.8 |
Employment | –46.0 | –21.4 | 6.3 | 41.4 | 52.3 |
Employee Hours | –46.9 | –25.0 | 7.2 | 38.7 | 54.1 |
Wages and Benefits | –30.1 | 2.0 | 8.8 | 52.2 | 38.9 |
Finding and Development Costs | –52.7 | –36.3 | 1.8 | 43.6 | 54.5 |
Lease Operating Expenses | –60.0 | –26.5 | 3.6 | 32.7 | 63.6 |
| Indicator | Current Index | Previous Index | % Reporting Improved | % Reporting No Change | % Reporting Worsened |
Company Outlook | –70.9 | –76.1 | 10.7 | 7.8 | 81.6 |
| Business Indicators: O&G Support Services Firms Current Quarter (versus same quarter a year ago) | |||||
| Indicator | Current Index | Previous Index | % Reporting Increase | % Reporting No Change | % Reporting Decrease |
Level of Business Activity | –88.3 | –48.0 | 3.9 | 3.9 | 92.2 |
Utilization of Equipment | –81.6 | –46.0 | 4.1 | 10.2 | 85.7 |
Capital Expenditures | –86.0 | –54.0 | 2.0 | 10.0 | 88.0 |
Supplier Delivery Time | –34.7 | –14.3 | 6.1 | 53.1 | 40.8 |
Lag Time in Delivery of Firm's Services | –34.0 | –22.5 | 4.0 | 58.0 | 38.0 |
Employment | –66.7 | –32.7 | 3.9 | 25.5 | 70.6 |
Employment Hours | –72.6 | –34.0 | 3.9 | 19.6 | 76.5 |
Wages and Benefits | –58.8 | –16.0 | 3.9 | 33.3 | 62.7 |
Input Costs | –65.3 | –20.4 | 4.1 | 26.5 | 69.4 |
Prices Received for Services | –71.5 | –44.0 | 2.0 | 24.5 | 73.5 |
Operating Margin | –81.6 | –45.9 | 0.0 | 18.4 | 81.6 |
| Indicator | Current Index | Previous Index | % Reporting Improved | % Reporting No Change | % Reporting Worsened |
Company Outlook | –88.0 | –72.4 | 2.0 | 8.0 | 90.0 |
Second Quarter | June 24, 2020
Activity Chart
Second Quarter | June 24, 2020
Comments from Survey Respondents
These comments are from respondents’ completed surveys and have been edited for publication. Comments from the Special Questions survey can be found below the special questions.
Exploration and Production (E&P) Firms
- Access to capital and our bank group's willingness to extend our access to credit in our Reserve-Based Loan remains our greatest risk and challenge as we are fully hedged on oil at $55 per barrel through year-end 2021, and our production assets have low lifting costs. We do not know when we'll be able to return to drilling and completing wells due to our lack of liquidity and no access to new capital.
- We are getting hammered by our purchaser, as they have told us there is no market for our crude oil. We have been paid $15 per barrel for the past two months. We cannot continue to operate at these prices.
- Is oil and gas private equity over?
- Uncertainty has increased due to the following reasons. First, it is difficult to assess what the level of oil demand will be in third quarter and fourth quarter 2020. Second, it is difficult to assess what OPEC-plus [OPEC and select non-OPEC members including Russia] will do. Third, it is difficult to assess bank actions for operators and oilfield service firms (OFS). Fourth, it is difficult to assess how many OFS suppliers will be left in fourth quarter 2020. Fifth, it is difficult to assess "call on frac" vs. "call on OPEC." Sixth, it is difficult to assess if quality crews will be available in fourth quarter 2020 and/or first quarter 2021 for the increase in activity levels. Seventh, it is difficult to assess if WTI [West Texas Intermediate] will be $40 or $30 or $50 per barrel at the end of 2020 (a $10-per-barrel swing matters).
- It is going to take 12 to 36 months for oil demand to recover to pre-COVID-19 levels, so oil prices will be slow to recover. We think there will be price volatility between $25 and $45 per barrel for the next three years, so capital spending will be slow for multiple years.
- I sold no crude oil in May. In some instances, the refineries notified us they would not take any oil, and trucking companies would not pick oil up at the lease. At any rate, we sold the tanks dry in April and filled the tank batteries in May and then shut in the wells. I anticipated second-quarter revenue has thus sharply declined. May income (from March and April production) was 30 percent of April’s. I am dismayed that many operators have resumed selling oil into such a depressed market and anticipate this will prolong low oil prices.
- Banks are completely unprepared for what is heading their way. They will need to figure out how to own energy assets this fall.
- The news has mostly been about low oil prices and the supply/demand imbalance. However, pricing for natural gas has reached an unsustainable level even with a good gas processing contract in place. There will be a large number of stripper-well production properties that will not survive the current environment if low prices persist for very long.
- The lower oil demand and increased oil supply has had a negative effect. If oil production can be cut back further, that may help.
- Across the oil industry, conventional bank credit contraction is limiting the options of all companies, including companies with little or no existing debt. This will require additional outside capital raises diluting current owners or force liquidation of some assets at highly depressed valuations in order to create liquidity.
- Much depends on the virus not breaking out and causing the blue states to make it a political issue even more. Also, it depends on how the shale guys react to even a small increase on the price per barrel. Nat [Natural] gas looks strongest due to a lack of drilling. Hot summer will help slow natural gas storage rates. LNG [liquefied natural gas], even though depressed, will also react to prices moving up. The economy being shut down by our government was an overreaction due to political implications.
- There continues to be depressed product index prices with wide price differentials. A worsening trend is many of our operators have gone to the oil and gas purchasers and have arranged to take over the role of revenue distribution from the purchasers. So the operators are now receiving our revenues, which adds one more month to the distribution lag, and then they are holding on to our revenues for an extra month or more before distributing them to the interest owners. They are now using the COVID-19 virus as an excuse not to distribute revenues ("Well, we've got so many employees working from home there's nobody left in the office to print the checks"; "I thought the checks were printed last week. Let me check on it the next time I can get into the office and I'll get back to you"; and "Oh, we'll probably have some of the finance people in the office next week to print checks."). Plus, in Oklahoma they are allowed to add a monthly line-item expense to the Joint Interest Billings to do this.
- A general malaise prevails within the oil and gas community. Professional meetings and trade association meetings have been canceled or postponed until 2021. Select groups are holding web-based meetings. However, such meetings lack the personal interactions and exchange of ideas that is necessary for small companies to progress with exploration and to attract new investment. Low-volume stripper wells have been shut in, awaiting higher product prices and, in some cases, plugged and abandoned.
- It is still too soon to know how this year will shake out. The usual unpredictable variables remain in place with little change—Saudi Arabia, Russia, COVID-19, demand, supply, etc. I'm surprised at the rise in the price of oil; there is no good reason for that, but it does help our well economics.
Oil and Gas Support Services Firms
- Business opportunities are basically nonexistent for our company. Without a plan to drill wells, our customers have little demand for onshore seismic data.
- Oil demand and global economic recovery swamp all other issues in terms of importance to the 2021 oil market outlook.
- The most obvious issue is/was COVID-19. It shut down the oil business and dropped prices to below productive values.
- Our business is experiencing bad times.
- This has been the fastest decline in my oil and gas career, and I expect the turnaround to be painfully slow.
- I can't even begin to guess where oil and gas prices will be in the future.
- The lack of liquidity coupled with the extreme decline in the market for our oilfield services has our company on the ropes. We are struggling to keep the doors open.
- If oil and gas operator activity stays at current levels much longer, the viability of my business will be ruined. There is only so long cash reserves can withstand the current level of activity.
Questions regarding the Dallas Fed Energy Survey can be addressed to Michael Plante at Michael.Plante@dal.frb.org or Kunal Patel at Kunal.Patel@dal.frb.org.
Sign up for our email alert to be automatically notified as soon as the latest Dallas Fed Energy Survey is released on the web.