Dallas Fed Energy Survey

Oil and Gas Expansion Accelerates as Outlooks Improve Significantly
Special questions this quarter include an annual update on breakeven prices by basin, expected firm growth in crude oil production, anticipated changes in employee head counts for 2022, the oil price needed to return publicly traded producers to growth mode, and the primary reason publicly traded producers are restraining production growth despite high oil prices.
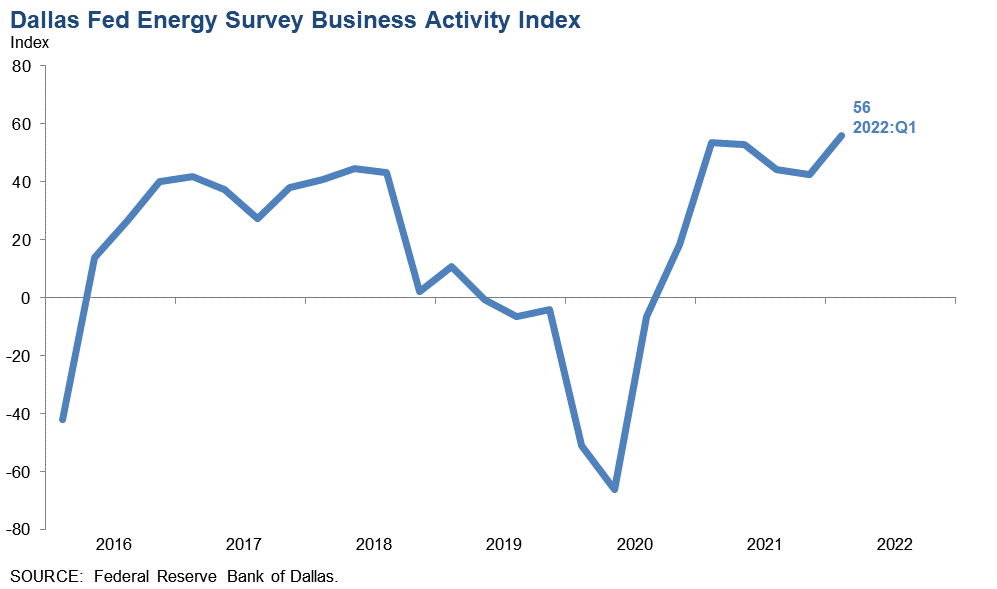
Activity in the oil and gas sector accelerated in first quarter 2022, according to oil and gas executives responding to the Dallas Fed Energy Survey. The business activity index—the survey’s broadest measure of conditions facing Eleventh District energy firms—jumped from 42.6 in the fourth quarter to 56.0, reaching its highest reading in the survey’s six-year history.
Oil production increased at a faster pace, according to executives at exploration and production (E&P) firms. The oil production index rose sharply from 19.1 in the fourth quarter to 45.0 in the first quarter. Similarly, the natural gas production index advanced 14 points to 40.0.
Costs increased for a fifth straight quarter. Among oilfield services firms, the index for input costs increased from 69.8 to 77.1—a record high. Only one of the 50 responding oilfield services firms reported lower input costs this quarter. Among E&P firms, the index for finding and development costs advanced from 44.9 in the fourth quarter to 56.0 in the first. Additionally, the index for lease operating expenses also increased, from 42.0 to 58.9. Both indexes reached highs for the survey’s six-year history.
Oilfield services firms reported improvement across all indicators. The equipment utilization index remained elevated but edged down from 51.1 in the fourth quarter to 50.0 in the first. The operating margin index advanced from 11.6 to 21.3. The index of prices received for services jumped from 30.3 to 53.2, a record high.
All labor market indexes in the first quarter reached record highs, pointing to strong growth in employment, hours and wages. The aggregate employment index posted a fifth consecutive positive reading and increased from 11.9 to 28.0. The aggregate employee hours index jumped from 18.0 to 36.0. The aggregate wages and benefits index also rose, from 36.6 to 54.0.
Six-month outlooks improved significantly, with the index climbing from 53.2 last quarter to 76.3, a record high. The outlook uncertainty index also jumped from -1.5 to 31.9, suggesting uncertainty became much more pronounced this quarter.
On average, respondents expect a West Texas Intermediate (WTI) oil price of $93 per barrel by year-end 2022; responses ranged from $50 to $200 per barrel. Survey participants expect Henry Hub natural gas prices of $4.57 per million British thermal units (MMBtu) at year-end. For reference, WTI spot prices averaged $103.07 per barrel during the survey collection period, and Henry Hub spot prices averaged $4.65 per MMBtu.
Next release: June 23, 2022
Data were collected March 9–17, and 141 energy firms responded. Of the respondents, 91 were exploration and production firms and 50 were oilfield services firms.
The Dallas Fed conducts the Dallas Fed Energy Survey quarterly to obtain a timely assessment of energy activity among oil and gas firms located or headquartered in the Eleventh District. Firms are asked whether business activity, employment, capital expenditures and other indicators increased, decreased or remained unchanged compared with the prior quarter and with the same quarter a year ago. Survey responses are used to calculate an index for each indicator. Each index is calculated by subtracting the percentage of respondents reporting a decrease from the percentage reporting an increase. When the share of firms reporting an increase exceeds the share reporting a decrease, the index will be greater than zero, suggesting the indicator has increased over the previous quarter. If the share of firms reporting a decrease exceeds the share reporting an increase, the index will be below zero, suggesting the indicator has decreased over the previous quarter.
Price Forecasts
West Texas Intermediate Crude
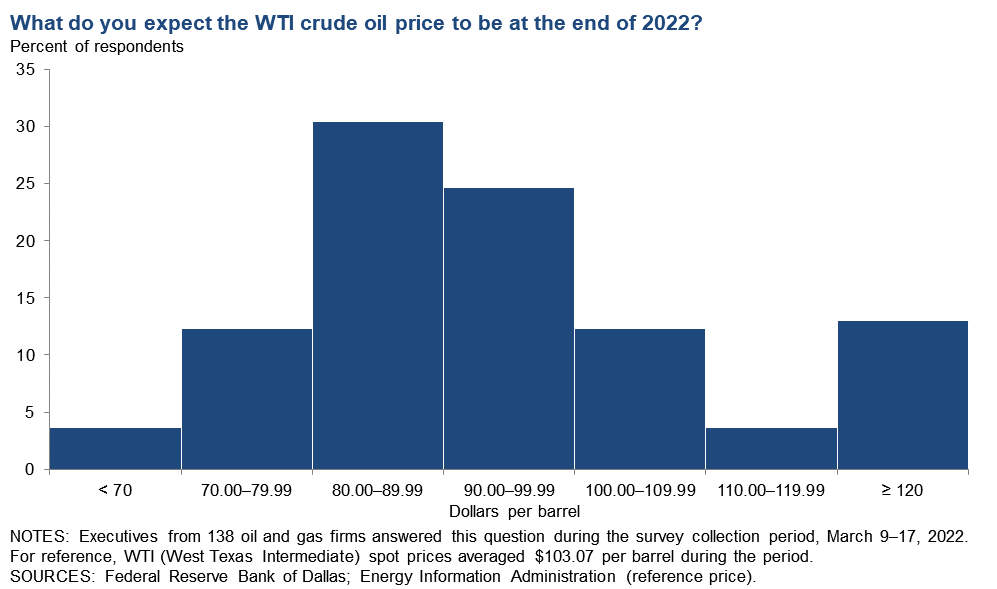
| West Texas Intermediate crude oil price (dollars per barrel), year-end 2022 | ||||
| Indicator | Survey Average | Low Forecast | High Forecast | Price During Survey |
Current quarter | $93.26 | $50.00 | $200.00 | $103.07 |
Prior quarter | $74.69 | $50.00 | $125.00 | $71.43 |
| NOTE: Price during survey is an average of daily spot prices during the survey collection period. SOURCES: Energy Information Administration; Federal Reserve Bank of Dallas. | ||||
Henry Hub Natural Gas
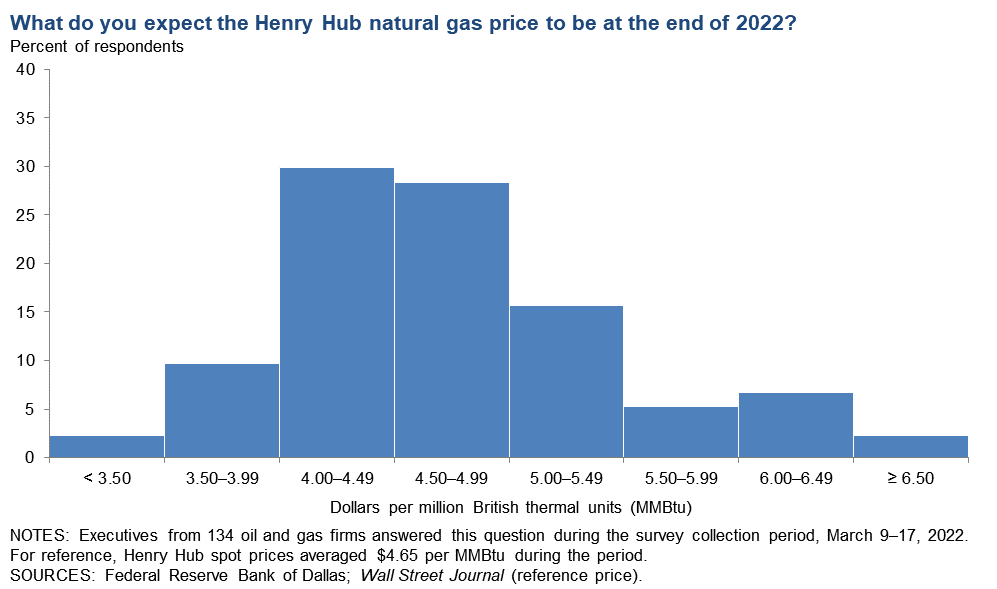
| Henry Hub natural gas price (dollars per MMBtu), year-end 2022 | ||||
| Indicator | Survey Average | Low Forecast | High Forecast | Price During Survey |
Current quarter | $4.57 | $3.00 | $8.00 | $4.62 |
Prior quarter | $4.06 | $2.25 | $7.50 | $3.76 |
| NOTE: Price during survey is an average of daily spot prices during the survey collection period. SOURCES: Federal Reserve Bank of Dallas; Wall Street Journal. | ||||
Special Questions
Data were collected March 9–17; 139 oil and gas firms responded to the special questions survey.
Exploration and Production (E&P) Firms
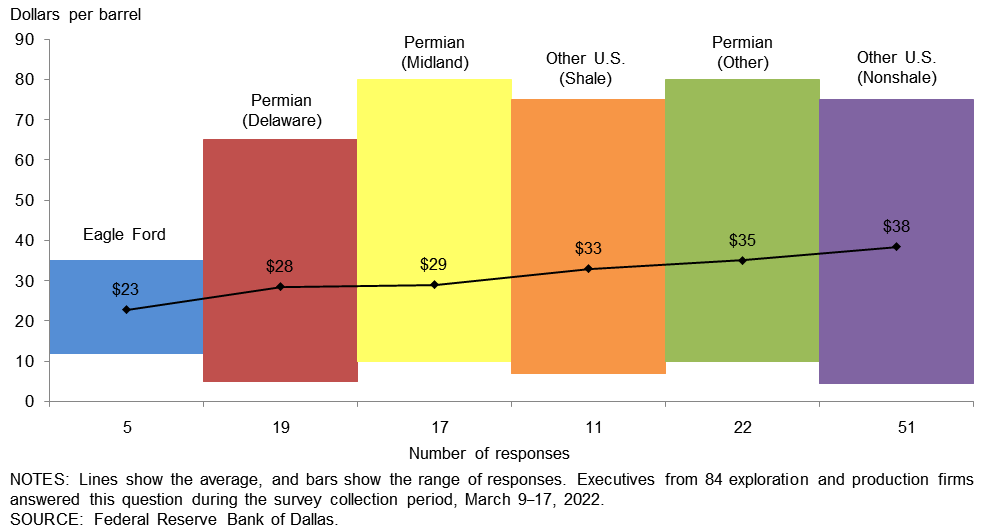
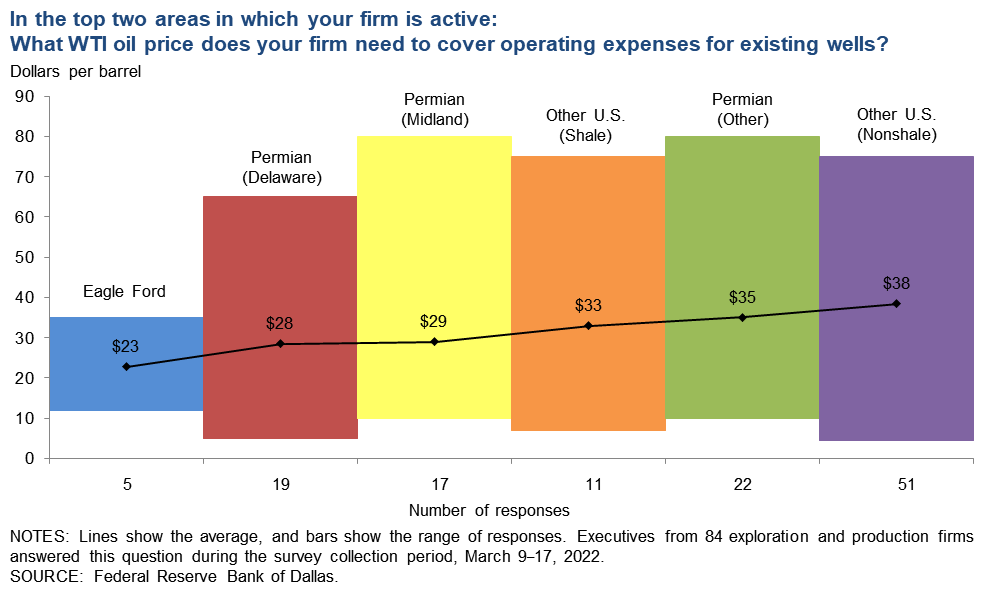
In the top two areas in which your firm is active: What West Texas Intermediate (WTI) oil price does your firm need to cover operating expenses for existing wells?
The average price across the entire sample is approximately $34 per barrel, up from $31 last year. Across regions, the average price necessary to cover operating expenses ranges from $23 to $38 per barrel. All respondents can cover operating expenses for existing wells at current prices.
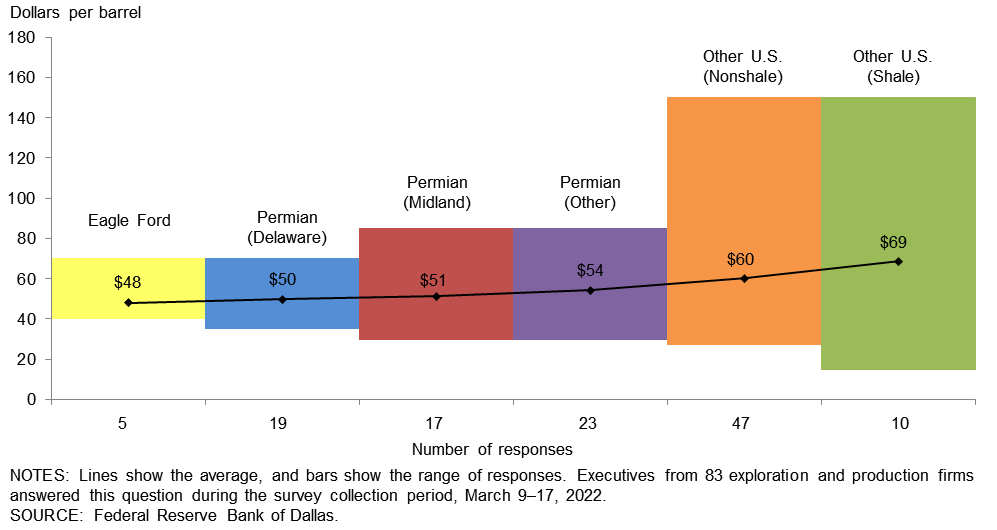
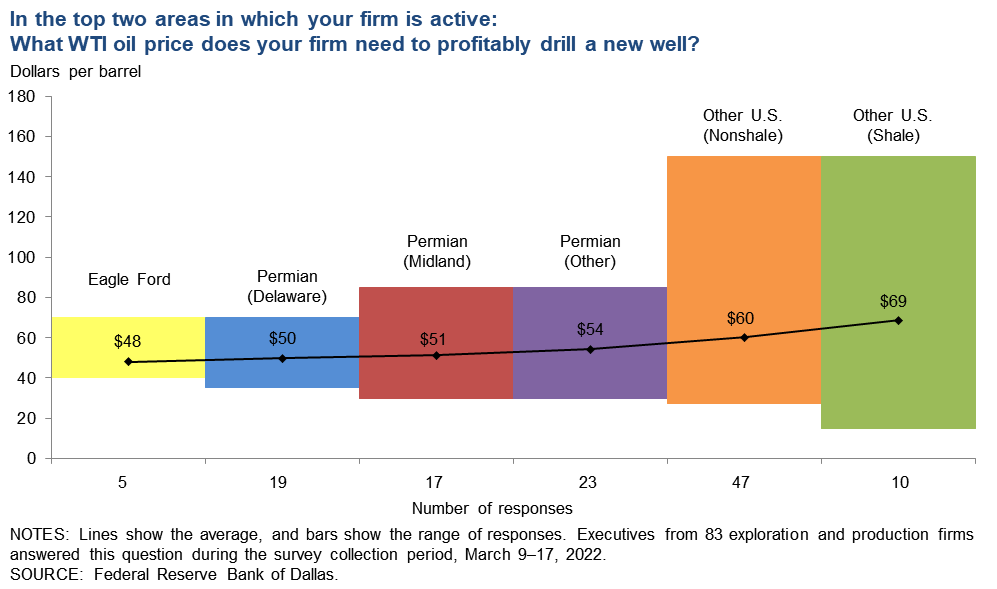
In the top two areas in which your firm is active: What WTI oil price does your firm need to profitably drill a new well?
For the entire sample, firms need $56 per barrel on average to profitably drill, higher than the $52-per-barrel price when this question was asked last year. Across regions, average breakeven prices to profitably drill a new well range from $48 to $69 per barrel. Breakeven prices in the Permian Basin average $52 per barrel, $2 higher than last year. With the jump in oil prices, almost all firms in the survey can profitably drill a new well at current prices (March 17's WTI spot price was $103 per barrel).
Large firms (with crude oil production of 10,000 barrels per day (b/d) or more as of fourth quarter 2021) need $49 per barrel on average to profitably drill, lower than the $59 for small firms (less than 10,000 b/d).
By what percent do you expect your firm’s crude oil production to change from fourth quarter 2021 to fourth quarter 2022?
For this special question, executives were asked to provide a specific percentage. Firms were classified as “small” if they produced less than 10,000 barrels per day (b/d) as of fourth quarter of 2021 or “large” if they produced 10,000 b/d or more. In the U.S., small E&P firms are greater in number, but large E&P firms make up the majority of production (greater than 80 percent).
The median growth rate among large firms was 6 percent, compared with 15 percent among small firms. Twenty-five percent of executives at larger firms expect to expand crude oil production by more than zero but not more than 5 percent, with an additional 25 percent targeting no growth. Executives at small firms expect to increase crude oil production at much higher rates. (See table for more detail.)
| Response | Percent of respondents | |
| Large firms | Small firms | |
| Less than 0% | 0 | 10 |
| 0% | 25 | 11 |
| More than 0% but not more than 5% | 25 | 5 |
| More than 5% but not more than 10% | 20 | 18 |
| More than 10% but not more than 20% | 15 | 23 |
| More than 20% but not more than 30% | 0 | 11 |
| More than 30% | 15 | 23 |
| Median growth (percent) | 6 | 15 |
| NOTES: Executives from 82 exploration and production firms answered this question during the survey collection period, March 9–17, 2022. Small firms produced less than 10,000 b/d in fourth quarter 2021, while large firms produced 10,000 b/d or more. Responses came from 62 small firms and 20 large firms. SOURCE: Federal Reserve Bank of Dallas. |
||
All Firms
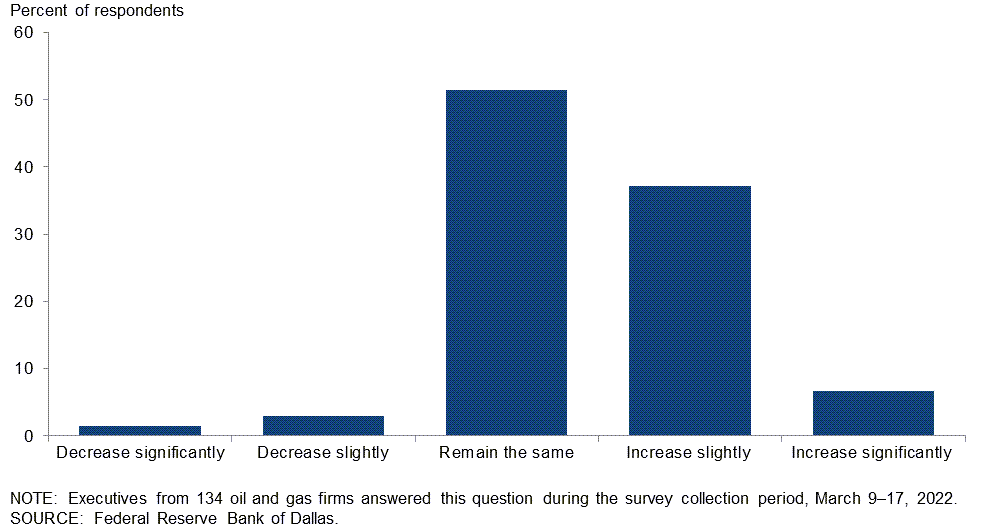
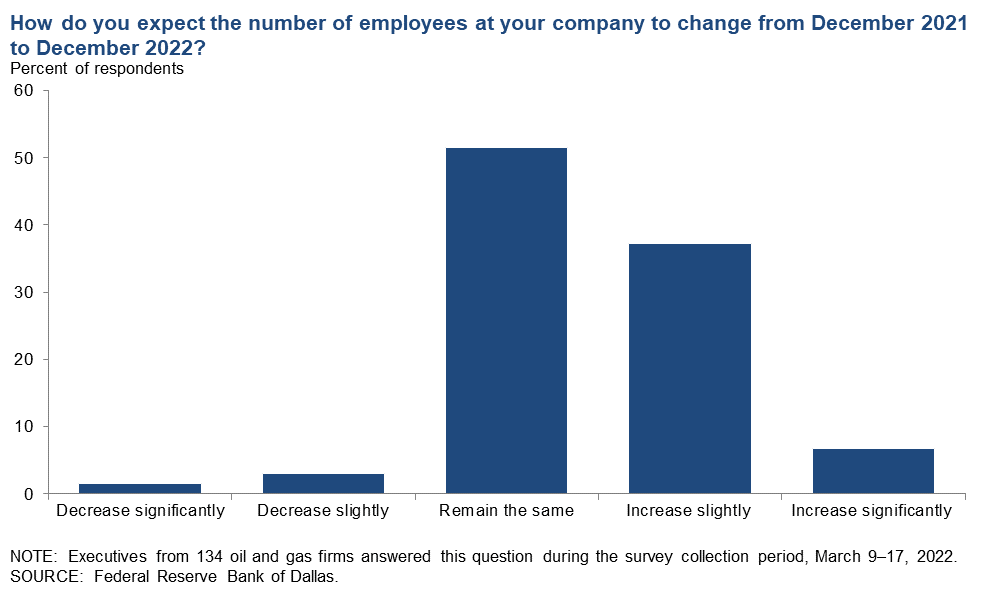
How do you expect the number of employees at your company to change from December 2021 to December 2022?
Slightly more than half of the executives—51 percent—expect their head count to remain unchanged from December 2021 to December 2022. Forty-four percent of executives expect the number of employees to increase, of which 7 percent expect a significant increase and 37 percent expect a slight increase. Only 4 percent expect the number of employees to decrease over the period.
Sixty-six percent of support services firms anticipate increasing the number of employees in 2022 versus 31 percent for E&P firms. (See table for more detail.)
| Response | Percent of respondents | ||
| All firms | E&P | Services | |
| Increase significantly | 7 | 0 | 18 |
| Increase slightly | 37 | 31 | 48 |
| Remain the same | 51 | 63 | 32 |
| Decrease slightly | 3 | 5 | 0 |
| Decrease significantly | 1 | 1 | 2 |
| NOTE: Executives from 84 exploration and production firms and 50 oil and gas support services firms answered this question during the survey collection period, March 9–17, 2022. The “All firms” column reports the percentage out of the total 134 responses. Percentages may not sum to 100 due to rounding. | |||
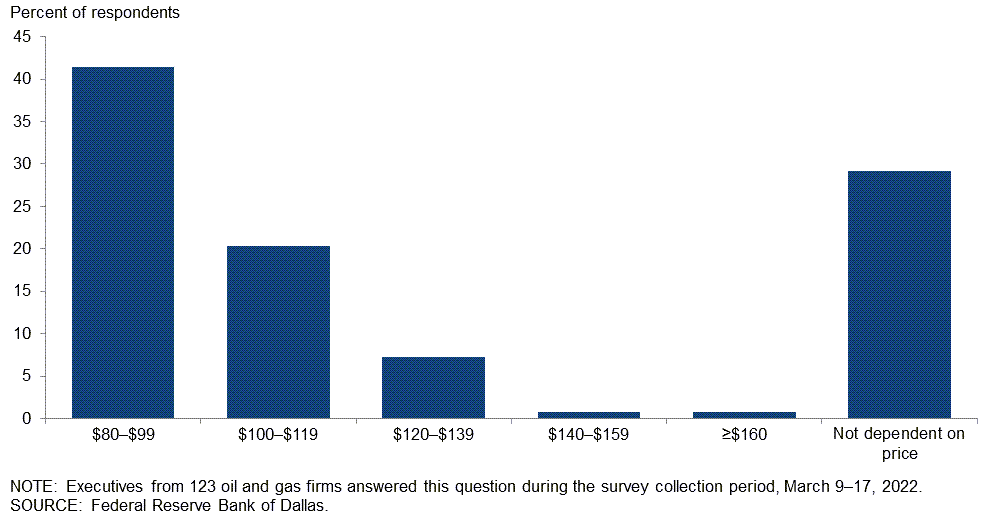
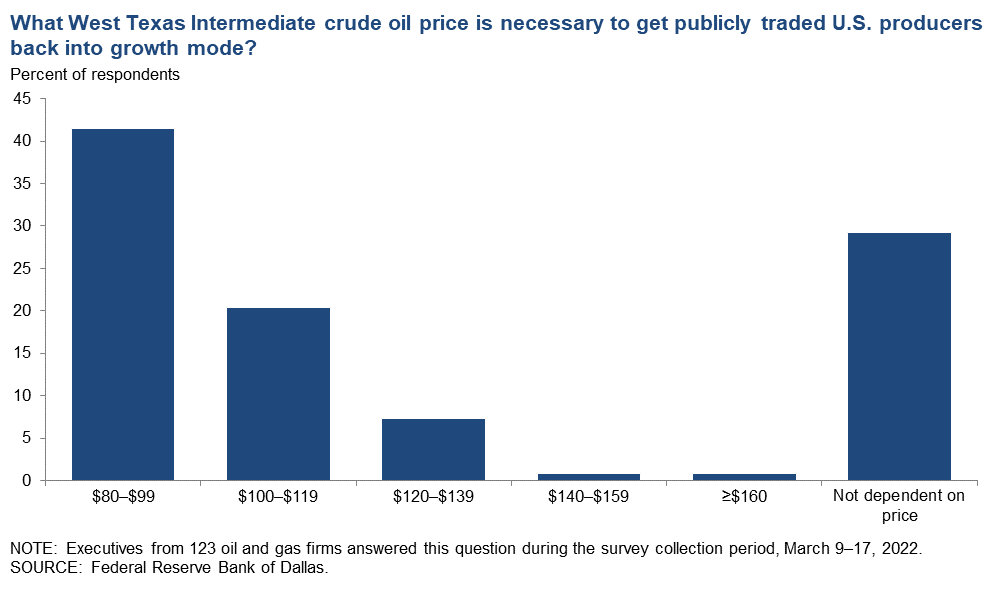
What West Texas Intermediate crude oil price is necessary to get publicly traded U.S. producers back into growth mode?
Forty-one percent of executives believe the WTI crude oil price necessary to get publicly traded U.S. producers back into growth mode is between $80 and $99 per barrel, and an additional 20 percent believe $100 to $119 is sufficient. A small portion of respondents said $120 per barrel or higher. However, a sizable portion, 29 percent, believe the shift to growth mode will not be dependent on the price of oil.
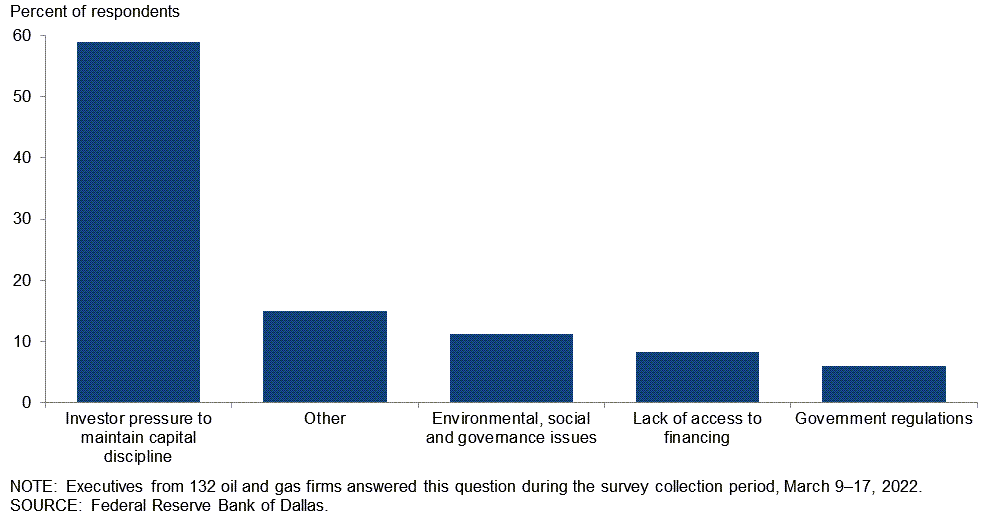
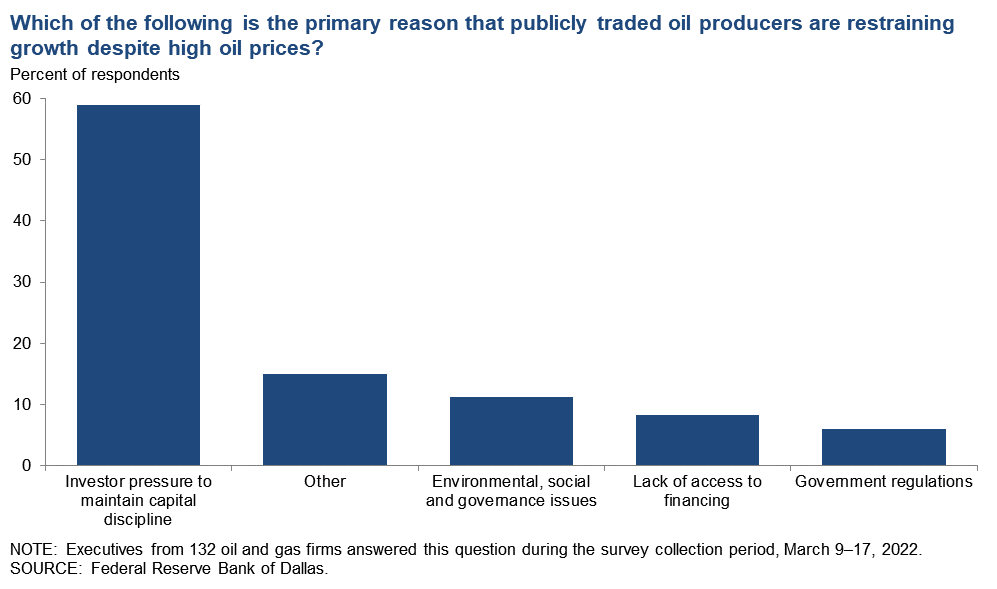
Which of the following is the primary reason that publicly traded oil producers are restraining growth despite high oil prices?
Slightly over half—59 percent—of executives believe investor pressure to maintain capital discipline is the primary reason that publicly traded oil producers are restraining growth despite high oil prices. Fifteen percent of executives said “other,” and 11 percent note environmental, social and governance issues. For respondents who said “other,” the primary reasons were personnel shortages, limited availability of equipment and supply-chain issues. An additional reason cited was uncertainty regarding future oil prices and whether they would stay high. Some felt that a combination of reasons is equally responsible for driving restraint.
Special Questions Comments
Exploration and Production (E&P) Firms
- The industry is facing serious supply issues for the materials needed to grow production. The supply-chain issues and shortage of materials are unprecedented. We are also facing serious workforce issues because a meaningful portion of the labor force left the industry during the downturn and due to the vilification of the oil and gas industry. The message from the White House, Capitol Hill and Wall Street has been that oil and gas is a dying industry and one that needs to be abandoned. Even if funding were available and supply-chain issues were resolved, it is unlikely that the labor shortage will be resolved any time soon and simply by paying higher wages.
- Traditional lending and capital markets access for exploration and production companies are down across the board over the last several years and historically low compared to the commodity environment we are in today. Private-equity capital for oil and gas is down 70 to 80 percent over the last several years. Is this a response to low-carbon and/or ESG-related interest by banks and investors, or is it in part to the market adjusting to an administration that made it clear from day one they do not support new oil and gas development and have put appointments in key agencies in place that support this view? It is probably both, but that still tells smaller public and private independents that they cannot rely on external capital, and that they should restrain their budgets accordingly, at a time when supply growth would certainly help. Exploration and production companies need to keep engaging on why responsible oil and gas development and growth in energy-transition technology is the right combination to give consumers the best outcome, so there is more bipartisan support for sound energy policy.
- The U.S. needs to increase production by about two million barrels per day to balance global supply and demand in 2023. It is looking unlikely that this will happen, which will result in sustained higher energy prices until the American consumer is pushed into a recession. The industry leadership continues to be lackluster, swinging from demands for proration in 2020 to demands for the administration to call them to increase production in 2022. The compelling future of the upstream business needs to be to grow production to meet worldwide demand during the energy transition while maintaining returns on capital employed and the world’s highest environmental, social and governance (ESG) standards. Unfortunately, no leaders have this thesis.
- My business has changed drastically due to the hostile political situation in Colorado toward the oil and gas industry. In the first quarter of 2021, I divested all properties in the state of Colorado due to the unbelievably hostile and increasingly aggressive regulatory environment driven by anti-fossil-fuel ideology. This has created an unstable and unpredictable place to do business in Colorado. The administrative state, driven and encouraged by the governor and legislature, has been given carte blanche to become judge, jury and executioner of the oil and gas industry.
- The U.S. needs to fast track infrastructure, such as the Keystone pipeline, Mountain Valley pipeline, Constitution pipeline and liquefied natural gas export facilities and eliminate the Jones Act. Regulation is significantly hurting and hampering U.S. energy production. Safety and environmental standards in the U.S. are better than in major exploration and production areas internationally. The U.S. needs to prioritize U.S. energy and the U.S. supply chain.
- Investors dumped huge funds into shale drilling only to discover that when oil prices dropped, very little value existed at the end of the day. Investors have demanded restraint and capital discipline of their client companies. Government posturing and increased regulations are severely hampering the entire industry. Permitting roadblocks and politically emplaced barriers should be removed as this is dampening the willingness of anyone trying to bring new investments to the industry, regardless of that investment being for a private or public entity.
- Publicly traded companies need to see the West Texas Intermediate crude oil strip-price backwardation muted before they will consider growing again.
- The probability distribution of prices is now more weighted toward lower prices for several reasons. First, at some point, the Russia–Ukraine war may cause demand destruction. Second, renewed city shutdowns in China indicate that COVID-19 could cause another recession in conjunction with the impacts of the Russia–Ukraine war. Third, a return to “normalcy” without precautionary buying due to the Russia–Ukraine war will remove some of the added demand that has fueled higher oil prices over the past several months.
- U.S. government actions and intentions are not helping U.S. producers to increase domestic oil and gas supplies appreciably.
- Increasingly onerous government regulations and/or policies regarding upstream, midstream and downstream (refining) operations have made it difficult for companies in these sectors to make money. Geopolitical risk and concern about higher taxation have also impeded activity.
- Supply and demand are now subjected to significant domestic and international political and market conflicts and disruptions, resulting in a significant challenge to develop credible strategic assessments and planning. This has resulted in a preference for risk avoidance with respect to strategic capital commitments.
Oil and Gas Support Services Firms
- We have the rigs but can’t find employees. However, oil companies have to understand that oilfield services and, in particular, onshore land drilling contractors have to be paid a livable rate to justify the enormous capital cost of running, upgrading and crewing a modern onshore drilling rig.
- The lack of people to work, and the delivery and cost of pipe, frac sand, cement, etc., are all concerns for our business. It will take quite of bit of time for growth to happen. There is also investor pressure.
- I feel that the primary reason that publicly traded oil producers are restraining growth despite high oil prices is a two-headed monster, with capital discipline and governmental regulations due to the green progressives in the administration’s ear.
- The answer to the primary reason that publicly traded oil producers are restraining growth despite high oil prices is a combination of investor pressure, ESG issues, government regulation and lack of growth capital. It was difficult to say any of those were the primary reason. Spending will increase with improved cash flow, but I don’t see companies raising capital and going into debt to invest in production growth.
- Discipline continues to dominate the industry. Shareholders and lenders continue to demand a return on capital, and until it becomes unavoidably obvious that high energy prices will sustain, there will be no exploration spending.
- In this upcycle, investors have made it clear they wanted to see discipline from all players. So far, E&Ps for the most are exhibiting capital discipline. A significant part of E&P capital spending growth this year (2022 versus 2021) will be consumed by cost inflation as the cost for all inputs continues to increase against a backdrop of supply-chain challenges and limited incremental equipment being reactivated (due to fiscal constraints and manpower challenges within oilfield services and related suppliers).
- The administration is still restricting our control on how we operate our wells. We are governed by the Texas Railroad Commission, which is enough authority over us. The administration has no clue about the oil and gas industry.
Additional Comments »
Historical data are available from first quarter 2016 to the most current release quarter.
Business Indicators: Quarter/Quarter
| Business Indicators: All Firms Current Quarter (versus previous quarter) | |||||
| Indicator | Current Index | Previous Index | % Reporting Increase | % Reporting No Change | % Reporting Decrease |
Level of Business Activity | 56.0 | 42.6 | 62.4 | 31.2 | 6.4 |
Capital Expenditures | 46.3 | 36.9 | 54.3 | 37.7 | 8.0 |
Supplier Delivery Time | 30.6 | 25.6 | 49.6 | 31.4 | 19.0 |
Employment | 28.0 | 11.9 | 30.9 | 66.2 | 2.9 |
Employee Hours | 36.0 | 18.0 | 39.6 | 56.8 | 3.6 |
Wages and Benefits | 54.0 | 36.6 | 58.3 | 37.4 | 4.3 |
| Indicator | Current Index | Previous Index | % Reporting Improved | % Reporting No Change | % Reporting Worsened |
Company Outlook | 76.3 | 53.2 | 80.0 | 16.3 | 3.7 |
| Indicator | Current Index | Previous Index | % Reporting Increase | % Reporting No Change | % Reporting Decrease |
Uncertainty | 31.9 | –1.5 | 52.5 | 27.0 | 20.6 |
| Business Indicators: E&P Firms Current Quarter (versus previous quarter) | |||||
| Indicator | Current Index | Previous Index | % Reporting Increase | % Reporting No Change | % Reporting Decrease |
Level of Business Activity | 50.5 | 33.3 | 57.1 | 36.3 | 6.6 |
Oil Production | 45.0 | 19.1 | 51.6 | 41.8 | 6.6 |
Natural Gas Wellhead Production | 40.0 | 26.1 | 46.7 | 46.7 | 6.7 |
Capital Expenditures | 44.5 | 35.9 | 55.6 | 33.3 | 11.1 |
Expected Level of Capital Expenditures Next Year | 51.6 | 46.0 | 53.8 | 44.0 | 2.2 |
Supplier Delivery Time | 28.9 | 24.5 | 46.7 | 35.6 | 17.8 |
Employment | 24.5 | 6.7 | 26.7 | 71.1 | 2.2 |
Employee Hours | 27.8 | 5.6 | 30.0 | 67.8 | 2.2 |
Wages and Benefits | 52.3 | 30.0 | 56.7 | 38.9 | 4.4 |
Finding and Development Costs | 56.0 | 44.9 | 59.3 | 37.4 | 3.3 |
Lease Operating Expenses | 58.9 | 42.0 | 63.3 | 32.2 | 4.4 |
| Indicator | Current Index | Previous Index | % Reporting Improved | % Reporting No Change | % Reporting Worsened |
Company Outlook | 79.3 | 45.8 | 81.6 | 16.1 | 2.3 |
| Indicator | Current Index | Previous Index | % Reporting Increase | % Reporting No Change | % Reporting Decrease |
Uncertainty | 29.6 | 1.1 | 53.8 | 22.0 | 24.2 |
| Business Indicators: O&G Support Services Firms Current Quarter (versus previous quarter) | |||||
| Indicator | Current Index | Previous Index | % Reporting Increase | % Reporting No Change | % Reporting Decrease |
Level of Business Activity | 66.0 | 61.4 | 72.0 | 22.0 | 6.0 |
Utilization of Equipment | 50.0 | 51.1 | 60.4 | 29.2 | 10.4 |
Capital Expenditures | 50.0 | 38.6 | 52.1 | 45.8 | 2.1 |
Supplier Delivery Time | 34.0 | 27.9 | 55.3 | 23.4 | 21.3 |
Lag Time in Delivery of Firm's Services | 25.5 | 9.3 | 29.8 | 66.0 | 4.3 |
Employment | 34.7 | 22.7 | 38.8 | 57.1 | 4.1 |
Employment Hours | 51.0 | 43.2 | 57.1 | 36.7 | 6.1 |
Wages and Benefits | 57.1 | 50.0 | 61.2 | 34.7 | 4.1 |
Input Costs | 77.1 | 69.8 | 79.2 | 18.8 | 2.1 |
Prices Received for Services | 53.2 | 30.3 | 55.3 | 42.6 | 2.1 |
Operating Margin | 21.3 | 11.6 | 40.4 | 40.4 | 19.1 |
| Indicator | Current Index | Previous Index | % Reporting Improved | % Reporting No Change | % Reporting Worsened |
Company Outlook | 70.8 | 67.4 | 77.1 | 16.7 | 6.3 |
| Indicator | Current Index | Previous Index | % Reporting Increase | % Reporting No Change | % Reporting Decrease |
Uncertainty | 36.0 | –7.0 | 50.0 | 36.0 | 14.0 |
Business Indicators: Year/Year
| Business Indicators: All Firms Current Quarter (versus same quarter a year ago) | |||||
| Indicator | Current Index | Previous Index | % Reporting Increase | % Reporting No Change | % Reporting Decrease |
Level of Business Activity | 66.7 | 67.5 | 76.3 | 14.1 | 9.6 |
Capital Expenditures | 66.2 | 66.9 | 73.7 | 18.8 | 7.5 |
Supplier Delivery Time | 43.0 | 30.4 | 60.2 | 22.7 | 17.2 |
Employment | 28.1 | 17.5 | 41.7 | 44.7 | 13.6 |
Employee Hours | 40.9 | 28.8 | 49.2 | 42.4 | 8.3 |
Wages and Benefits | 70.3 | 52.3 | 75.6 | 19.1 | 5.3 |
| Indicator | Current Index | Previous Index | % Reporting Improved | % Reporting No Change | % Reporting Worsened |
Company Outlook | 82.0 | 74.1 | 86.9 | 8.2 | 4.9 |
| Business Indicators: E&P Firms Current Quarter (versus same quarter a year ago) | |||||
| Indicator | Current Index | Previous Index | % Reporting Increase | % Reporting No Change | % Reporting Decrease |
Level of Business Activity | 59.8 | 59.5 | 72.4 | 14.9 | 12.6 |
Oil Production | 46.0 | 26.5 | 62.1 | 21.8 | 16.1 |
Natural Gas Wellhead Production | 41.2 | 36.5 | 56.5 | 28.2 | 15.3 |
Capital Expenditures | 63.9 | 68.3 | 74.4 | 15.1 | 10.5 |
Expected Level of Capital Expenditures Next Year | 63.1 | 67.1 | 67.9 | 27.4 | 4.8 |
Supplier Delivery Time | 41.6 | 30.9 | 57.1 | 27.4 | 15.5 |
Employment | 16.5 | 11.9 | 30.6 | 55.3 | 14.1 |
Employee Hours | 30.6 | 18.1 | 38.8 | 52.9 | 8.2 |
Wages and Benefits | 65.9 | 47.6 | 71.8 | 22.4 | 5.9 |
Finding and Development Costs | 73.3 | 54.2 | 73.3 | 26.7 | 0.0 |
Lease Operating Expenses | 69.0 | 48.8 | 73.8 | 21.4 | 4.8 |
| Indicator | Current Index | Previous Index | % Reporting Improved | % Reporting No Change | % Reporting Worsened |
Company Outlook | 86.4 | 72.9 | 88.9 | 8.6 | 2.5 |
| Business Indicators: O&G Support Services Firms Current Quarter (versus same quarter a year ago) | |||||
| Indicator | Current Index | Previous Index | % Reporting Increase | % Reporting No Change | % Reporting Decrease |
Level of Business Activity | 79.1 | 83.4 | 83.3 | 12.5 | 4.2 |
Utilization of Equipment | 74.0 | 78.0 | 78.3 | 17.4 | 4.3 |
Capital Expenditures | 70.2 | 64.3 | 72.3 | 25.5 | 2.1 |
Supplier Delivery Time | 45.4 | 29.2 | 65.9 | 13.6 | 20.5 |
Lag Time in Delivery of Firm's Services | 37.8 | 17.0 | 42.2 | 53.3 | 4.4 |
Employment | 48.9 | 28.6 | 61.7 | 25.5 | 12.8 |
Employment Hours | 59.6 | 50.0 | 68.1 | 23.4 | 8.5 |
Wages and Benefits | 78.3 | 61.9 | 82.6 | 13.0 | 4.3 |
Input Costs | 86.9 | 70.0 | 89.1 | 8.7 | 2.2 |
Prices Received for Services | 65.9 | 46.3 | 68.2 | 29.5 | 2.3 |
Operating Margin | 41.9 | 30.0 | 60.5 | 20.9 | 18.6 |
| Indicator | Current Index | Previous Index | % Reporting Improved | % Reporting No Change | % Reporting Worsened |
Company Outlook | 73.1 | 76.3 | 82.9 | 7.3 | 9.8 |
Activity Chart
Comments from Survey Respondents
These comments are from respondents’ completed surveys and have been edited for publication. Comments from the Special Questions survey can be found below the special questions.
Exploration and Production (E&P) Firms
- Labor and equipment shortages, along with inflation in oil country tubular goods and shortages of key equipment and materials, will limit growth in our business and U.S. oil production. In particular, truck drivers are in critical shortage, perhaps due to competition from delivery services.
- The Russian–Ukraine war is going to continue to wreak havoc on markets.
- The Russia–Ukraine conflict is expected to lead to supply shortages of some items needed in oil fields and will also increase lead times. The largest cost increase over the past 12 months for the oil and gas industry is from tubular steel. The inventory has shrunk and lead times have increased. Steel availability and pricing are also delaying quick activity ramp-up among several operators. This is impairing the ability to bring production online faster.
- The competition from large oil and gas companies has not had as much of an impact on drilling and completion costs as it did in prior periods when there were increases in commodity prices. We are maintaining discipline in capital spending to maintain great internal rates of return.
- When a senior member of the administration gets on television and insists green is cheaper, it is clear that the administration is not to be taken seriously. Access to finance remains trying for smaller companies. The talk about price gouging is tiresome. Discussion of federal leases and those leases being unused without an honest discussion about all the constraints and regulatory issues to drill is also unhelpful.
- Considering the international issues generally and with respect to the Russia–Ukraine war, pricing projections for hydrocarbons in any form are highly speculative, at best. As of the date of this survey, the U.S. administration seems unwilling to enable the most immediate and simplistic changes that could increase U.S. hydrocarbon production, or replace Russian hydrocarbons in U.S. consumption with hydrocarbons from sources that do not carry the same level of political, social and economic issues of Russian hydrocarbons.
- Our company’s main concern is the administration’s war on hydrocarbons. Our concern is not only for our company and country, but also for the free world. Europe’s renewable-energy policies and their current energy crises provide a classic example of how good intentions, based on misguided ideologies and unrealistic assumptions, lead to unintended and unfortunate consequences. There is, however, a realistic, proven technology that can decarbonize the electric power generation sector, electrify 270 million vehicles and convert 140 million housing units to all electric, which is nuclear energy. The reality of the U.S. “renewable energy revolution” based on wind, solar and battery storage is a fool’s journey leading down a path paved in trillions of taxpayer dollars, ending [in] a catastrophic waste of time, natural resources and wealth, all to the detriment of society and the environment.
- The sources of capital and debt continue to be limited. Therefore, continued growth is primarily limited by funding options that have abandoned upstream oil and gas as an investment class.
- Elevated geopolitical risk, persistent supply-chain issues, continued labor shortages, shrinking capital availability and rising inflation have impacted the ability of small upstream producers to undertake projects that they would otherwise be readily engaged in at current commodity price levels.
- Due to COVID-19 and economic reasons, the service companies we use are struggling to find or keep current employees working. This causes delays and added expense.
- Rig markets and supply-chain issues will prevent some flexing of budgets to take advantage of higher energy prices.
- Interest expense is going up as the Federal Reserve raises rates. With the “great retirement” ongoing, the error rates of every company we’re involved with—suppliers, vendors, operators, etc.—have increased as newer employees are hired to replace experienced hands. The newer employee attitudes and work ethic seem poor, across the board. Inflation, from office supplies to oilfield tubulars and supplies, is running way beyond 7.9 percent year on year. Washington’s immature “finger-pointing” attitude of blaming the oil industry is sickening and tiring. I wish our administration would wake up and start doing some of the right things. We could use some leadership.
- The current administration will only hurt energy companies, driving up prices and severely affecting the middle guy that drives the economy. We are in for a world of hurt for the next three years.
- The regulatory environment is not friendly.
- The supply-and-demand of oil and gas affects the long-term outlook for our industry. Political and geopolitical effects [impact] the near term, defined as the next one to two years. The renewable-energy policy depends on the party in control.
- The rapid increase in commodity prices has increased oilfield activity significantly.
Oil and Gas Support Services Firms
- The biggest constraint remains finding qualified employees to hire.
- Labor is definitely the growth constraint. We need qualified drivers with a commercial driver’s license, and they are difficult to find and retain.
- The perceived or real anticarbon extraction policies by the administration have limited our customers, the oil companies, from employing the capital necessary to increase production of oil and gas in the U.S., which is the most environmentally responsible producer in the world.
- We are seeing a severe shortage of qualified employees, which is severely impeding our ability to perform our services. The costs of labor are going up at a very steep rate.
- The current quarter or prior quarter should have been an increase in business activity. However, the current quarter was plagued with weather delays, sand delays and frac companies moving start dates. We are getting pricing improvement, but not enough to significantly improve margins. Operators are treating oilfield service companies like oil is still $30 per barrel.
- Commodity prices are a guess with the current turmoil in the markets across the globe.
- There is significant uncertainty due to the ongoing conflict in Ukraine. Geopolitical tensions and increased commodity prices may lead to unprecedented inflation, which may lead to a recession.
- Prices for oil and gas are totally unpredictable now and will remain so in the near future. The price of oil should drift down some as the market “buys the news, sells the event” of forgoing the purchase of oil from the Russians.
- Our company is in the pipe industry and, therefore, we are seeing that steel tariffs and lead times on oil and gas pipe products are major issues currently and stand to hamper the whole industry in regard to increasing output due to international geopolitical instability.
- Items with high-end chips (e.g., switch equipment) are delayed.
- Our onshore U.S. exploration and production customers continue with their cautious and disciplined approach. There is no exploration spending.
- So much uncertainty makes it, for me at least, virtually impossible to predict anything beyond this afternoon. There is uncertainty domestically, globally and regulatorily.
- Energy prices will be on the increase as long as there is conflict with Russia and Ukraine. Should the U.S. get involved, thus entering World War III, I imagine the prices will skyrocket to $200 for West Texas Intermediate and $10 for gas. Jobs have definitely become available.
Questions regarding the Dallas Fed Energy Survey can be addressed to Michael Plante at Michael.Plante@dal.frb.org or Kunal Patel at Kunal.Patel@dal.frb.org.
Sign up for our email alert to be automatically notified as soon as the latest Dallas Fed Energy Survey is released on the web.