Dallas Fed Energy Survey

Oil and Gas Expansion Continues; Cost Pressures, Supply-Chain Delays Persist
Special questions focus on prospects for significant oil market tightening; whether the era of inexpensive U.S. natural gas will end; expectations for financial investors returning to the oil and gas sector; the impact of the increased 45Q tax credit on profitability of proposed carbon capture, utilization and storage projects; and the net firm-level impact of the methane tax in the 2022 Inflation Reduction Act.
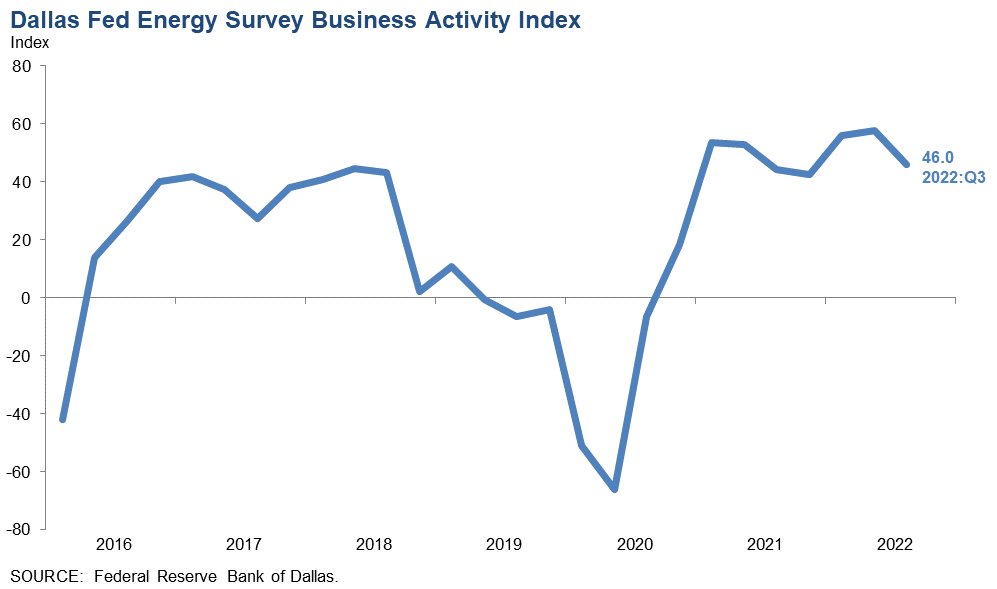
Activity in the oil and gas sector expanded at a strong pace in the third quarter, according to oil and gas executives responding to the Dallas Fed Energy Survey. The business activity index—the survey’s broadest measure of conditions facing Eleventh District energy firms—remained elevated at 46.0 but below the 57.7 record-breaking reading last quarter. This suggests the pace of the expansion decelerated slightly but remains solid.
Oil and natural gas production increased at a similar pace compared with the prior quarter, according to executives at exploration and production (E&P) firms. The oil production index held fairly steady at 31.7 in the third quarter. The natural gas production index was essentially unchanged at 35.6.
Costs increased for a seventh straight quarter, with the indexes near historical highs. Among oilfield services firms, the index for input costs remained elevated but slipped from its series high to 83.9. None of the 58 responding oilfield services firms reported lower input costs. Among E&P firms, the index for finding and development costs was 64.7, down slightly from its high last quarter of 70.6. Additionally, the index for lease operating expenses was 70.2, easing slightly from the high last quarter of 74.1.
It is taking longer for firms to receive materials and equipment. The supplier delivery time index remained elevated at 28.4 in the third quarter, down slightly from a series high of 31.9 in the second quarter. Among oilfield service firms, the measure of lag time in delivery of services declined from 36.0 to 21.1 but remained well above average.
Oilfield services firms reported broad-based improvement, with key indicators remaining in solidly positive territory. The equipment utilization index remained elevated but fell from 66.7 in the second quarter to 55.2 in the third. The operating margin index remained positive but declined from 32.7 to 25.4. The index of prices received for services inched higher, from 62.7 to 64.9—a record high.
All labor market indexes in the third quarter remained elevated, pointing to strong growth in employment, hours and wages. The aggregate employment index posted a seventh consecutive positive reading, increasing from 22.6 in the second quarter to a record 30.0. The aggregate employee hours index was 33.3, close to its historical high. The aggregate wages and benefits index remained elevated and was largely unchanged at 47.3.
Optimism waned somewhat this quarter as the company outlook index posted a ninth consecutive positive reading but fell 33 points to 33.1. The overall outlook uncertainty index jumped from 12.4 to 35.7, suggesting uncertainty became much more pronounced this quarter, especially among E&P firms. The uncertainty index was 17.8 for services firms versus 45.2 for E&P firms, with 53 percent of E&P firms reporting an increase in uncertainty.
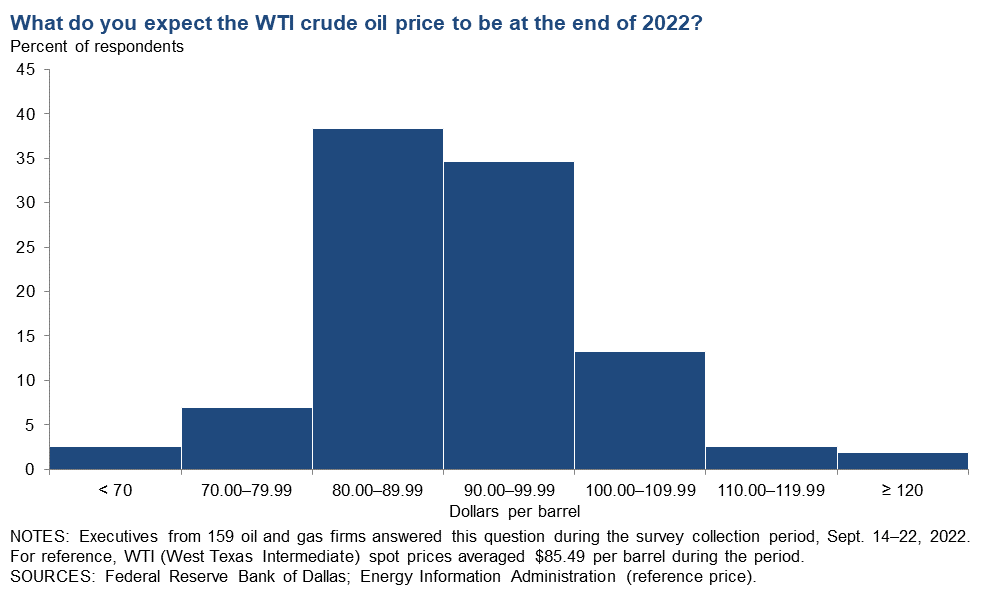
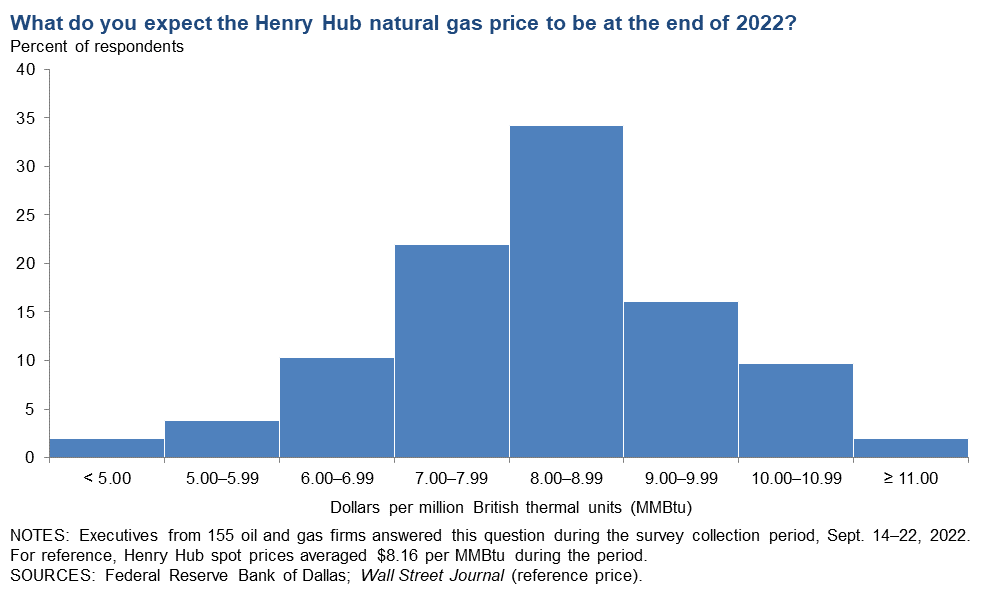
On average, respondents expect a West Texas Intermediate (WTI) oil price of $89 per barrel by year-end 2022; responses ranged from $65 to $122 per barrel. Survey participants expect Henry Hub natural gas prices of $7.97 per million British thermal units (MMBtu) at year-end. For reference, WTI spot prices averaged $85.49 per barrel during the survey collection period, and Henry Hub spot prices averaged $8.16 per MMBtu.
Next release: December 29, 2022
Data were collected Sept. 14–22, and 163 energy firms responded. Of the respondents, 85 were exploration and production firms and 52 were oilfield services firms.
The Dallas Fed conducts the Dallas Fed Energy Survey quarterly to obtain a timely assessment of energy activity among oil and gas firms located or headquartered in the Eleventh District. Firms are asked whether business activity, employment, capital expenditures and other indicators increased, decreased or remained unchanged compared with the prior quarter and with the same quarter a year ago. Survey responses are used to calculate an index for each indicator. Each index is calculated by subtracting the percentage of respondents reporting a decrease from the percentage reporting an increase. When the share of firms reporting an increase exceeds the share reporting a decrease, the index will be greater than zero, suggesting the indicator has increased over the previous quarter. If the share of firms reporting a decrease exceeds the share reporting an increase, the index will be below zero, suggesting the indicator has decreased over the previous quarter.
Price Forecasts
West Texas Intermediate Crude
| West Texas Intermediate crude oil price (dollars per barrel), year-end 2022 | ||||
| Indicator | Survey Average | Low Forecast | High Forecast | Price During Survey |
Current quarter | $88.74 | $65.00 | $122.00 | $85.49 |
Prior quarter | $107.93 | $65.00 | $160.00 | $119.56 |
| NOTE: Price during survey is an average of daily spot prices during the survey collection period. SOURCES: Energy Information Administration; Federal Reserve Bank of Dallas. | ||||
Henry Hub Natural Gas
| Henry Hub natural gas price (dollars per MMBtu), year-end 2022 | ||||
| Indicator | Survey Average | Low Forecast | High Forecast | Price During Survey |
Current quarter | $7.97 | $3.80 | $12.50 | $8.16 |
Prior quarter | $7.55 | $2.90 | $12.00 | $8.38 |
| NOTE: Price during survey is an average of daily spot prices during the survey collection period. SOURCES: Federal Reserve Bank of Dallas; Wall Street Journal. | ||||
Special Questions
Data were collected Sept. 14–22; 153 oil and gas firms responded to the special questions survey.
All Firms
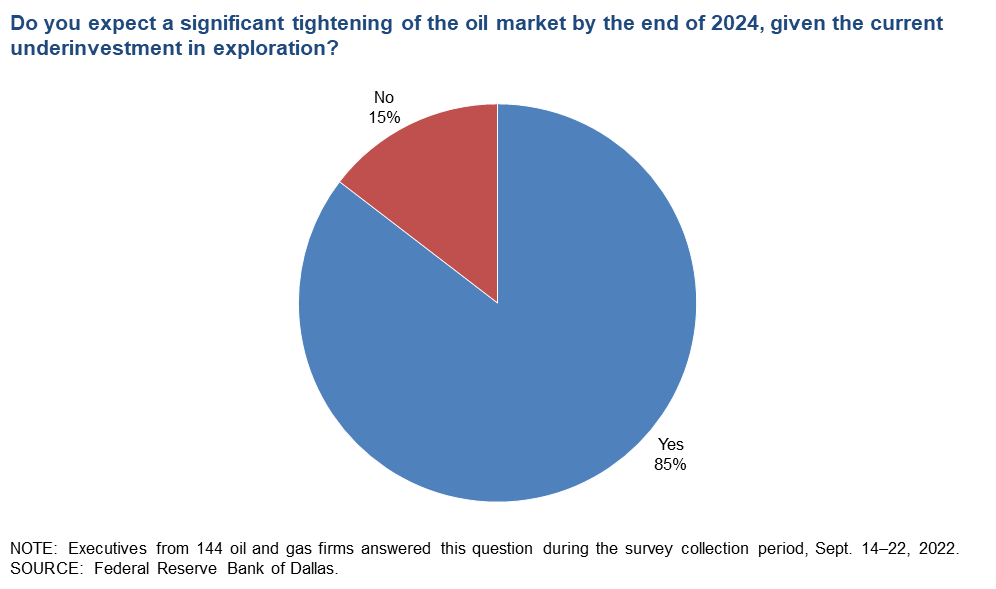
Do you expect a significant tightening of the oil market by the end of 2024, given the current underinvestment in exploration?
Eighty-five percent of executives said they expect a significant tightening of the oil market by the end of 2024.
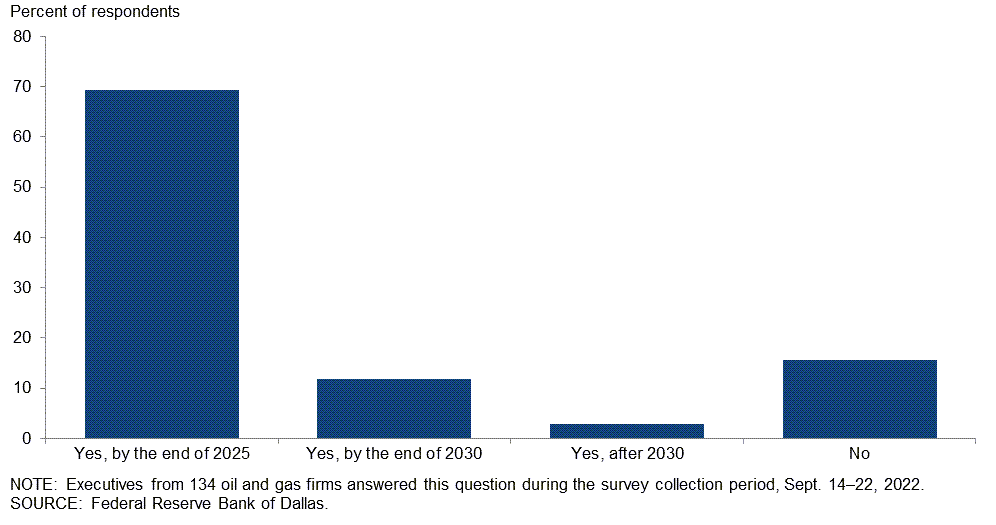
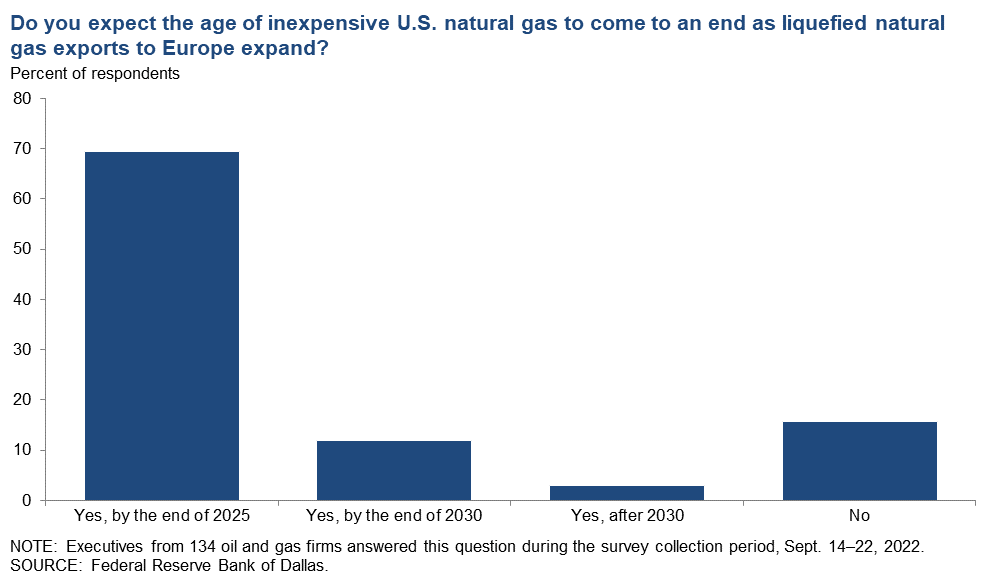
Do you expect the age of inexpensive U.S. natural gas to come to an end as liquefied natural gas exports to Europe expand?
Most executives (69 percent) expect the age of inexpensive U.S. natural gas to end by year-end 2025. An additional 12 percent of executives think it will happen by year-end 2030 and 3 percent expect it to occur after 2030. The remaining 16 percent don’t expect the age of inexpensive U.S. natural gas to end.
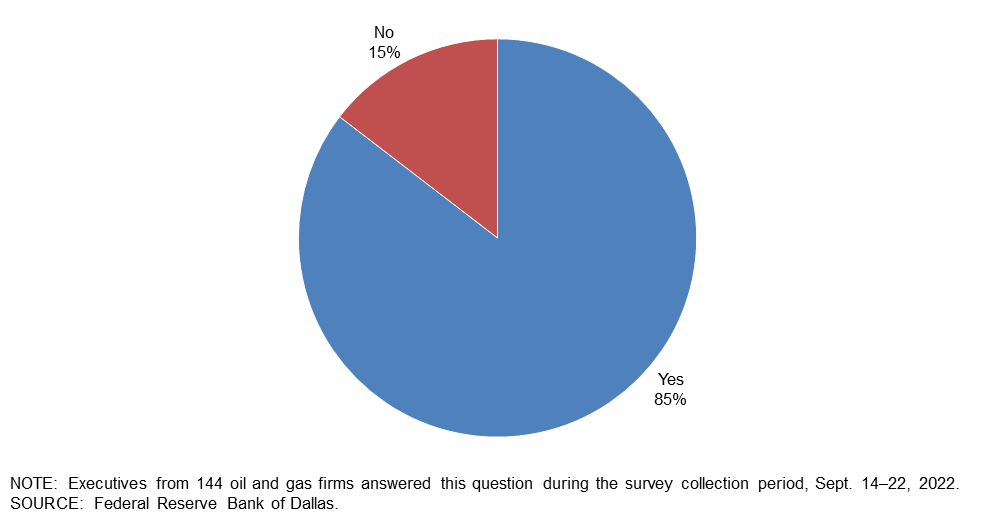
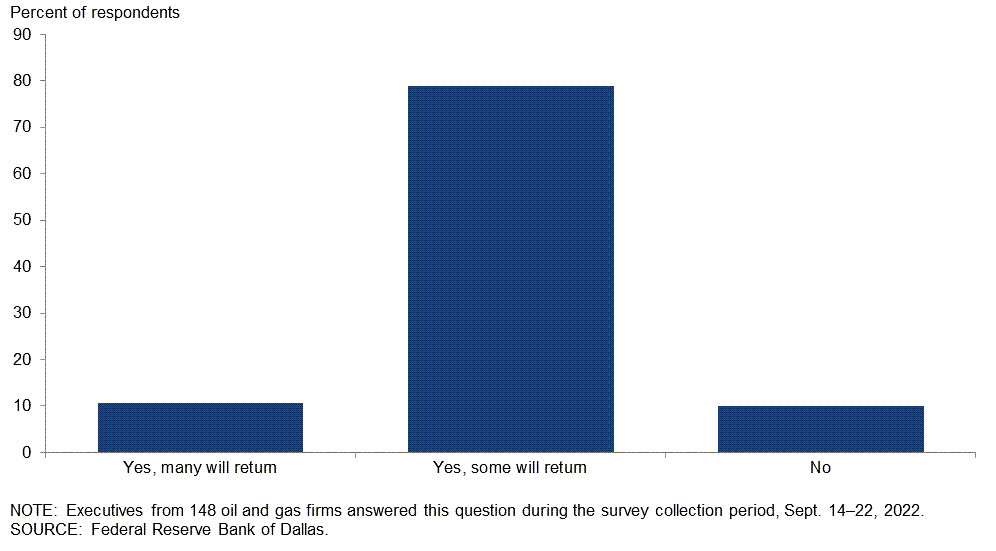
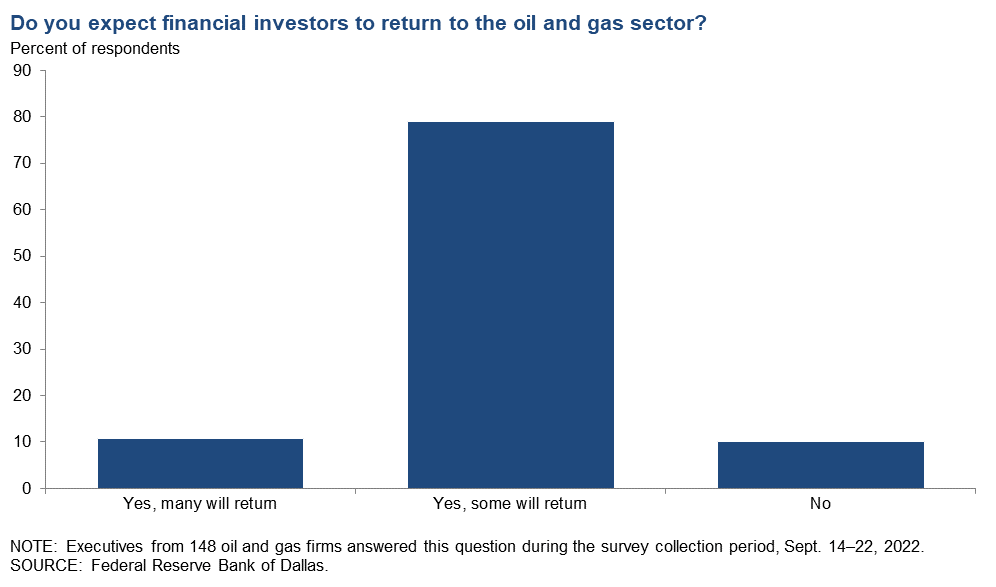
Do you expect financial investors to return to the oil and gas sector?
The majority of the executives—79 percent—said they expect some financial investors to return to the oil and gas sector. Eleven percent expect many will return, while 10 percent expect investors will not return.
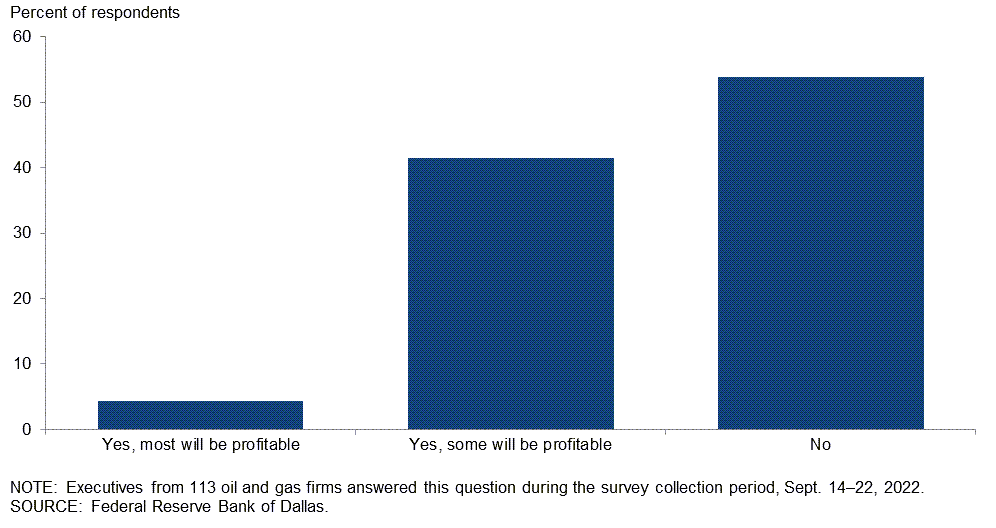
In your opinion, will proposed carbon capture, utilization and storage projects be profitable with the increase in the 45Q tax credit in the 2022 Inflation Reduction Act?
Slightly over half—54 percent—of executives expect most proposed carbon capture, utilization and storage projects won’t be profitable despite the increase in the 45Q tax credit in the 2022 Inflation Reduction Act. Forty-two percent expect some proposed projects to be profitable and 4 percent expect most projects to be profitable.
What net impact will the methane tax in the 2022 Inflation Reduction Act have on your firm?
Most executives expect a negative net impact on their firm from the methane tax in the 2022 Inflation Reduction Act. Forty-eight percent of executives said they think the net impact will be slightly negative, and an additional 14 percent anticipate it will be significantly negative. Thirty-one percent expect a neutral impact. Seven percent anticipate a positive impact.
A breakdown of the data for exploration and production (E&P) versus oil and gas support services can be found in the table below.
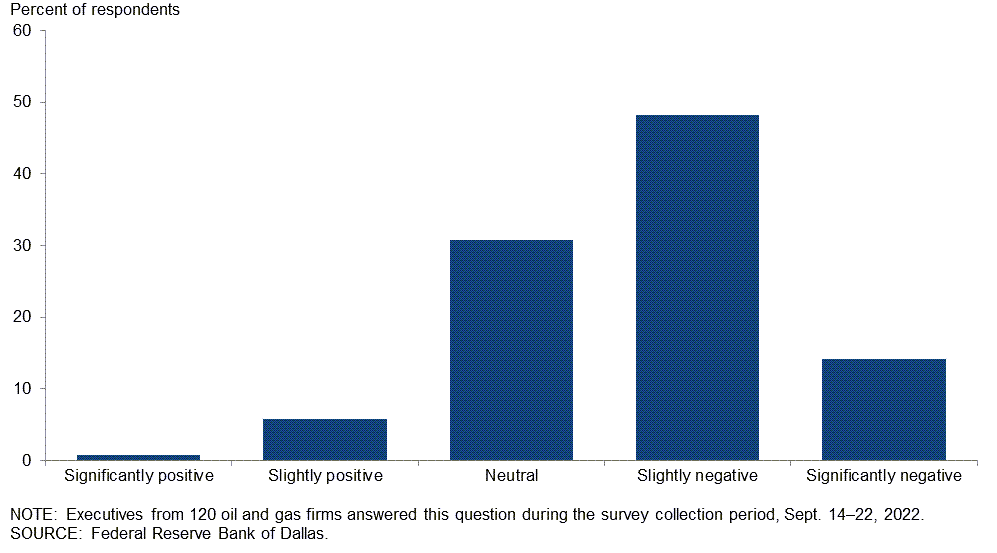
| Response | Percent of respondents (among each group) | ||
| All firms | E&P | Services | |
| Significantly positive | 1 | 1 | 0 |
| Slightly positive | 6 | 3 | 12 |
| Neutral | 31 | 28 | 37 |
| Slightly negative | 48 | 54 | 37 |
| Significantly negative | 14 | 14 | 15 |
| NOTES: Executives from 79 exploration and production firms and 41 oil and gas support services firms answered this question during the survey collection period, Sept. 14–22, 2022. The “All firms” column reports the percentage out of the total 120 responses. Percentages may not sum to 100 due to rounding.. SOURCE: Federal Reserve Bank of Dallas. |
|||
Special Questions Comments
Exploration and Production (E&P) Firms
- Nothing good can come out of the 2022 “Inflation Reduction” Act. I expect the result of that legislation will be an expansion of inflation. Extra taxes on the industry will further dampen the amount of money available to spend on new projects. There is nothing happening in the current administration that would encourage anyone to be in the oil and gas business. And that is exactly what they want. I am seriously questioning whether or not to remain in the oil and gas business.
- Specific contradictory statements and positions by the White House and like-minded politicians following that political agenda are very harmful for our energy security and are undermining the country's ability to help with the needs of allies in Europe and around the world.
- It’s tough to tell where these crosscurrents are headed. On one hand, we don’t know if anyone has noticed, but the two-year to 10-year Treasury yield curve is inverted, implying recession, and China is on lockdown basically every other day, so that means lower prices in the near term (probably). But long-term demand is strong, OPEC is underperforming/cutting output, and substitutes like batteries are becoming more expensive daily (e.g., lithium prices). Shale core exhaustion and inventory concerns are mainstream and well-documented issues. Shale will likely tip over in five years, and U.S. production will be down 20 to 30 percent quickly. When it does—this feels like watching the steam roller scene in Austin Powers. Oil prices in the late 2020s will be something to behold.
- I'm still trying to find out more information on the methane tax in the 2022 Inflation Reduction Act and how it may impact my company. This administration is bent on adding taxes and fees and regulations at an incredible rate and is completely clueless about their impact on the oil and gas industry's ability to deliver the oil and gas that they pontificate that this nation needs.
- As long as the playing field is level, there should be little negative impact to oil and gas from the Inflation Reduction Act. Ideally, a carbon tax should be imposed at the wellhead, mine mouth or port of entry.
- The price of natural gas has increased solely due to the reduction of Russian supplies. The price we have received the past several years has been below replacement cost since the market was flooded with new supply from “growth” companies. I would assume the price will drop very quickly if the Russia‒Ukraine situation is ever resolved. The methane tax is a bureaucratic nightmare to smaller oil and gas companies. The tax will not be as much of a burden as the compliance issues. More regulation results in less productivity. I think it was put in the bill as a retaliation for the high energy prices the world is experiencing. The truth is that oil and gas have brought the economies of the world to the level that we currently enjoy and neither is going to be supplanted anytime soon.
- “Inexpensive” is a subjective view relative to natural gas prices. Over the past five-plus years, natural gas commodity pricing has materially impacted supply much greater than demand in the U.S. This has resulted in abnormally low natural gas pricing over this period. As liquefied natural gas exports grow and natural gas volume growth in the U.S. moderates, natural gas pricing has increased and a new higher-floor pricing has emerged. While this pricing is higher in the U.S. relative to nearly all other areas around the world, U.S. gas consumers (individual and commercial) still enjoy the benefit of lower fuel cost inputs than others. Even at a hypothetical $7 per million British-thermal-units price, U.S. power generation still provides a material cost advantage to U.S. manufacturers. So, yes, it is more apparent that very low natural gas pricing is unlikely to return. However, the U.S. natural gas price for consumers is still highly competitive and in many ways advantageous relative to other western countries. Our supply assurance is materially higher at this still-competitive price.
- Oil and gas industry activity has flatlined. We should incentivize equipment and material manufacturers and suppliers to increase supplies. Sustained double-digit inflation is not the solution for a healthy industry, and projects are becoming uneconomical. A pragmatic energy and environmental solution is required; otherwise, the “first world” can become the “third world” with respect to energy. Nascent energy-transition technologies are too early to be of scale, and the world is starved of the necessary oil and gas expenditure needed for economic development.
- As to the question regarding natural gas, the age of inexpensive gas has already ended.
- In my opinion, our country is on the wrong track concerning carbon capture and climate change. As a trained soil scientist, [I think] there is twice as much carbon in the soil as in the atmosphere. The best method to store carbon is in the soil through plant capture of carbon dioxide. Enrichment of soil organic matter would greater benefit agricultural productivity.
- Just as the U.K. has allowed fracking to increase supply, natural gas production will be increased in the U.S. to meet demand. It may take a couple of years, but certainly [it should happen] by 2030.
Oil and Gas Support Services Firms
- August revenues were the best month for our company since before COVID-19. Hopefully, we will finish out super strong in the fourth quarter as well.
- Carbon capture, utilization and storage (CCUS) will cost more than $300 per metric ton. An $85-per-metric-ton tax credit will not come close to making these facilities profitable. A unified multinational carbon trading platform could help to stabilize the value of carbon captured, but this will require significant new definitions on how to measure and regulate the carbon sequestered. This might be more impactful, but still very difficult.
- The question regarding expectations of a significant tightening of the oil market by the end of 2024 is an interesting question, and I wonder why you've chosen 2024. I believe the market is already "tight," and I struggle to understand why spot oil prices are as low as they are today and why there is still backwardation in the forward curve. It appears to me that the world is very short on supply, with big draws in Organization for Economic Cooperation and Development inventories still taking place even after a significant increase (and now leveling off) in North American drilling and completion activity. Additional reasons include China still enforcing an unsustainable zero COVID-19 policy that will drive up demand once removed, more Russian barrels that will likely be coming off the market, and OPEC effectively acknowledging for the first time ever that there is no spare capacity.
- CCUS is driving our seismic licensing business at this time. We expect some improvement in the E&P business as investment in oil and gas exploration and drilling will need to improve in the near term and into the future.
- If market forces are allowed to work, U.S. natural gas supply will be able to supply Europe and the U.S. as we continue to expand the use of this natural resource as a viable transition fuel.
- On the question regarding natural gas, it depends on whether we can build more pipelines to move natural gas from the northeast to the Gulf Coast for exportation.
Additional Comments »
Historical data are available from first quarter 2016 to the most current release quarter.
Business Indicators: Quarter/Quarter
| Business Indicators: All Firms Current Quarter (versus previous quarter) | |||||
| Indicator | Current Index | Previous Index | % Reporting Increase | % Reporting No Change | % Reporting Decrease |
Level of Business Activity | 46.0 | 57.7 | 50.9 | 44.2 | 4.9 |
Capital Expenditures | 47.3 | 52.5 | 57.7 | 31.9 | 10.4 |
Supplier Delivery Time | 28.4 | 31.9 | 42.6 | 43.2 | 14.2 |
Employment | 30.0 | 22.6 | 33.7 | 62.6 | 3.7 |
Employee Hours | 33.3 | 31.4 | 35.2 | 63.0 | 1.9 |
Wages and Benefits | 47.3 | 48.6 | 48.5 | 50.3 | 1.2 |
| Indicator | Current Index | Previous Index | % Reporting Improved | % Reporting No Change | % Reporting Worsened |
Company Outlook | 33.1 | 65.9 | 45.2 | 42.7 | 12.1 |
| Indicator | Current Index | Previous Index | % Reporting Increase | % Reporting No Change | % Reporting Decrease |
Uncertainty | 35.7 | 12.4 | 46.3 | 43.1 | 10.6 |
| Business Indicators: E&P Firms Current Quarter (versus previous quarter) | |||||
| Indicator | Current Index | Previous Index | % Reporting Increase | % Reporting No Change | % Reporting Decrease |
Level of Business Activity | 37.2 | 49.4 | 42.9 | 51.4 | 5.7 |
Oil Production | 31.7 | 32.6 | 45.2 | 41.3 | 13.5 |
Natural Gas Wellhead Production | 35.6 | 35.3 | 45.2 | 45.2 | 9.6 |
Capital Expenditures | 47.6 | 48.2 | 58.1 | 31.4 | 10.5 |
Expected Level of Capital Expenditures Next Year | 43.8 | 54.2 | 53.3 | 37.1 | 9.5 |
Supplier Delivery Time | 27.9 | 26.2 | 45.2 | 37.5 | 17.3 |
Employment | 17.2 | 13.0 | 21.0 | 75.2 | 3.8 |
Employee Hours | 20.2 | 20.0 | 22.1 | 76.0 | 1.9 |
Wages and Benefits | 38.0 | 36.9 | 39.0 | 60.0 | 1.0 |
Finding and Development Costs | 64.7 | 70.6 | 65.7 | 33.3 | 1.0 |
Lease Operating Expenses | 70.2 | 74.1 | 73.1 | 24.0 | 2.9 |
| Indicator | Current Index | Previous Index | % Reporting Improved | % Reporting No Change | % Reporting Worsened |
Company Outlook | 25.0 | 63.3 | 39.0 | 47.0 | 14.0 |
| Indicator | Current Index | Previous Index | % Reporting Increase | % Reporting No Change | % Reporting Decrease |
Uncertainty | 45.2 | 21.2 | 52.9 | 39.4 | 7.7 |
| Business Indicators: O&G Support Services Firms Current Quarter (versus previous quarter) | |||||
| Indicator | Current Index | Previous Index | % Reporting Increase | % Reporting No Change | % Reporting Decrease |
Level of Business Activity | 62.1 | 71.2 | 65.5 | 31.0 | 3.4 |
Utilization of Equipment | 55.2 | 66.7 | 58.6 | 37.9 | 3.4 |
Capital Expenditures | 46.6 | 59.6 | 56.9 | 32.8 | 10.3 |
Supplier Delivery Time | 29.3 | 41.1 | 37.9 | 53.4 | 8.6 |
Lag Time in Delivery of Firm's Services | 21.1 | 36.0 | 24.6 | 71.9 | 3.5 |
Employment | 53.5 | 38.5 | 56.9 | 39.7 | 3.4 |
Employment Hours | 56.9 | 50.0 | 58.6 | 39.7 | 1.7 |
Wages and Benefits | 63.8 | 67.3 | 65.5 | 32.8 | 1.7 |
Input Costs | 83.9 | 88.0 | 83.9 | 16.1 | 0.0 |
Prices Received for Services | 64.9 | 62.7 | 66.7 | 31.6 | 1.8 |
Operating Margin | 25.4 | 32.7 | 43.6 | 38.2 | 18.2 |
| Indicator | Current Index | Previous Index | % Reporting Improved | % Reporting No Change | % Reporting Worsened |
Company Outlook | 47.3 | 70.0 | 56.1 | 35.1 | 8.8 |
| Indicator | Current Index | Previous Index | % Reporting Increase | % Reporting No Change | % Reporting Decrease |
Uncertainty | 17.8 | –1.9 | 33.9 | 50.0 | 16.1 |
Business Indicators: Year/Year
| Business Indicators: All Firms Current Quarter (versus same quarter a year ago) | |||||
| Indicator | Current Index | Previous Index | % Reporting Increase | % Reporting No Change | % Reporting Decrease |
Level of Business Activity | 66.0 | 66.2 | 72.4 | 21.2 | 6.4 |
Capital Expenditures | 69.6 | 64.3 | 76.1 | 17.4 | 6.5 |
Supplier Delivery Time | 39.3 | 49.2 | 58.7 | 21.9 | 19.4 |
Employment | 39.4 | 27.9 | 45.2 | 49.0 | 5.8 |
Employee Hours | 42.5 | 38.2 | 46.4 | 49.7 | 3.9 |
Wages and Benefits | 63.2 | 65.7 | 67.1 | 29.0 | 3.9 |
| Indicator | Current Index | Previous Index | % Reporting Improved | % Reporting No Change | % Reporting Worsened |
Company Outlook | 66.6 | 80.9 | 74.1 | 18.4 | 7.5 |
| Business Indicators: E&P Firms Current Quarter (versus same quarter a year ago) | |||||
| Indicator | Current Index | Previous Index | % Reporting Increase | % Reporting No Change | % Reporting Decrease |
Level of Business Activity | 55.5 | 55.3 | 63.6 | 28.3 | 8.1 |
Oil Production | 49.0 | 48.7 | 58.2 | 32.7 | 9.2 |
Natural Gas Wellhead Production | 46.4 | 45.4 | 53.6 | 39.2 | 7.2 |
Capital Expenditures | 69.4 | 62.3 | 76.5 | 16.3 | 7.1 |
Expected Level of Capital Expenditures Next Year | 58.8 | 63.6 | 67.0 | 24.7 | 8.2 |
Supplier Delivery Time | 41.8 | 50.0 | 61.2 | 19.4 | 19.4 |
Employment | 27.6 | 16.7 | 32.7 | 62.2 | 5.1 |
Employee Hours | 28.2 | 25.6 | 31.3 | 65.6 | 3.1 |
Wages and Benefits | 58.6 | 58.4 | 61.6 | 35.4 | 3.0 |
Finding and Development Costs | 78.8 | 79.5 | 79.8 | 19.2 | 1.0 |
Lease Operating Expenses | 85.9 | 77.3 | 86.9 | 12.1 | 1.0 |
| Indicator | Current Index | Previous Index | % Reporting Improved | % Reporting No Change | % Reporting Worsened |
Company Outlook | 63.1 | 82.7 | 69.6 | 23.9 | 6.5 |
| Business Indicators: O&G Support Services Firms Current Quarter (versus same quarter a year ago) | |||||
| Indicator | Current Index | Previous Index | % Reporting Increase | % Reporting No Change | % Reporting Decrease |
Level of Business Activity | 84.2 | 82.3 | 87.7 | 8.8 | 3.5 |
Utilization of Equipment | 82.5 | 73.5 | 86.0 | 10.5 | 3.5 |
Capital Expenditures | 70.1 | 67.3 | 75.4 | 19.3 | 5.3 |
Supplier Delivery Time | 35.1 | 48.0 | 54.4 | 26.3 | 19.3 |
Lag Time in Delivery of Firm's Services | 33.9 | 40.8 | 39.3 | 55.4 | 5.4 |
Employment | 59.7 | 45.1 | 66.7 | 26.3 | 7.0 |
Employment Hours | 66.6 | 58.0 | 71.9 | 22.8 | 5.3 |
Wages and Benefits | 71.4 | 76.4 | 76.8 | 17.9 | 5.4 |
Input Costs | 92.6 | 89.8 | 92.6 | 7.4 | 0.0 |
Prices Received for Services | 82.5 | 76.0 | 82.5 | 17.5 | 0.0 |
Operating Margin | 52.8 | 50.0 | 67.9 | 17.0 | 15.1 |
| Indicator | Current Index | Previous Index | % Reporting Improved | % Reporting No Change | % Reporting Worsened |
Company Outlook | 72.7 | 78.3 | 81.8 | 9.1 | 9.1 |
Activity Chart
Comments from Survey Respondents
These comments are from respondents’ completed surveys and have been edited for publication. Comments from the Special Questions survey can be found below the special questions.
Exploration and Production (E&P) Firms
- The cost of supplies and wait times for delivery have increased substantially.
- The availability of services and supplies is the chief constraint on expanding my business.
- The labor issue will provide a restraint on any major increase in oil and gas production for the domestic market―this, as well as the regulations from the present administration as they chase green energy policy. Permitting, soaring materials costs and the negative propaganda from the federal government will suppress most sources of outside capital to increase production. Now, with our oil storage depleted for political gain, oil replacement will further stress supply.
- The uncertainty over future inflation and/or a recession weighs heavily upon us. The executive branch’s policy toward the E&P industry is also a serious overhang. Poor energy policy from the executive branch may, in the short run, be good for our business but bad for our country.
- No one is interested in giving capital to E&P firms. It’s wonderful news for long-term prices.
- Uncertainty on the political front continues to be a major concern. The withdrawal of leases that have already been issued is an example. Inflationary pressure is eating significantly into discretionary cash flow, limiting the amount of money allocated to new projects.
- The biggest challenge for us is adding employees. We are trying to add qualified staff, with little success, and that will negatively impact growth. Second is the rising cost of services.
- The biggest issue we have in our industry is the federal government, which advocates for our extinction. This has affected our ability to hire new, young talent from colleges because they’ve been brainwashed into believing that our industry is bad and that our industry is disappearing, with no future for them. This will be an issue in our industry and the public will pay with higher commodity costs. The capital being chased out of our industry is leading to less supply, and that always leads to higher prices.
- We are having a hard time with rig availability and supplies.
- Oilfield service inflation has increased, uncertainty has increased and oil prices have decreased. This is a recipe for lower to flat industry spending in 2023.
- The biggest issue that our company is facing is a shortage of personnel and equipment from our oilfield service vendors. Another impediment is a shortage of steel tubulars and a corresponding increase in their price. Most tubular prices have increased 500–600 percent from two to three years ago, and that is if you can find them. This will definitely affect smaller producers and will ultimately cause many stripper wells to be shut-in and delay the drilling of many new wells unless it is resolved soon.
- Power providers continue to be a material source of potential project delay. The overall supply-chain pressures are more stable today than in the second quarter but remain at a challenging level overall. Steel tubular products are at or above all-time highs in terms of cost due to lack of manufacturing capacity in the market. As goods and services cost pressures continue to move upward and commodity prices moderate, the outlook for moderated (lower) development activity in 2023 grows. Until the labor market improves and pricing pressures moderate, lower capital investment in new wells becomes a more attractive option.
- I steered my company back into some Permian Basin projects in West Texas, and now the U.S. Environmental Protection Agenda (EPA) is wanting to label the Permian Basin as a “non-compliance” area based upon one air sampling station outside of Carlsbad, New Mexico. The overreach of the federal government never ceases to amaze me. Delays in delivery of contracted frac [hydraulic fracturing] sand, pumps, oil country tubular goods and even drilling rigs are impairing project timing. Worker availability is hampering project timing also, along with a dearth of truckers.
- Extreme volatility in commodity prices causes long-term planning challenges and increases the cost of financial hedging.
- Oilfield service firms’ investment has lagged E&P firms’ investment. It is really tough for smaller operators to fit and squeeze into the oilfield service firms’ schedules, which are dominated by larger companies.
- The government needs to significantly improve permitting and infrastructure.
- Our outlook remains positive but is becoming more uncertain given continued monetary and fiscal tightening coupled with persistent inflationary pressure. If the Federal Reserve overtightens and creates a deep recession, then demand will suffer and, as a result, prices. If, at the same time, inflation is persistent, then drilling economics will suffer as well, setting up a cycle of extreme volatility. We are counting on OPEC+ to put a floor on oil prices in order to maintain stability in the global oil markets.
- Senseless political stances such as the administration’s weaponizing and undermining of the U.S. Bureau of Land Management leasing and Gulf Coast licensing rounds, as well as one governor’s arbitrary dictations, represent a terrible step forward. The policies are not helpful in achieving any positive effect for their agendas in the short or long term but are proffered simply for votes. The current political pandering for votes sets dangerous precedents for our ongoing operations and the success of the entire industry.
- The administration is trying their best to destroy our energy economy.
- Increased capital expenditures are due more to higher costs than to more activity.
- It is safe to assume that there will be volatility in all energy markets. The variables are almost uniformly political, supply, military and lack of available capital for development from traditional sources.
- Cost inflation and increased delivery/contractor arrival times to complete wells are affecting our business. Oil and gas price volatility, regulatory uncertainty and higher costs of compliance are negatively impacting our planning and execution.
- The probability of a worldwide economic recession is casting a long shadow on the demand for oil that is offset by the Russia‒Ukraine conflict. Europe will most likely be forced to dramatically increase coal consumption to alleviate natural gas curtailments from Russia. High global interest rates will dampen investor appetite for risk. The unknown outcome of the upcoming midterm elections in the U.S. creates a lot of anxiety in the oil community. Our investment in new projects will await greater clarity of the road ahead.
Oil and Gas Support Services Firms
- The administration's lack of understanding of the oil and gas investment cycle continues to result in inconsistent energy policies that contribute to rising energy costs. This continued inconsistency increases uncertainty and decreases investments in energy infrastructure. We are in an energy death spiral that will lead to higher highs and lower lows. Volatility will increase, and the public is in for a very difficult ride.
- Steel tariffs and import quotas are adversely affecting our business. We desperately need additional tubulars (casing) to be made available to the market. Numerous customers have delayed drilling due to the price of oil country tubular goods.
- The administration is holding us back, with no love of oil.
- With activity increasing, it is a battle to cover input cost inflation with price increases. We are experiencing two steps forward, one step back, on product pricing to our clients, and that is affecting our margins.
- The U.S. EPA and other regulatory agencies are being used as a tool to constrain the domestic supply of critical hydrocarbon production as we are promising politically to stand by our allies’ quest to choke off the supply of Russian hydrocarbon imports. It is very difficult to square up.
- Cement supply issues finally seem to be getting a little better. Large cement plants (owned by others) have been getting cut off due to instability of the electric grid, which doesn't help.
- I think it’s really a waiting game on how businesses and the market react to the Federal Reserve interest rate hikes. We all know that interest rates are going up more. So, I’m not sure why it seems to surprise people. This should be baked into our models by now. The biggest thing for our business is whether we can have a soft landing recession-wise. That's the only thing that could really adversely impact our growth, absent something more catastrophic (of course).
- Issues with specialty components continue to cause difficulty. Emissions components will fail and have eight- to 12-week backorder delays. Without these components, equipment is idle. The purchase of high-horsepower diesel engines (800–1200 horsepower) is very difficult, if not impossible, to source. Lead times for large construction equipment remain very delayed, for four to 10 months. Bank financing has not been an issue for operational lines or for purchases. Labor for trucking and skilled construction positions is difficult to source.
- Meeting demand has been hampered by the availability of qualified people to work and, more importantly, whether they stay working in the oilfield. We are seeing a greater percentage of hires, who are new to the industry as of last quarter, with many wanting regular hours and a work/life balance not typical of hourly employees in oilfield services.
- Uncertainty is rampant because of the capital necessary to redeploy and upgrade equipment, with no long-term contracts to support the expenditures. Wages are at all-time highs with continual upward pressure. Technical services and support are strained and delayed. Spare parts are becoming very scarce.
- We continue to struggle to hire drivers with a commercial driver’s license that have oilfield experience, as well as skilled crew labor for construction and maintenance.
- As always, the prices of oil and natural gas are all over the roulette wheel. There are so many factors in play that petroleum product prices are nothing more than a guess.
- The supply chain is slowly improving, but it’s still far from prepandemic levels. We still see significant lead times for electrical equipment, heavy industrial items and refined petroleum products. Labor shortages will continue to drive up wages as competition for skilled workers continues to increase. There simply are not enough skilled workers for the positions available.
- Once the midterm elections are over, we expect the energy market to return to fundamentals rather than being manipulated by the current administration in an effort to gain votes.
Questions regarding the Dallas Fed Energy Survey can be addressed to Michael Plante at Michael.Plante@dal.frb.org or Kunal Patel at Kunal.Patel@dal.frb.org.
Sign up for our email alert to be automatically notified as soon as the latest Dallas Fed Energy Survey is released on the web.