Dallas Fed Energy Survey

Oil and gas activity flat; cost increases continue but moderate
Special questions this quarter focus on firms’ cost expectations for the year, the impact of tightening credit conditions on firms and their outlook, how global oil consumption is performing against expectations, and the likelihood that artificial intelligence will replace personnel over the next five years.
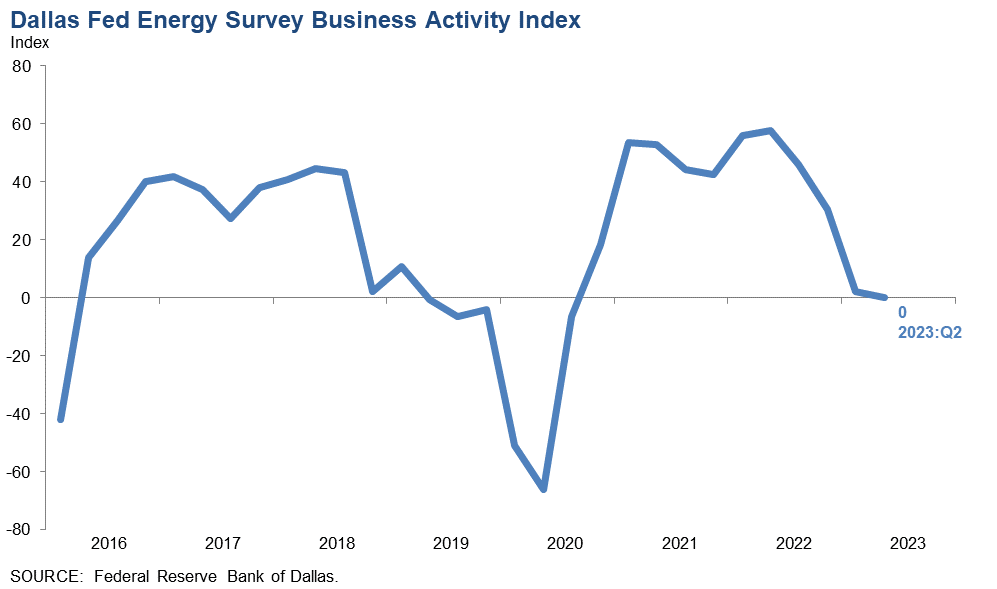
Activity in the oil and gas sector was unchanged in second quarter 2023, according to oil and gas executives responding to the Dallas Fed Energy Survey. The business activity index—the survey’s broadest measure of conditions facing Eleventh District energy firms—edged down to zero in the second quarter from 2.1 in the first.
Oil and natural gas production increased at a slower pace compared with the prior quarter, according to executives at exploration and production (E&P) firms. The oil production index was 8.0 in the second quarter versus 10.5 in the first. Meanwhile, the natural gas production index declined to 2.1 from 7.4.
Firms reported rising costs for a 10th consecutive quarter. While the indexes remain above series averages, the rate of cost increases slowed. Among oilfield services firms, the input cost index remained positive but fell sharply to 41.2 from 61.6. Among E&P firms, the finding and development costs index plummeted to 14.9 from 46.8. Additionally, the lease operating expenses index declined to 26.0 from 37.6.
Oilfield services firms reported deterioration in most indicators. The equipment utilization index turned negative, falling to -7.9 in the second quarter from 3.9 in the first. The operating margin index tumbled to -21.6 from 1.9. The index of prices received for services remained positive but decreased to 3.9 from 25.0.
The aggregate employment index posted a 10th consecutive positive reading and was relatively unchanged at 13.1. Similarly, the aggregate employee hours index was relatively unchanged at 10.5. Meanwhile, the aggregate wages and benefits index declined to 34.5 from 43.6.
The company outlook index remained negative in the second quarter but moved up to -9.1 from -14.1. The overall outlook uncertainty index remained positive but plunged 26 points to 36.9, suggesting that while uncertainty continued to increase on net, fewer firms noted a rise this quarter than last quarter.
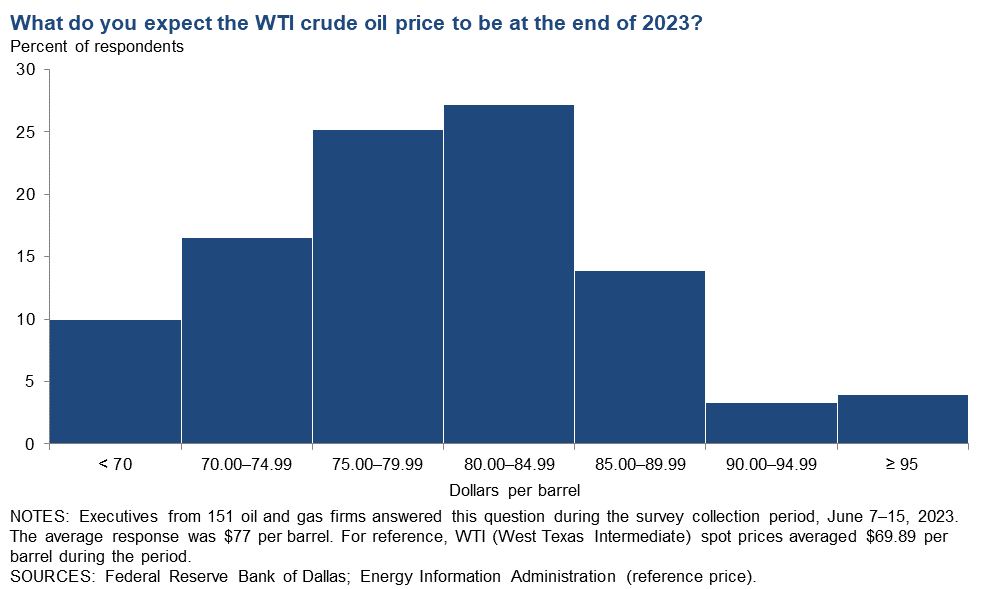
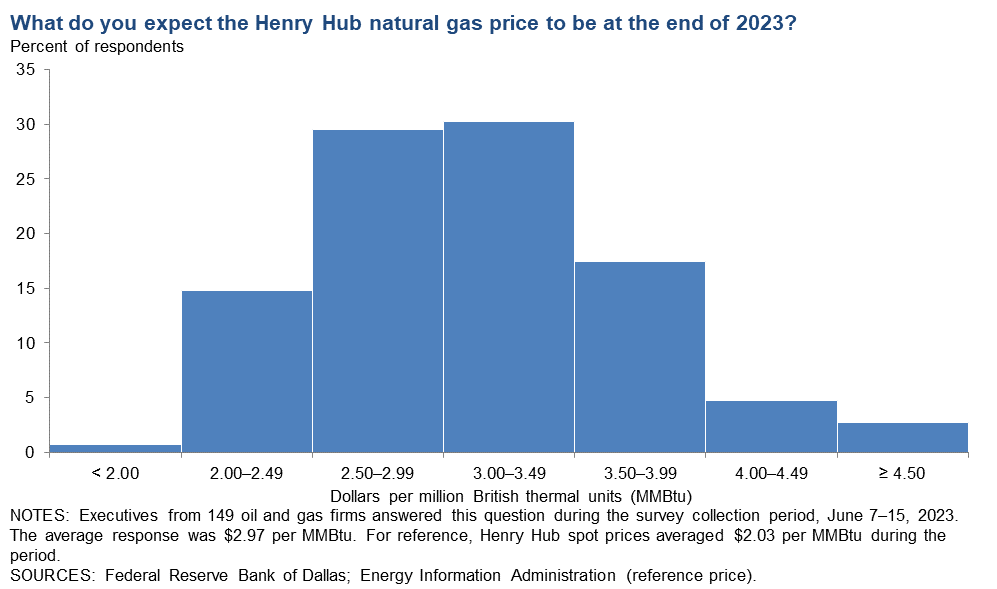
On average, respondents expect a West Texas Intermediate (WTI) oil price of $77 per barrel by year-end 2023; responses ranged from $60 to $100 per barrel. Survey participants expect a Henry Hub natural gas price of $2.97 per million British thermal units (MMBtu) at year-end. For reference, WTI spot prices averaged $69.89 per barrel during the survey collection period, and Henry Hub spot prices averaged $2.03 per MMBtu.
Next release: September 27, 2023
Data were collected June 7–15, and 152 energy firms responded. Of the respondents, 101 were exploration and production firms and 51 were oilfield services firms.
The Dallas Fed conducts the Dallas Fed Energy Survey quarterly to obtain a timely assessment of energy activity among oil and gas firms located or headquartered in the Eleventh District. Firms are asked whether business activity, employment, capital expenditures and other indicators increased, decreased or remained unchanged compared with the prior quarter and with the same quarter a year ago. Survey responses are used to calculate an index for each indicator. Each index is calculated by subtracting the percentage of respondents reporting a decrease from the percentage reporting an increase. When the share of firms reporting an increase exceeds the share reporting a decrease, the index will be greater than zero, suggesting the indicator has increased over the previous quarter. If the share of firms reporting a decrease exceeds the share reporting an increase, the index will be below zero, suggesting the indicator has decreased over the previous quarter.
Price Forecasts
West Texas Intermediate Crude
| West Texas Intermediate crude oil price (dollars per barrel), year-end 2023 | ||||
| Indicator | Survey Average | Low Forecast | High Forecast | Price During Survey |
Current quarter | $77.48 | $60.00 | $100.00 | $69.89 |
Prior quarter | $79.64 | $50.00 | $160.00 | $68.51 |
| NOTE: Price during survey is an average of daily spot prices during the survey collection period. SOURCES: Energy Information Administration; Federal Reserve Bank of Dallas. | ||||
Henry Hub Natural Gas
| Henry Hub natural gas price (dollars per MMBtu), year-end 2023 | ||||
| Indicator | Survey Average | Low Forecast | High Forecast | Price During Survey |
Current quarter | $2.97 | $1.80 | $6.00 | $2.03 |
Prior quarter | $3.43 | $1.75 | $12.50 | $2.23 |
| NOTE: Price during survey is an average of daily spot prices during the survey collection period. SOURCES: Federal Reserve Bank of Dallas; Energy Information Administration. | ||||
Special Questions
Data were collected June 7–15; 147 oil and gas firms responded to the special questions survey.
Exploration and Production (E&P) Firms
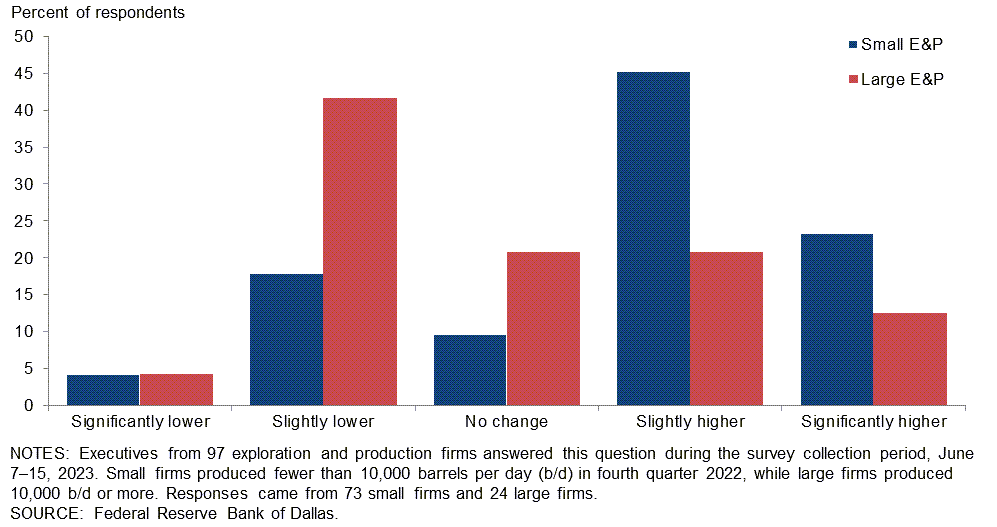
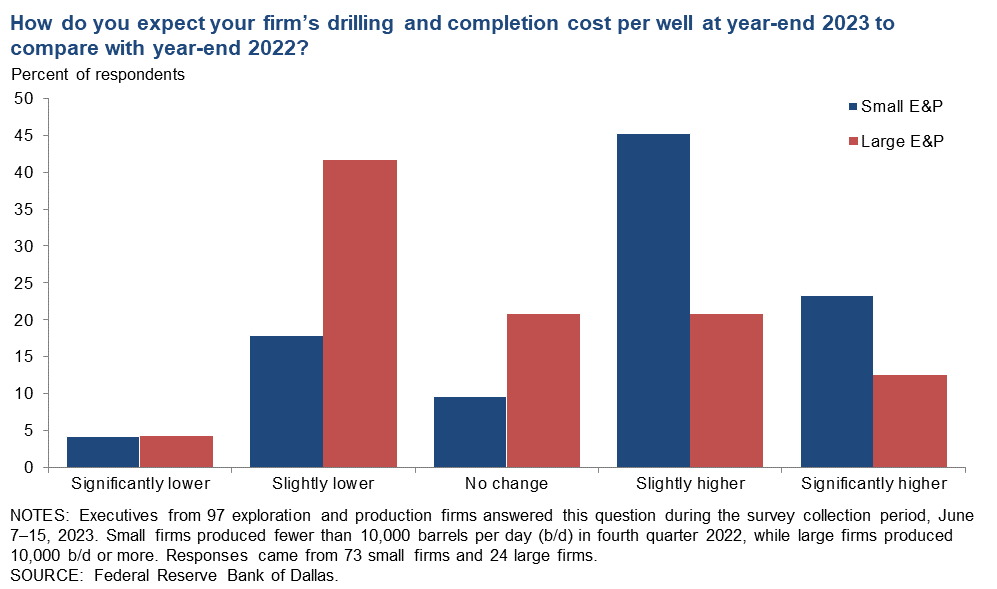
How do you expect your firm’s drilling and completion cost per well at year-end 2023 to compare with year-end 2022?
Firms were classified as “small” if they produced fewer than 10,000 barrels per day (b/d) or “large” if they produced 10,000 b/d or more. In the U.S., small E&P firms are greater in number, but large E&P firms make up the majority of production (more than 80 percent). A breakdown of the data is shown below.
Across all firms, 60 percent of executives expect drilling and completion costs per well to end the year higher than where they were at year-end 2022, while 28 percent expect them to be lower. Twelve percent expect no change.
Larger firms more often than not expect their drilling and completion costs to be lower at year-end 2023 than year-end 2022. Forty-two percent of executives at larger firms said they expect their firm’s drilling and completion costs per well to be slightly lower, with another 4 percent expecting costs will be significantly lower. Twenty-one percent expect no change, while 21 percent anticipate slightly higher and 13 percent significantly higher costs.
On the other hand, smaller firms on net anticipate their drilling and completion costs at year-end 2023 to be above where those costs were at year-end 2022. Among these firms, 45 percent expect costs to end the year slightly higher and 23 percent expect them to significantly increase. Only 18 percent anticipate slightly lower costs, and 4 percent significantly lower costs.
| Response | Percent of respondents | ||
| All firms | Small E&P | Large E&P | |
| Significantly higher | 21 | 23 | 13 |
| Slightly higher | 39 | 45 | 21 |
| No change | 12 | 10 | 21 |
| Slightly lower | 24 | 18 | 42 |
| Significantly lower | 4 | 4 | 4 |
| NOTES: Executives from 97 exploration and production firms answered this question during the survey collection period, June 7–15, 2023. Small firms produced less than 10,000 barrels per day (b/d) in fourth quarter 2022, while large firms produced 10,000 b/d or more. Responses came from 73 small firms and 24 large firms. Percentages may not sum to 100 due to rounding. SOURCE: Federal Reserve Bank of Dallas. |
|||
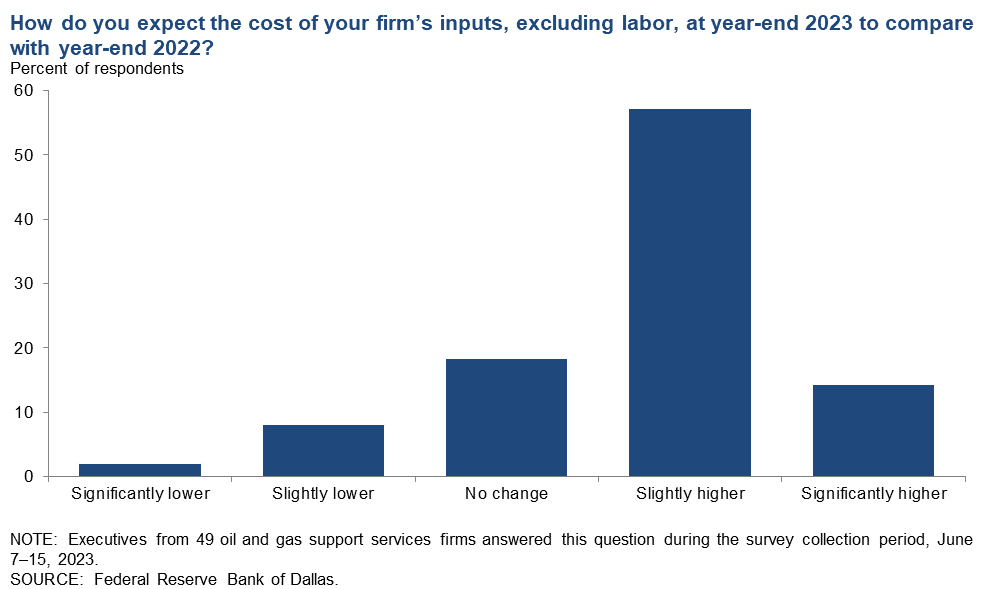
Oil and Gas Support Services
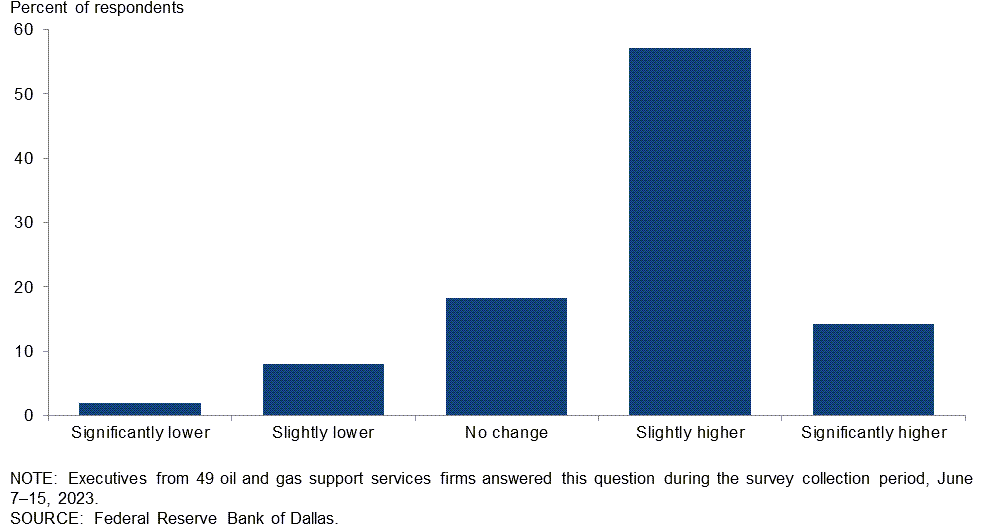
How do you expect the cost of your firm’s inputs, excluding labor, at year-end 2023 to compare with year-end 2022?
Most executives expect the cost of their inputs, excluding labor, to be higher at year-end 2023 relative to year-end 2022. Fifty-seven percent of executives said they expect input costs to be slightly higher, while an additional 14 percent anticipate them to be significantly higher. Eighteen percent expect the costs at year-end 2023 to remain close to year-end 2022 levels. Only 10 percent anticipate lower costs in 2023.
All Firms
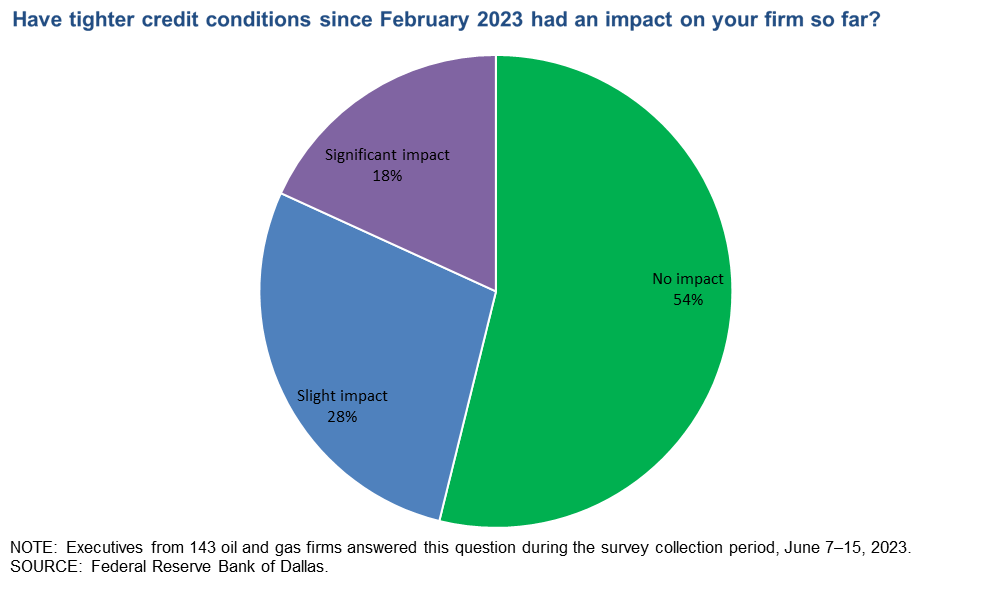
Have tighter credit conditions since February 2023 had an impact on your firm so far?
More than half of the executives—54 percent—note that tighter credit conditions since February 2023 have had no effect. Twenty-eight percent reported a slight impact, and 18 percent reported a significant impact.
A breakdown of the data for E&P firms compared with oil and gas support services firms is shown in the table below. Executives from small E&P firms were more likely to report a significant impact than those from large E&P firms or support services firms. Twenty-four percent of small E&P companies reported a significant impact, compared with 8 percent of large E&P companies and 15 percent of support services firms.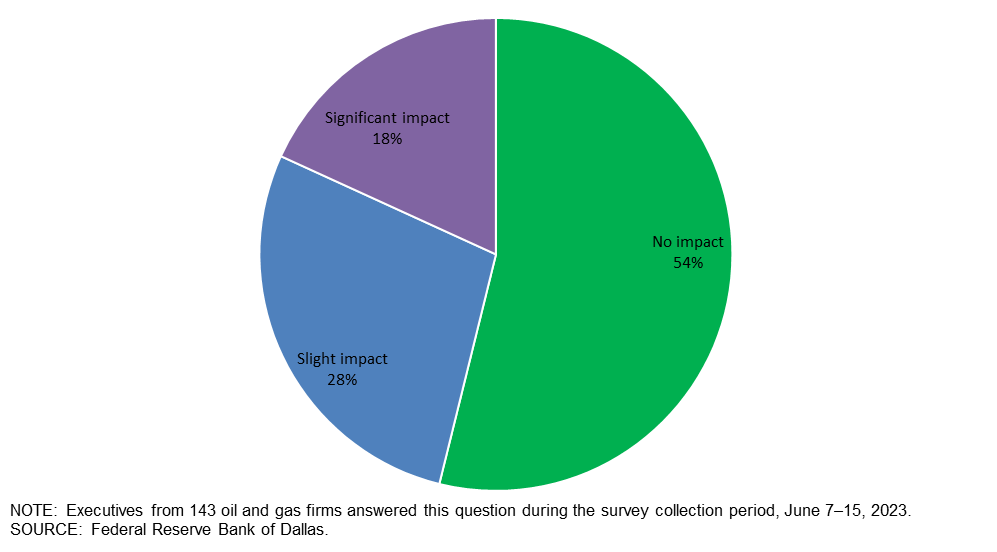
| Response | Percent of respondents | |||
| All firms | Small E&P | Large E&P | Services | |
| No impact | 54 | 58 | 58 | 45 |
| Slight impact | 28 | 18 | 33 | 40 |
| Significant impact | 18 | 24 | 8 | 15 |
NOTES: Executives from 96 exploration and production firms and 47 oil and gas support services firms answered this question during the survey collection period, June 7–15, 2023. Small E&P firms produced fewer than 10,000 barrels per day (b/d) in fourth quarter 2022, while large E&P firms produced 10,000 b/d or more. Responses came from 72 small firms and 24 large firms. Percentages may not sum to 100 due to rounding. |
||||
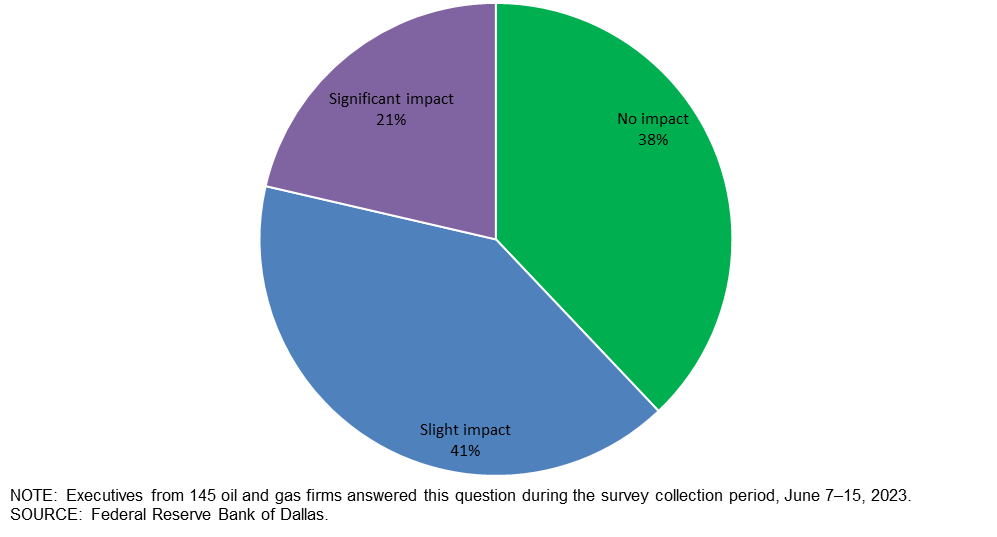
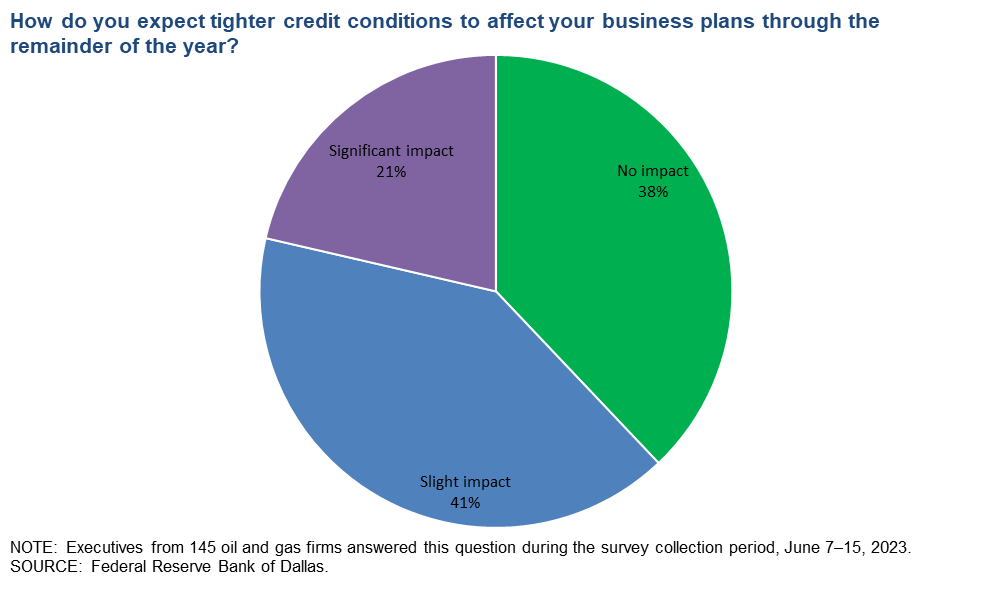
How do you expect tighter credit conditions to affect your business plans through the remainder of the year?
Forty-one percent anticipate that tighter credit conditions will have a slight impact on their business plans through year-end, and 21 percent expect a significant impact. Thirty-eight percent expect that tighter credit conditions won’t affect their business plans.
A breakdown of the data for E&P firms compared with oil and gas support services is shown in the table below. Executives from support services firms and small E&P firms and were more likely to expect significant impacts relative to large E&P firms. Twenty-four percent of support services companies expect a significant impact, compared with 22 percent from small E&P companies and 13 percent for large E&P companies.
| Response | Percent of respondents | |||
| All firms | Small E&P | Large E&P | Services | |
| No impact | 38 | 43 | 38 | 31 |
| Slight impact | 41 | 35 | 50 | 45 |
| Significant impact | 21 | 22 | 13 | 24 |
NOTES: Executives from 96 exploration and production firms and 49 oil and gas support services firms answered this question during the survey collection period, June 7–15, 2023. Small E&P firms produced fewer than 10,000 barrels per day (b/d) in fourth quarter 2022, while large E&P firms produced 10,000 b/d or more. Responses came from 72 small firms and 24 large firms. Percentages may not sum to 100 due to rounding. |
||||
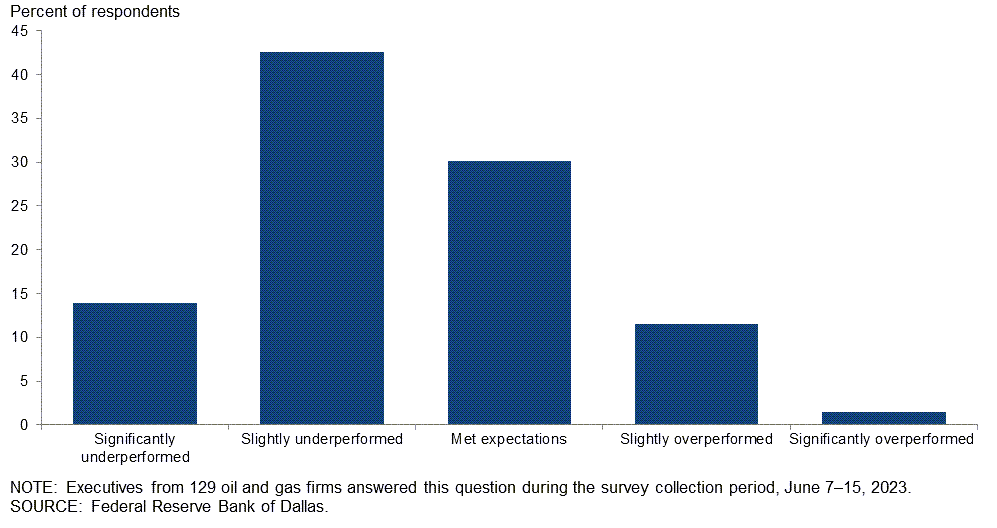
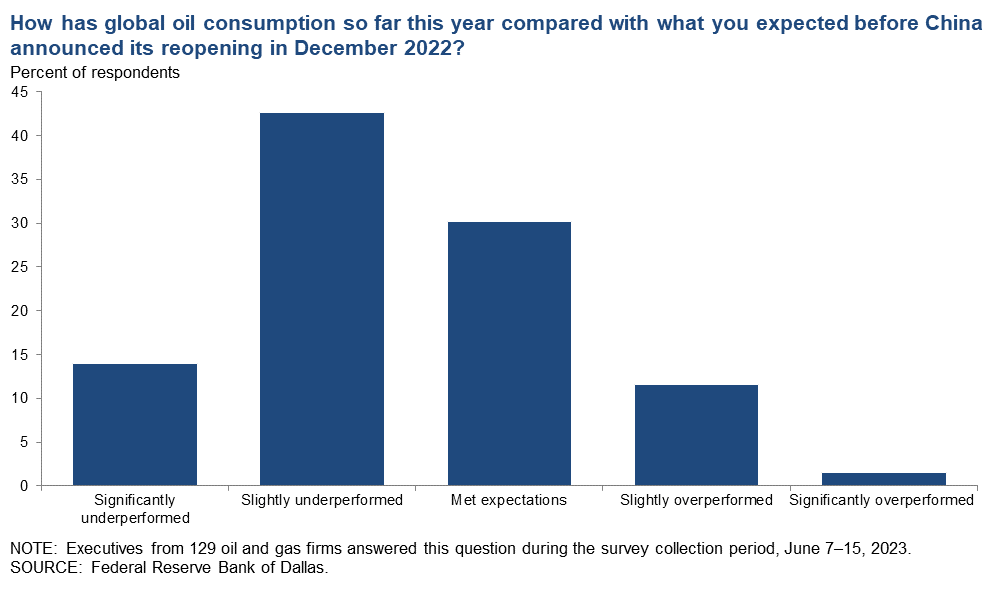
How has global oil consumption so far this year compared with what you expected before China announced its reopening in December 2022?
Forty-three percent of executives said global oil consumption so far this year has slightly underperformed when compared with what they expected before China announced its reopening in December 2022. An additional 14 percent said consumption has significantly underperformed. Thirty percent said consumption has met expectations. Only 14 percent said consumption overperformed.
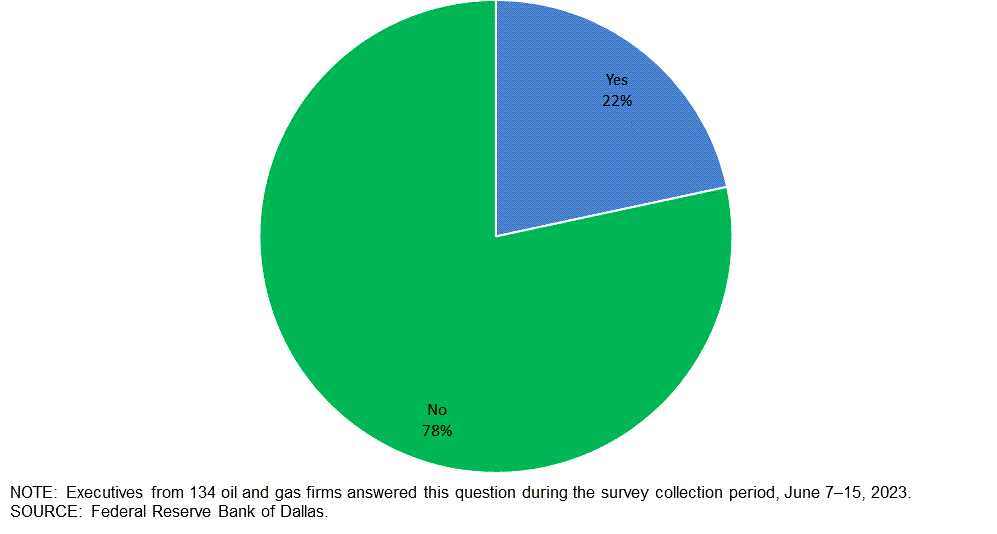
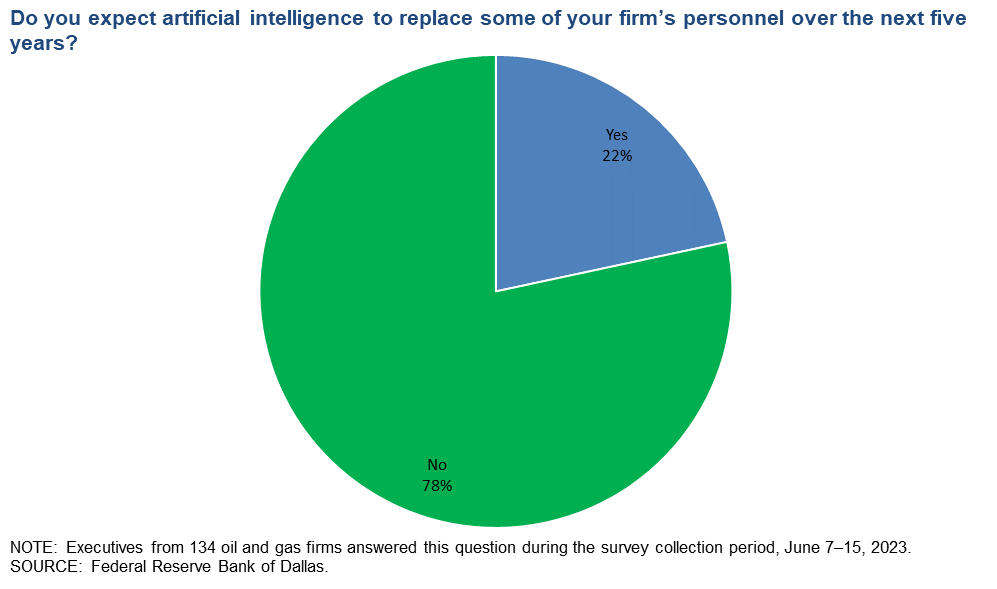
Do you expect artificial intelligence (AI) to replace some of your firm’s personnel over the next five years?
Seventy-eight percent of executives don’t expect artificial intelligence to replace personnel over the next five years. A breakdown of the results is seen in the table below. A significant majority of executives at small E&P companies—84 percent—said they don’t expect AI to replace personnel at their firm. Seventy percent of executives at large E&P companies responded the same, as did 74 percent of support services firms.
| Response | Percent of respondents | |||
| All firms | Small E&P | Large E&P | Services | |
| Yes | 22 | 16 | 30 | 26 |
| No | 78 | 84 | 70 | 74 |
NOTES: Executives from 87 exploration and production firms and 47 oil and gas support services firms answered this question during the survey collection period, June 7–15, 2023. Small E&P firms produced fewer than 10,000 barrels per day (b/d) in fourth quarter 2022, while large E&P firms produced 10,000 b/d or more. Responses came from 67 small firms and 20 large firms. Percentages may not sum to 100 due to rounding. |
||||
Special Questions Comments
Exploration and Production (E&P) Firms
- The Electric Reliability Council of Texas' West Texas region in the early second quarter (shoulder season) is already consuming more than 1,000 megawatts more power than peak week in summer of 2022. It’s not clear how much power could be shipped to the West Texas region, and the risk of power disruptions to operations in summer is increasing materially.
- The industry is currently experiencing almost no encouragement and support from government entities, universities and social media platforms. Operators and suppliers need to rethink strategic business partnering to thrive in an environment which is not friendly to the industry.
- Anyone notice that the U.S. Energy Information Administration said they expect electric vehicles to be less than 20 percent of total passenger car sales between now and 2050? Coupled with a dire outlook for shale production in the next few years, this spells much higher prices than the forward curve would imply.
- We are still globally underinvesting to keep oil production at current levels, while demand continues to increase, with upside in China. These fundamentals are constructive for oil prices. However, central banks are the main player in how inflation and interest rates are moderating and if we have a U.S. recession, and for how long—that is the uncertainty hanging over the commodity market and capital markets.
- It is a tough time to be an E&P, as product pricing is in no-man’s land. It is hard to be bullish on natural gas prices (especially considering rigs aren’t dropping fast enough), and it’s concerning that most in our industry seem to be bullish on oil prices. We would think crude in the low $50s again would be the pain trade. Allocators are afraid to commit to private equity after the recent bank failures, and unless you’re a big private equity firm, it’s tough to fundraise. It seems to be ideal to stay private if possible, if you have the money (or rich friends) to do so.
- Saudi Arabia’s recent production cut of 1 million barrels per day planned for July and the similar cut in May have failed to lift oil prices. In my view this is signaling weak worldwide recessionary demand. However, Russian oil and Iranian exports may be significantly higher than what is reported. U.S. expected growth this year of around 1.2 percent signals slow domestic demand, on top of an expected daily domestic production increase of about 600,000 barrels at year end to 12.75 million barrels per day. These expectations point to continued pressure on West Texas Intermediate posted prices. Chinese demand for crude oil for the remainder of the year is important but difficult to project.
- Our country’s leadership for the last two years has created a lot of uncertainty in the energy sector. The crystal ball says that this same leadership over the next two years will maintain that uncertainty and it will grow exponentially.
- The state regulatory environment is worsening. Costs continue to increase just to do business. Insurance companies are leaving the business. It is hard to be in the production business these days.
- Artificial intelligence will replace workers in some areas, such as accounting, and increase the need for others ( i.e., reservoir engineering).
- For a small firm where personnel wear multiple hats, it will be difficult for artificial intelligence to replace these employees in the near term. Also, our industry is such that the right answer may not come from what has been done in the past, which is the foundation of artificial intelligence.
- The billions lavished on the green end of the spectrum have not curbed the need for all kinds of energy. The use of hydrocarbons is increasing around the world. We need all groups working together, not pitted against each other. There are significant national security issues that need to be addressed, and green does not cover the bases when it comes to such issues. Politicians should not be anointing certain market winners in order to work to undermine energy companies.
- Natural gas prices are unsustainable, and if they stay at this level for the better part of 2023, it is going to do great damage to our ability to provide natural gas in the future. If we lose the low-producing wells, they aren’t coming back.
- Artificial intelligence is a tool. I expect that the service companies will have personnel efficiencies by adopting the use of artificial intelligence.
Oil and Gas Support Services Firms
- Uncertainty is always a fact in the oil and gas business, but the recent underinvestment will undoubtably lead to improved capital expenditures in the coming years.
- The federal government's energy policy seems completely incoherent. Green-washing is amok, while details of energy security, grid expansion and support for domestic energy are nowhere to be found.
Additional Comments »
Historical data are available from first quarter 2016 to the most current release quarter.
Business Indicators: Quarter/Quarter
| Business Indicators: All Firms Current Quarter (versus previous quarter) | |||||
| Indicator | Current Index | Previous Index | % Reporting Increase | % Reporting No Change | % Reporting Decrease |
Level of Business Activity | 0.0 | 2.1 | 25.2 | 49.7 | 25.2 |
Capital Expenditures | 8.5 | 17.1 | 30.9 | 46.7 | 22.4 |
Supplier Delivery Time | –4.6 | –14.0 | 11.3 | 72.8 | 15.9 |
Employment | 13.1 | 14.3 | 21.7 | 69.7 | 8.6 |
Employee Hours | 10.5 | 12.3 | 19.1 | 72.4 | 8.6 |
Wages and Benefits | 34.5 | 43.6 | 35.8 | 62.9 | 1.3 |
| Indicator | Current Index | Previous Index | % Reporting Improved | % Reporting No Change | % Reporting Worsened |
Company Outlook | –9.1 | –14.1 | 21.7 | 47.6 | 30.8 |
| Indicator | Current Index | Previous Index | % Reporting Increase | % Reporting No Change | % Reporting Decrease |
Uncertainty | 36.9 | 62.6 | 47.4 | 42.1 | 10.5 |
| Business Indicators: E&P Firms Current Quarter (versus previous quarter) | |||||
| Indicator | Current Index | Previous Index | % Reporting Increase | % Reporting No Change | % Reporting Decrease |
Level of Business Activity | 1.0 | –2.1 | 22.0 | 57.0 | 21.0 |
Oil Production | 8.0 | 10.5 | 29.0 | 50.0 | 21.0 |
Natural Gas Wellhead Production | 2.1 | 7.4 | 25.3 | 51.5 | 23.2 |
Capital Expenditures | 9.9 | 11.7 | 32.7 | 44.6 | 22.8 |
Expected Level of Capital Expenditures Next Year | 1.9 | 6.4 | 26.7 | 48.5 | 24.8 |
Supplier Delivery Time | –7.0 | –16.5 | 11.0 | 71.0 | 18.0 |
Employment | 10.8 | 8.4 | 15.8 | 79.2 | 5.0 |
Employee Hours | 6.9 | 10.5 | 9.9 | 87.1 | 3.0 |
Wages and Benefits | 28.0 | 37.8 | 30.0 | 68.0 | 2.0 |
Finding and Development Costs | 14.9 | 46.8 | 30.7 | 53.5 | 15.8 |
Lease Operating Expenses | 26.0 | 37.6 | 38.0 | 50.0 | 12.0 |
| Indicator | Current Index | Previous Index | % Reporting Improved | % Reporting No Change | % Reporting Worsened |
Company Outlook | –8.4 | –18.9 | 21.1 | 49.5 | 29.5 |
| Indicator | Current Index | Previous Index | % Reporting Increase | % Reporting No Change | % Reporting Decrease |
Uncertainty | 41.6 | 64.2 | 50.5 | 40.6 | 8.9 |
| Business Indicators: O&G Support Services Firms Current Quarter (versus previous quarter) | |||||
| Indicator | Current Index | Previous Index | % Reporting Increase | % Reporting No Change | % Reporting Decrease |
Level of Business Activity | –1.9 | 9.6 | 31.4 | 35.3 | 33.3 |
Utilization of Equipment | –7.9 | 3.9 | 23.5 | 45.1 | 31.4 |
Capital Expenditures | 5.9 | 27.0 | 27.5 | 51.0 | 21.6 |
Supplier Delivery Time | 0.0 | –9.6 | 11.8 | 76.5 | 11.8 |
Lag Time in Delivery of Firm's Services | –2.0 | 0.0 | 7.8 | 82.4 | 9.8 |
Employment | 17.6 | 25.0 | 33.3 | 51.0 | 15.7 |
Employment Hours | 17.7 | 15.4 | 37.3 | 43.1 | 19.6 |
Wages and Benefits | 47.1 | 53.9 | 47.1 | 52.9 | 0.0 |
Input Costs | 41.2 | 61.6 | 47.1 | 47.1 | 5.9 |
Prices Received for Services | 3.9 | 25.0 | 23.5 | 56.9 | 19.6 |
Operating Margin | –21.6 | 1.9 | 15.7 | 47.1 | 37.3 |
| Indicator | Current Index | Previous Index | % Reporting Improved | % Reporting No Change | % Reporting Worsened |
Company Outlook | –10.4 | –5.8 | 22.9 | 43.8 | 33.3 |
| Indicator | Current Index | Previous Index | % Reporting Increase | % Reporting No Change | % Reporting Decrease |
Uncertainty | 27.5 | 59.6 | 41.2 | 45.1 | 13.7 |
Business Indicators: Year/Year
| Business Indicators: All Firms Current Quarter (versus same quarter a year ago) | |||||
| Indicator | Current Index | Previous Index | % Reporting Increase | % Reporting No Change | % Reporting Decrease |
Level of Business Activity | 17.2 | 27.7 | 44.1 | 29.0 | 26.9 |
Capital Expenditures | 19.4 | 37.6 | 48.6 | 22.2 | 29.2 |
Supplier Delivery Time | –2.8 | 11.5 | 21.9 | 53.4 | 24.7 |
Employment | 26.6 | 35.2 | 35.4 | 55.8 | 8.8 |
Employee Hours | 24.0 | 29.6 | 32.2 | 59.6 | 8.2 |
Wages and Benefits | 55.5 | 63.5 | 58.2 | 39.0 | 2.7 |
| Indicator | Current Index | Previous Index | % Reporting Improved | % Reporting No Change | % Reporting Worsened |
Company Outlook | –6.5 | 16.8 | 34.1 | 25.4 | 40.6 |
| Business Indicators: E&P Firms Current Quarter (versus same quarter a year ago) | |||||
| Indicator | Current Index | Previous Index | % Reporting Increase | % Reporting No Change | % Reporting Decrease |
Level of Business Activity | 3.2 | 12.2 | 33.7 | 35.8 | 30.5 |
Oil Production | 15.5 | 11.0 | 42.3 | 30.9 | 26.8 |
Natural Gas Wellhead Production | 3.1 | 15.5 | 38.9 | 25.3 | 35.8 |
Capital Expenditures | 14.9 | 26.7 | 47.9 | 19.1 | 33.0 |
Expected Level of Capital Expenditures Next Year | 13.4 | 14.8 | 40.2 | 33.0 | 26.8 |
Supplier Delivery Time | –6.3 | 5.7 | 20.8 | 52.1 | 27.1 |
Employment | 14.5 | 23.9 | 22.7 | 69.1 | 8.2 |
Employee Hours | 10.4 | 15.4 | 15.6 | 79.2 | 5.2 |
Wages and Benefits | 52.1 | 57.8 | 54.2 | 43.8 | 2.1 |
Finding and Development Costs | 45.2 | 69.7 | 54.7 | 35.8 | 9.5 |
Lease Operating Expenses | 49.5 | 64.1 | 58.1 | 33.3 | 8.6 |
| Indicator | Current Index | Previous Index | % Reporting Improved | % Reporting No Change | % Reporting Worsened |
Company Outlook | –23.6 | 4.7 | 23.6 | 29.2 | 47.2 |
| Business Indicators: O&G Support Services Firms Current Quarter (versus same quarter a year ago) | |||||
| Indicator | Current Index | Previous Index | % Reporting Increase | % Reporting No Change | % Reporting Decrease |
Level of Business Activity | 44.0 | 54.9 | 64.0 | 16.0 | 20.0 |
Utilization of Equipment | 40.0 | 54.9 | 60.0 | 20.0 | 20.0 |
Capital Expenditures | 28.0 | 56.9 | 50.0 | 28.0 | 22.0 |
Supplier Delivery Time | 4.0 | 21.6 | 24.0 | 56.0 | 20.0 |
Lag Time in Delivery of Firm's Services | 8.0 | 21.6 | 18.0 | 72.0 | 10.0 |
Employment | 50.0 | 56.0 | 60.0 | 30.0 | 10.0 |
Employment Hours | 50.0 | 54.9 | 64.0 | 22.0 | 14.0 |
Wages and Benefits | 62.0 | 74.0 | 66.0 | 30.0 | 4.0 |
Input Costs | 65.3 | 76.5 | 71.4 | 22.4 | 6.1 |
Prices Received for Services | 42.0 | 58.8 | 58.0 | 26.0 | 16.0 |
Operating Margin | 16.0 | 27.4 | 44.0 | 28.0 | 28.0 |
| Indicator | Current Index | Previous Index | % Reporting Improved | % Reporting No Change | % Reporting Worsened |
Company Outlook | 24.5 | 38.3 | 53.1 | 18.4 | 28.6 |
Activity Chart
Comments from Survey Respondents
These comments are from respondents’ completed surveys and have been edited for publication. Comments from the Special Questions survey can be found below the special questions.
Exploration and Production (E&P) Firms
- Commodity pricing continues to soften, while operating costs have continued to increase and stay at elevated levels, which has led to a continued narrowing of profitability. Regulatory uncertainty remains an issue.
- The lack of support from the administration makes investment questionable.
- It just feels like everyone is waiting on this recession to come—like Jennifer Love Hewitt screaming “What are you waiting for?” in the movie I Know What You Did Last Summer. Oil prices seem to be trading like a financial instrument terrified of this pending recession instead of paying attention to supply-and-demand fundamentals, which are pointing to pretty strong draws headed our way.
- Expenses for everything have increased dramatically, while oil prices remain weak and the natural gas price (net to my revenue checks) is negative. It seems as if the breakeven price for oil is in the mid-$70-per-barrel range at this point. I would drill if costs were not so high. Margins have been squeezed to the point that it is hard to commit to new projects, and all of the uncertain economic projections give no confidence as to what is going to happen going forward. The continual onslaught of attacks by the anti-oil-and-gas crowd have resulted in a “siege” mentality. Things are not good in the oil and gas business for the small independent producer.
- The lower oil and gas prices significantly affect free cash flow and decrease capital expenditures.
- Our firm continues to be in growth mode. As we ramp up production, our capital expenditures will continue to increase. Availability of getting power tied into new pads continues to be an issue for most operators in the Permian Basin.
- Uncertainty regarding methane venting regulations is an issue affecting our business.
- As the government continues its “war” on oil and gas, there are related added costs to the working interest owners. We do have hope that as production struggles, the rule of supply and demand will kick in.
- The lack of bank lending to independent producers has drastically reduced our ability to invest in new projects. We are limited to our organic cash flow, and decreased natural gas prices have lowered that cash flow by more than half.
- Continued government rules and regulations are a constant concern for the future.
- Anti-oil sentiment with the current administration will only raise the long-term price of oil. If we go back a few years and reduce taxes and regulations across all industries, the economy would boom again.
- Significant oilfield-services capital discipline is leading to higher costs. Capital costs need to drop by more than 10 percent for increased activity [to occur].
- Commodity price volatility and supply-chain availability are issues affecting our business.
- Permitting, regulations and not-in-my-backyard legal assaults on everything, combined with inflation, are negative onslaughts to the business. This is led by Washington and makes our planning and ability to move forward difficult. If I had access to the leaders in Washington, I would ask for a more measured political stance.
- Global transportation demand for fuel is down. Even if the U.S. escapes a recession, it is clear that the rest of the global economy will not.
- We’re not certain of what to expect. The highs were too high. The lows too low.
- Saudi Arabia needs $81 per barrel for oil to keep growing their economy. Tier 1 shale acreage is drilled. Drilling outcomes are changing in the shale plays. More natural gas production due to bubble points is appearing, which is not good for oil recovery. Labor is hard to find. Dirty-fossil-fuels stigma drives younger talent away. Oil and gas will increase in value due to drilling slowing down. Drilling on profits after paying off debt to investors is dropping the rig count. Demand for oil is rising on the world stage at about 2 percent per year. New oil is found in very expensive places.
Oil and Gas Support Services Firms
- Uncertainty in energy commodities prices remains the biggest risk to our business. Unfortunately, the commodity price uncertainty stems from continued uncertainty in energy policies that should strike a balance between fossil fuels and green energy. This will lead to periods of significant undersupply of fossil fuels in the future, with increasing volatility in both frequency and amplitude.
- Labor availability is a big issue in blue-collar areas. It is hard to find employees, and wage rate requirements continue to increase.
- We are thinking the next quarter will see steady oil prices while the U.S. weathers its current inflation and/or economic struggles. The overall decrease in reserve replacement ratios over the last decade will increase prices in the longer term, but currently the sag in demand (read: a slow demand increase in post-COVID China) we think will balance the recent OPEC [production] cuts. Longer term, we expect higher oil prices once the economy revs up and once we become supply constrained due to the historically low global reserve-replacement ratios.
- Continuing interest rate hikes are eating cash. While price increases on equipment are slowing, the continuing hiking of interest rates is forcing us to increase our prices to production companies. Meanwhile, the federal government is showing no signs of reducing spending to ease inflationary pressures. This is a significant burden that is being forced on businesses and ultimately taxpayers.
- Federal regulatory agencies continue to harass our industry, thereby jeopardizing the energy security of our country.
- Small-operator activity is decreasing. This is most likely due to the fall in natural gas prices, volatility in oil prices and continued high casing and service costs.
- While [our] financial performance year over year has improved, we expect our business will move sideways to slightly down over the balance of 2023, driven primarily by lower natural-gas-directed drilling (due to lower natural gas prices).
- As an infrastructure service company (pipelines mainly), [our] business is fairly steady. We continue to see our customers reducing their vendor base. We are fortunate to be in sound fiscal shape, so we are retaining not only our long-time customers, but are also picking up new customers. That being said, there is still a lot of uncertainty throughout our industry with no significant relief in sight unless there is an administration change. Meanwhile, we will rock along and try to stay under the radar so as not to draw attention from lawmakers and regulators.
- It seems like the rumor of a recession is causing people to play it conservatively because they just don’t know what will happen (instead of placing a bet on growth). That uncertainty causes buyers to reduce their purchases and expectations for growth—just hold the course for now. It becomes a self-fulfilling prophecy though, which maybe is what the Federal Reserve is looking for (unfortunately) because then the Federal Reserve doesn’t need to be the heavy. However, companies that could be growing are not, mainly due to negative expectations on growth because of fear.
- Seismic licensing activity has improved significantly from this time last year and appears to be relatively stable. Lower natural gas prices have created a bit of a downturn in certain basins, but carbon capture use and storage activity are offsetting the slowdown.
- My business has improved due to increased activity in leasing.
- Access to capital for our client base remains a challenge.
Questions regarding the Dallas Fed Energy Survey can be addressed to Michael Plante at Michael.Plante@dal.frb.org or Kunal Patel at Kunal.Patel@dal.frb.org.
Sign up for our email alert to be automatically notified as soon as the latest Dallas Fed Energy Survey is released on the web.