
Dallas Fed Energy Survey
Oil and gas expansion gains momentum; outlooks improve but cost pressures grow
Special questions this quarter focus on projected U.S. production growth in 2027; price expectations if the military conflict in Iran continues through year-end; expectations for when the Iran conflict might end; likelihood of Iran permanently restricting crude oil exports from the Persian Gulf; anticipated timing for full resolution of natural gas takeaway constraints in the Permian Basin; and key factors limiting drilling activity in the Permian and beyond over the next 12 months.
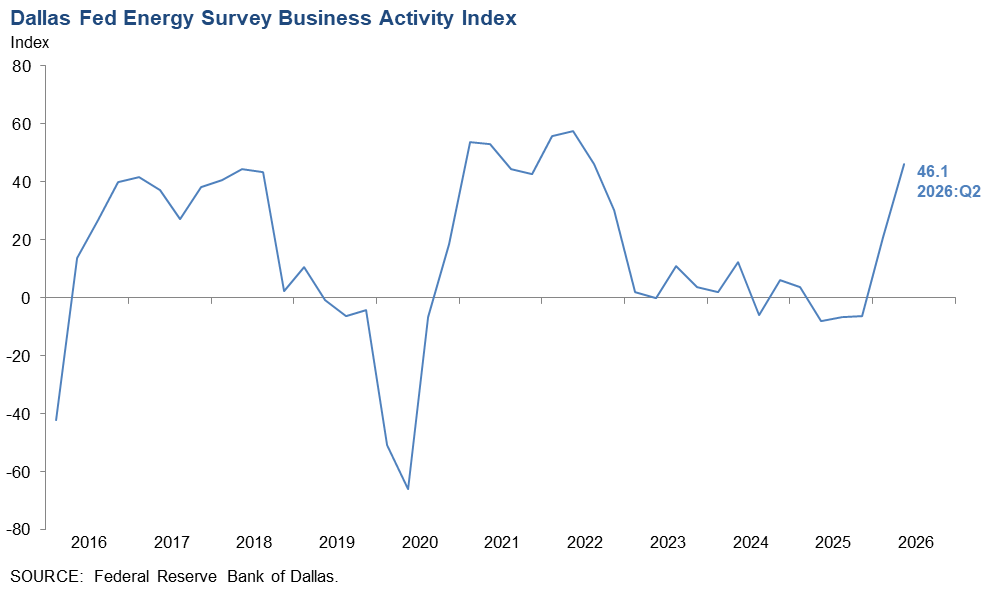
Activity in the oil and gas sector jumped in second quarter 2026, according to oil and gas executives responding to the Dallas Fed Energy Survey. The business activity index, the survey's broadest measure of the conditions energy firms face in the Eleventh District, increased from 21.0 in the first quarter to 46.1 in the second quarter, marking the strongest reading since second quarter 2022. The survey was in the field June 9–17 as the U.S. and Iran negotiated a memorandum of understanding about ending hostilities.
The company outlook index remained positive but edged down to 29.3 in the second quarter, pointing to further improvement in the outlooks since last quarter. E&P firms were more positive, with an outlook index of 48.2, while services firms remained cautious with an outlook of -4.4. Meanwhile, the outlook uncertainty index declined from 53.7 to 29.9, indicating that while uncertainty increased on net, fewer firms noted a rise than during last quarter.
Oil production advanced modestly in the second quarter, while natural gas production saw only minimal gains, according to executives at exploration and production (E&P) firms. The oil production index increased from zero in the first quarter to 15.0 in the second quarter, whereas the natural gas production index remained relatively unchanged at 3.7.
Costs increased at a faster pace relative to the prior quarter. Among oilfield services firms, the input cost index surged from 34.9 to 64.4, with no respondents reporting a decrease in costs. Among E&P firms, the finding and development costs index increased from 22.3 to 40.0. Meanwhile, the lease operating expenses index rose from 30.0 to 43.7. All cost indexes were above their series averages, suggesting costs are growing at a faster-than-average pace.
Oilfield services firms reported improvement in most indicators. The equipment utilization index remained positive and was roughly unchanged at 31.9. The operating margin index increased markedly from -7.0 to 52.2, the first positive reading in many quarters, suggesting margins expanded. The prices received for services index advanced from 9.3 to 24.5.
Overall, demand for employees increased slightly and hours worked rose. The aggregate employment index moved up from 0.8 in the first quarter to 4.7 in the second quarter. The aggregate employee hours index was relatively unchanged at 11.8. Meanwhile, the aggregate wages and benefits index increased slightly from 23.5 to 26.0.
Capital spending strengthened considerably. The capital expenditures index advanced from 21.2 to 40.9 during the second quarter, with 49 percent of firms reporting increased spending. However, the index for expected capital expenditures for next year was 0, suggesting cautious long-term planning despite current spending increases.
Supplier delivery times lengthened, with the index rising from 4.5 to 31.7. This suggests ongoing supply chain pressures, with 36 percent of firms reporting longer delivery times for materials and equipment.
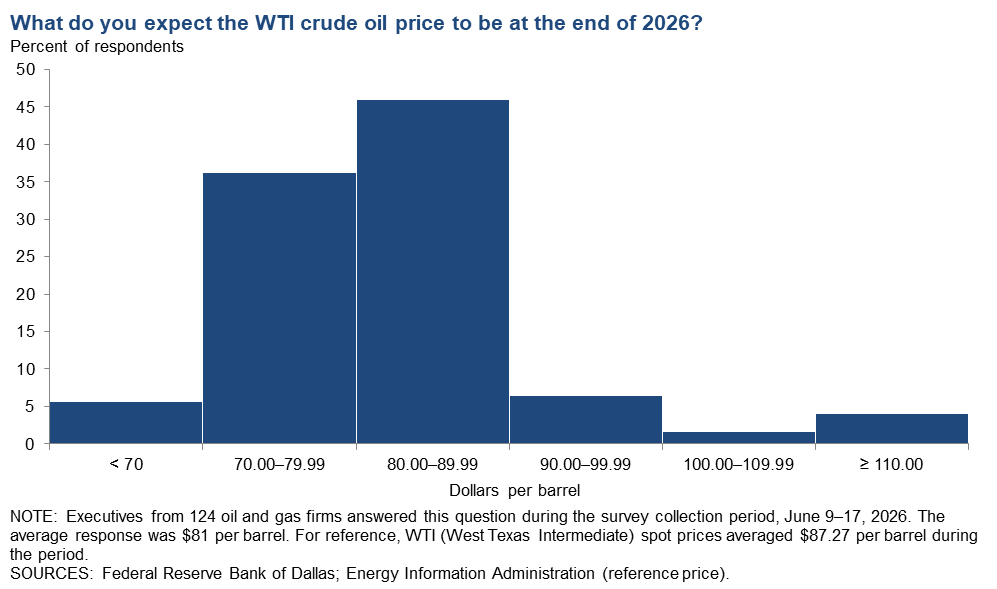
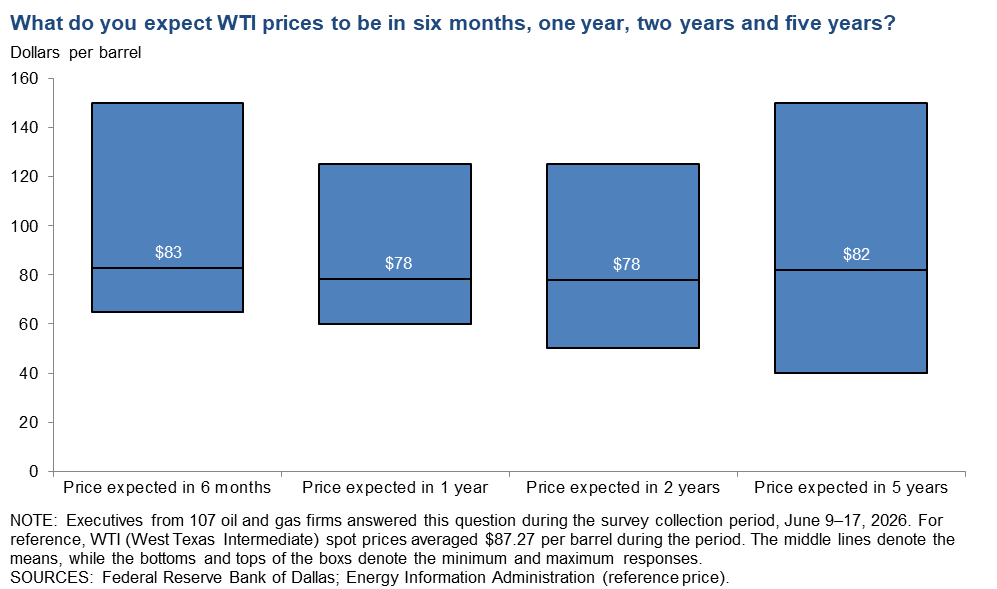
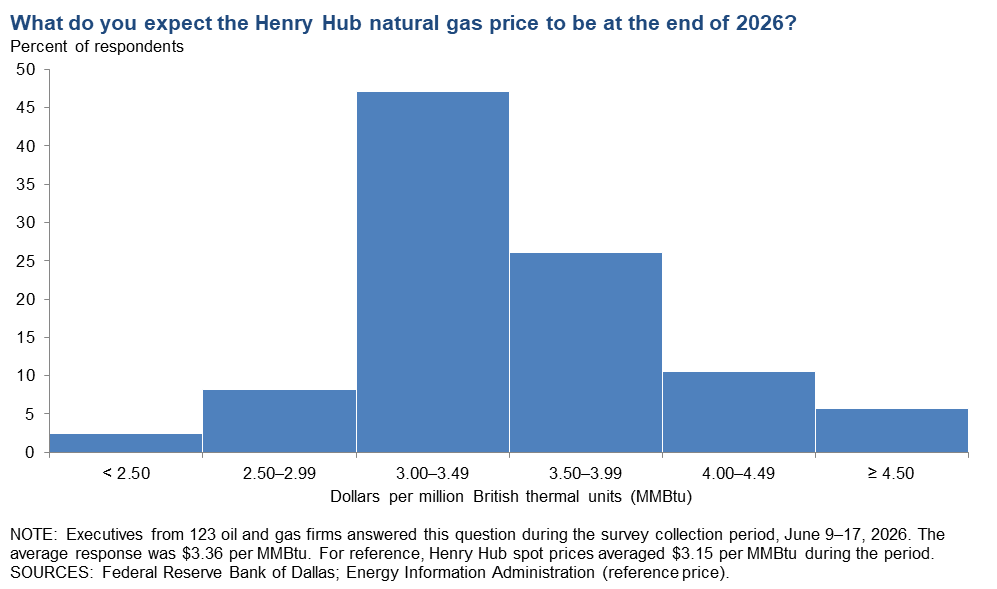
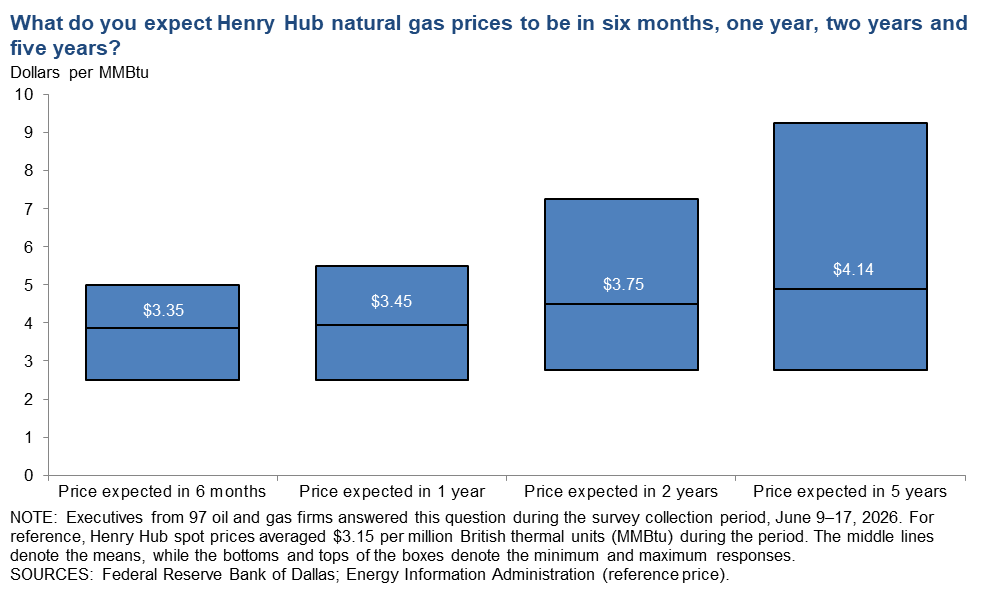
On average, respondents expect a West Texas Intermediate (WTI) oil price of $81 per barrel at year-end 2026; responses ranged from $60 to $150 per barrel. When asked about longer-term expectations, respondents on average said they expect a WTI oil price of $78 per barrel two years from now and $82 per barrel five years from now. Survey participants foresee a Henry Hub natural gas price of $3.36 per million British thermal units (MMBtu) at year-end 2026. When asked about longer-term expectations, respondents on average said they anticipate a Henry Hub gas price of $3.75 per MMBtu two years from now and $4.14 per MMBtu five years from now. For reference, WTI spot prices averaged $87.27 per barrel during the survey collection period, and Henry Hub spot prices averaged $3.15 per MMBtu.
Next release: Sept. 30, 2026
Data were collected June 9–17, and 127 energy firms responded. Of the respondents, 82 were exploration and production firms and 45 were oilfield services firms.
The Dallas Fed conducts the Dallas Fed Energy Survey quarterly to obtain a timely assessment of energy activity among oil and gas firms located or headquartered in the Eleventh District. The Eleventh District encompasses Texas, northern Louisiana and southern New Mexico. Firms are asked whether business activity, employment, capital expenditures and other indicators increased, decreased or remained unchanged compared with the prior quarter and with the same quarter a year ago. Survey responses are used to calculate an index for each indicator. Each index is calculated by subtracting the percentage of respondents reporting a decrease from the percentage reporting an increase. When the share of firms reporting an increase exceeds the share reporting a decrease, the index will be greater than zero, suggesting the indicator has increased over the previous quarter. If the share of firms reporting a decrease exceeds the share reporting an increase, the index will be below zero, suggesting the indicator has decreased over the previous quarter.
Price forecasts
West Texas Intermediate Crude
| West Texas Intermediate crude oil price, year-end 2026 | ||||
| Indicator | Survey Average | Low Forecast | High Forecast | Price During Survey |
Current quarter | $80.55 | $60.00 | $150.00 | $87.27 |
Prior quarter | $74.04 | $50.00 | $135.00 | $94.65 |
| NOTE: Price during survey is an average of daily spot prices during the survey collection period. SOURCES: Federal Reserve Bank of Dallas; Energy Information Administration. | ||||
Henry Hub Natural Gas
| Henry Hub natural gas price, year-end 2026 | ||||
| Indicator | Survey Average | Low Forecast | High Forecast | Price During Survey |
Current quarter | $3.36 | $2.00 | $4.65 | $3.15 |
Prior quarter | $3.60 | $2.30 | $5.25 | $3.16 |
| NOTE: Price during survey is an average of daily spot prices during the survey collection period. SOURCES: Federal Reserve Bank of Dallas; Energy Information Administration. | ||||
Special questions
Data were collected June 9–17; 125 oil and gas firms responded to the special questions survey.
All firms
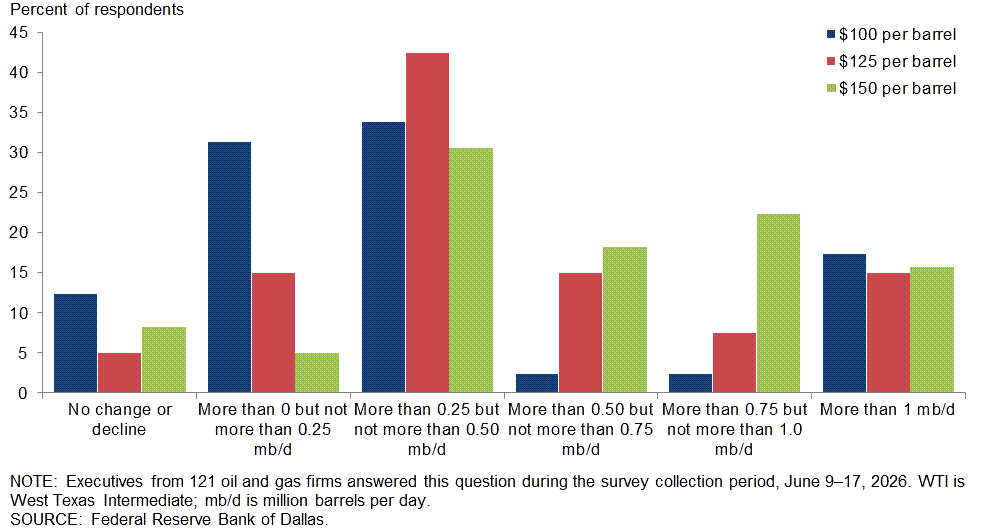
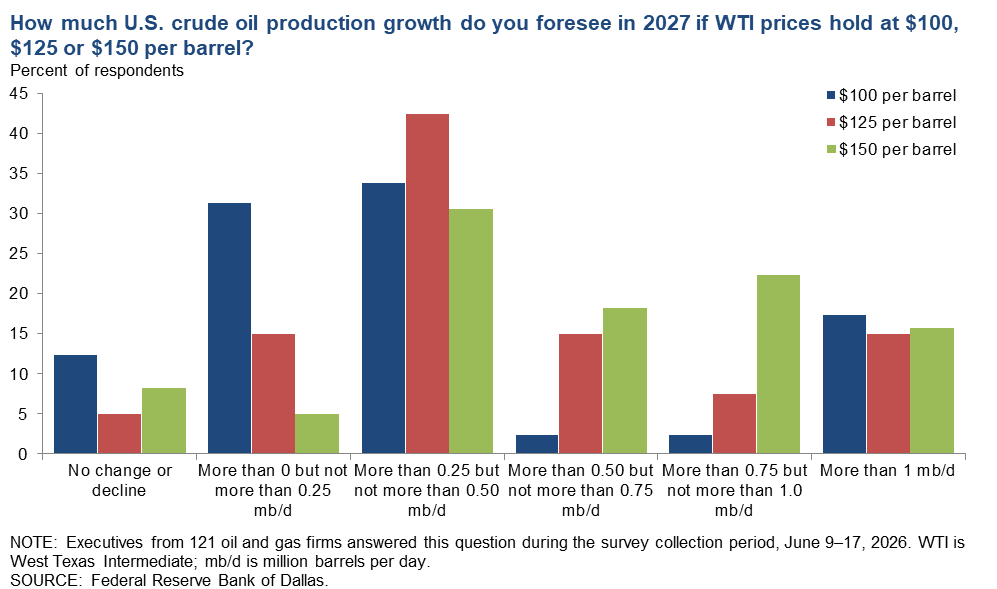
How much U.S. crude oil production growth do you foresee in 2027 if WTI prices hold at $100, $125 or $150 per barrel?
The response most frequently selected by executives across all three price scenarios was “more than 0.25 but not more than 0.50 mb/d.” Respondents tended to indicate smaller production gains at the $100-per-barrel scenario and larger gains at the $150-per-barrel scenario.
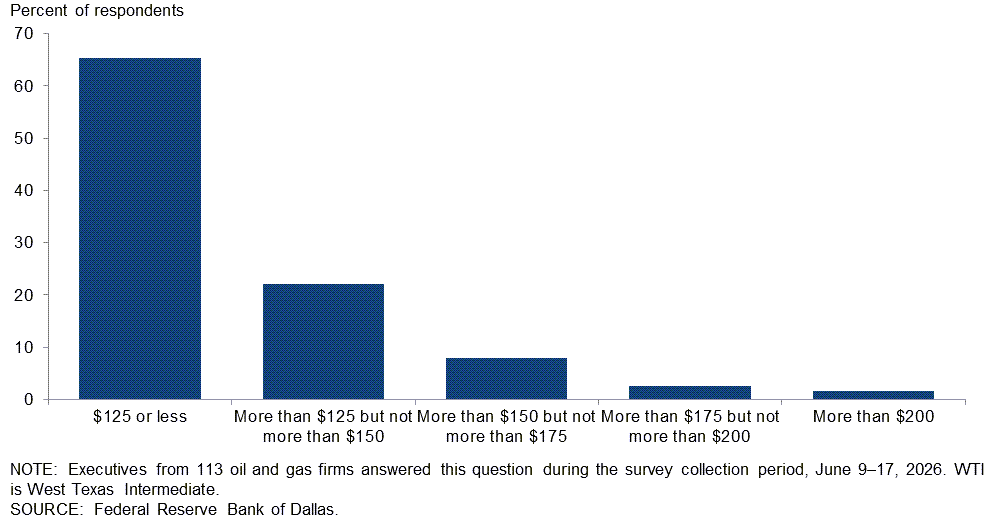
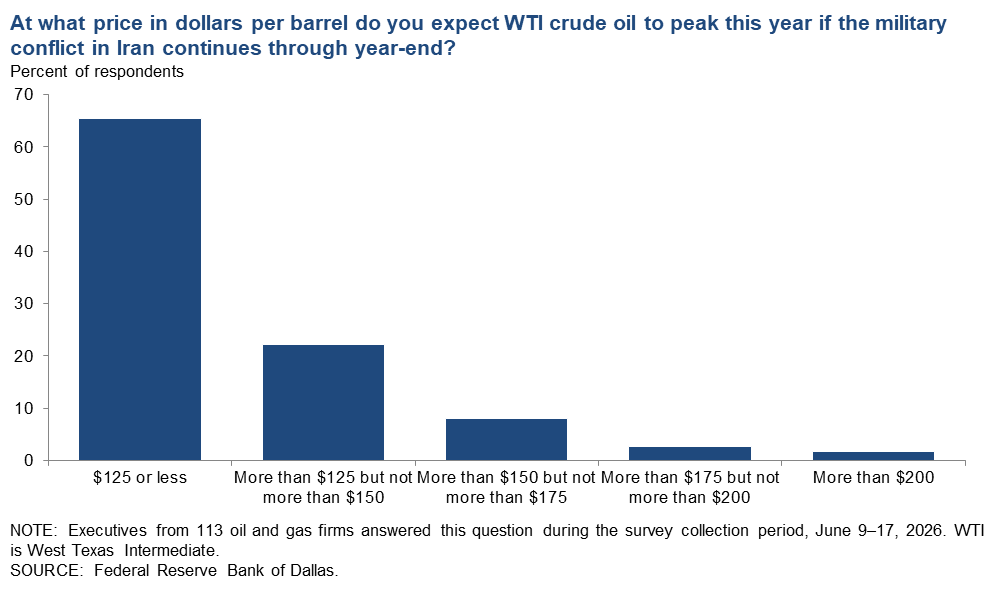
At what price in dollars per barrel do you expect WTI crude oil to peak this year if the military conflict in Iran continues through year‑end?
About two‑third of respondents think West Texas Intermediate (WTI) crude oil would peak at $125 per barrel or less if the military conflict in Iran continues through year‑end. A smaller percentage of respondents selected higher price options.
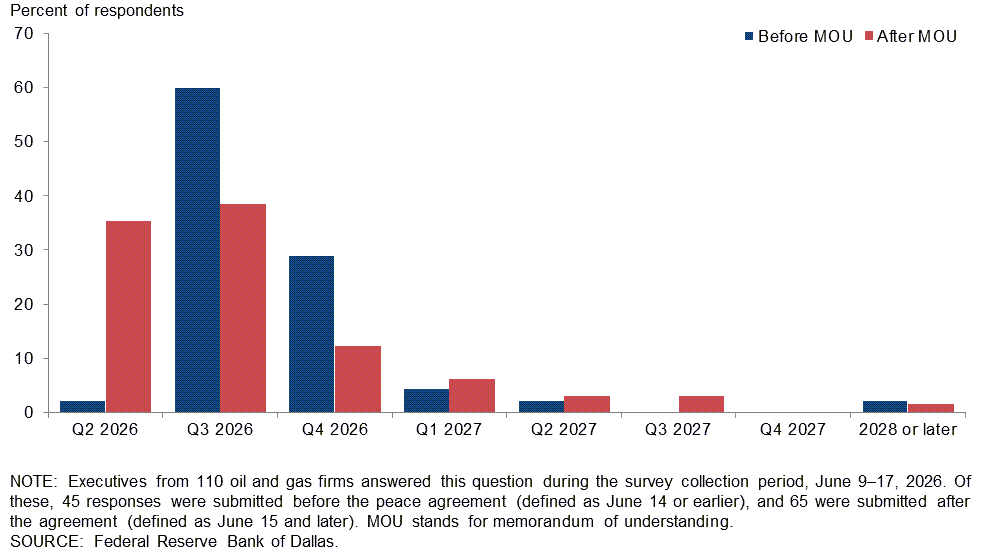
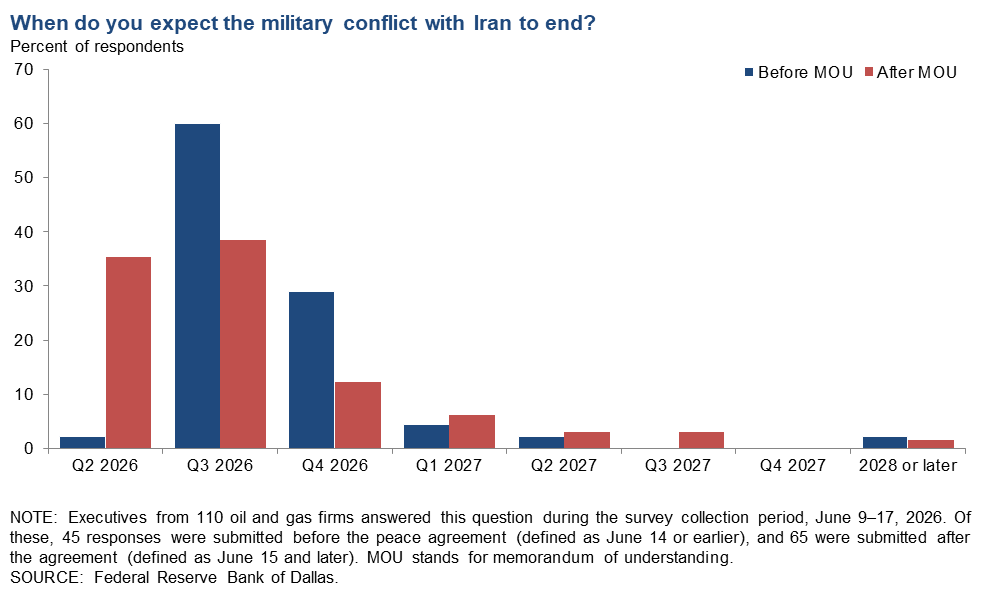
When do you expect the military conflict with Iran to end?
Survey responses were collected during a period when the U.S. and Iran reached a memorandum of understanding (MOU). Responses have been divided into those submitted before the MOU announcement (on or before June 14) and those submitted after (June 15 or later). While third quarter 2026 was the most frequently selected option overall, following the announcement of the MOU a larger share of executives selected second quarter 2026.
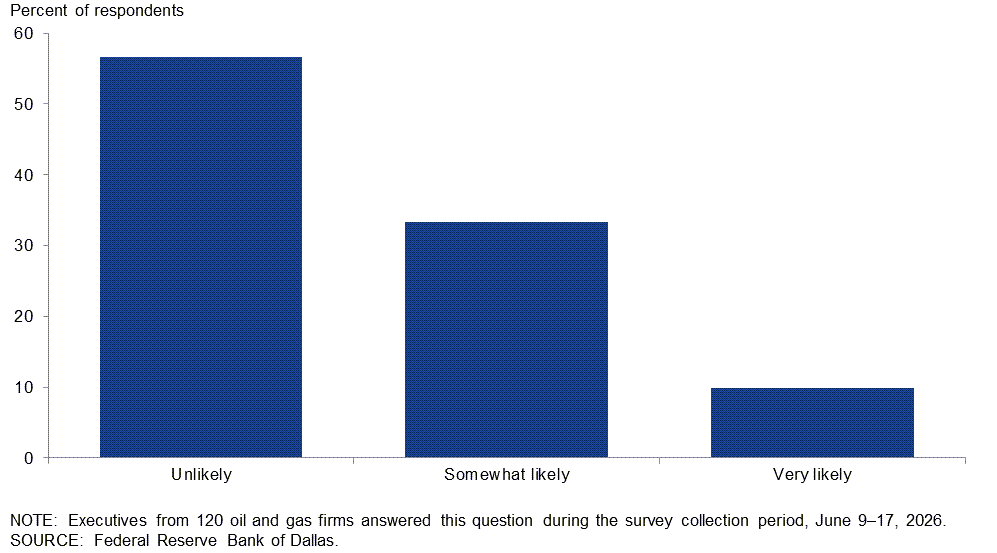
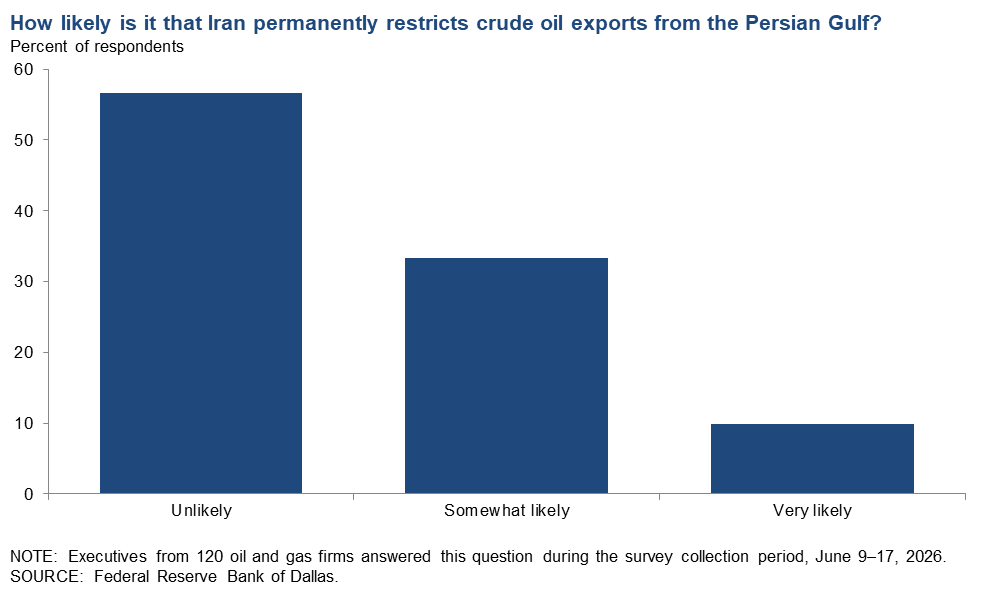
How likely is it that Iran permanently restricts crude oil exports from the Persian Gulf?
A majority of executives view permanent restrictions by Iran on crude exports from the Persian Gulf as unlikely. Fifty‑seven percent of respondents say such restrictions are “unlikely,” while 33 percent consider them “somewhat likely.” Only 10 percent characterize permanent restrictions as “very likely.”
Exploration and production (E&P)
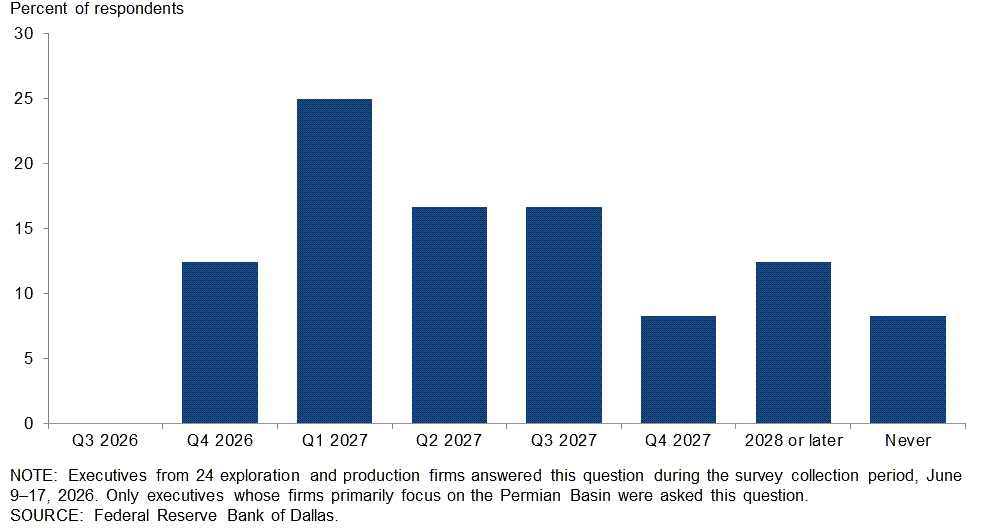
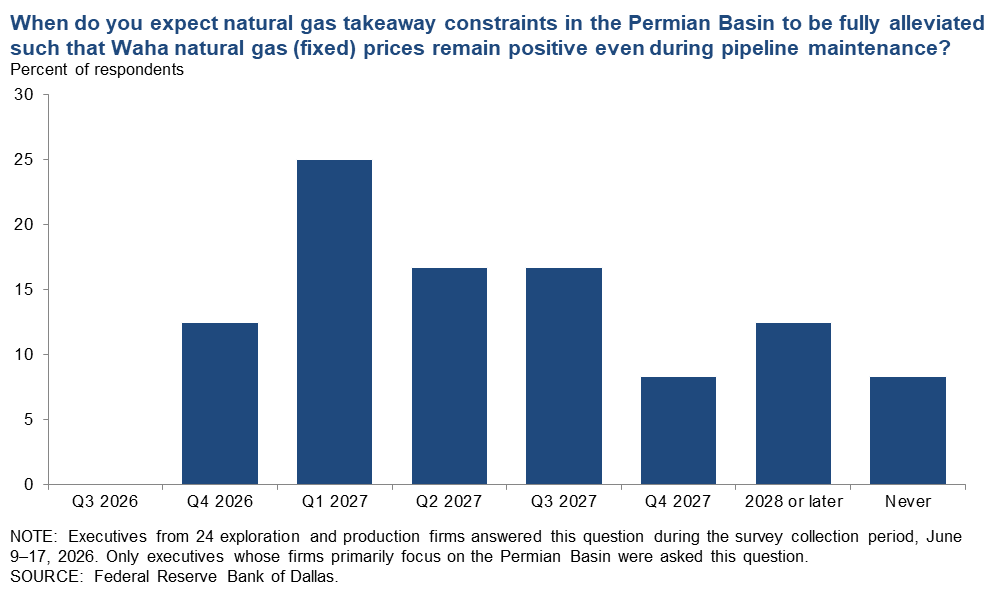
When do you expect natural gas takeaway constraints in the Permian Basin to be fully alleviated such that Waha natural gas (fixed) prices remain positive even during pipeline maintenance?
This question was posed only to exploration and production firms that indicated their operations are primarily focused on the Permian Basin. Most executives expect gas takeaway constraints in the basin to be fully resolved in 2027. The most frequently selected option was first quarter 2027, chosen by 25 percent of respondents.
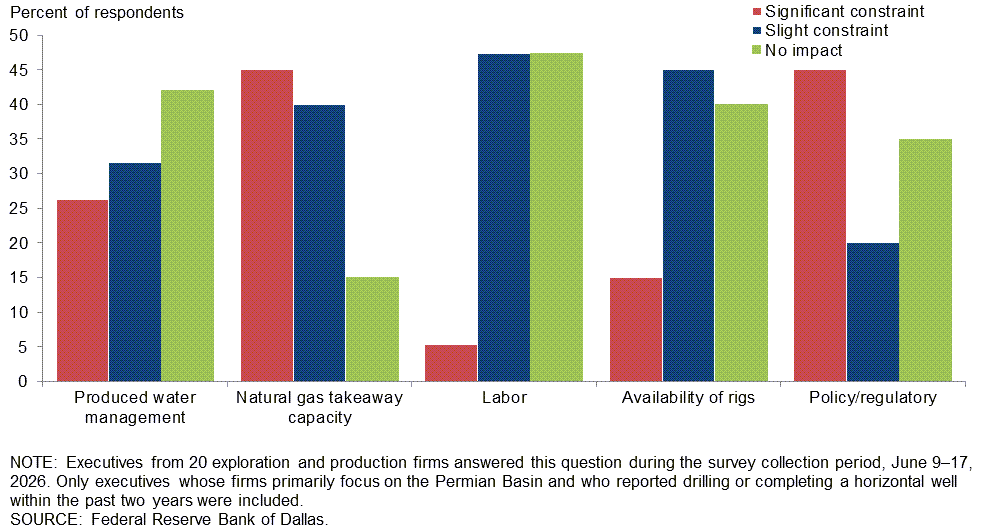
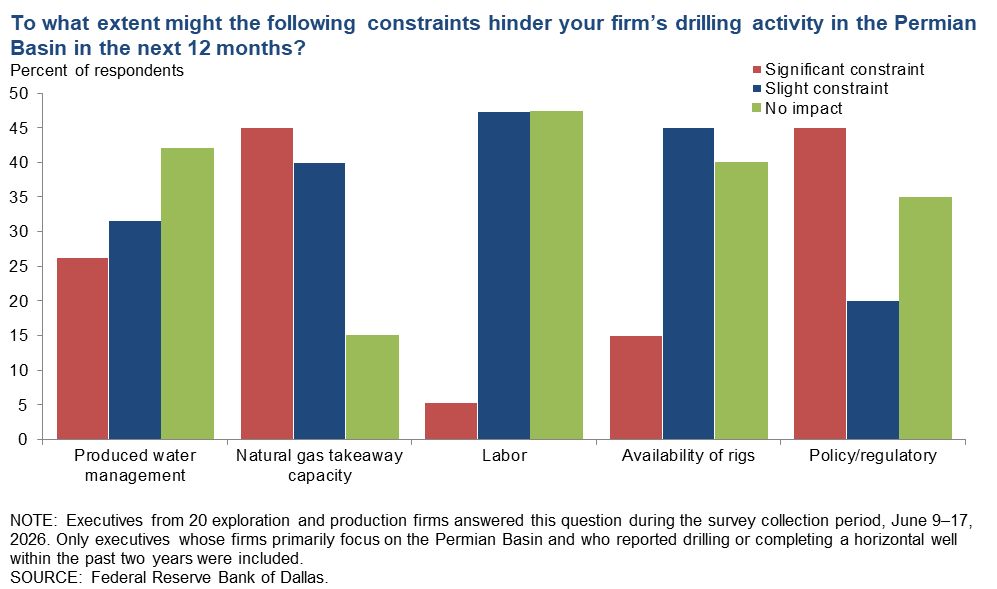
To what extent might the following constraints hinder your firm’s drilling activity in the Permian Basin in the next 12 months?
This question was posed only to exploration and production firms that indicated their operations are primarily focused on the Permian Basin and that have drilled or completed a horizontal well within the past two years. Natural gas takeaway capacity and policy or regulatory issues emerged as the most frequently cited significant constraints.
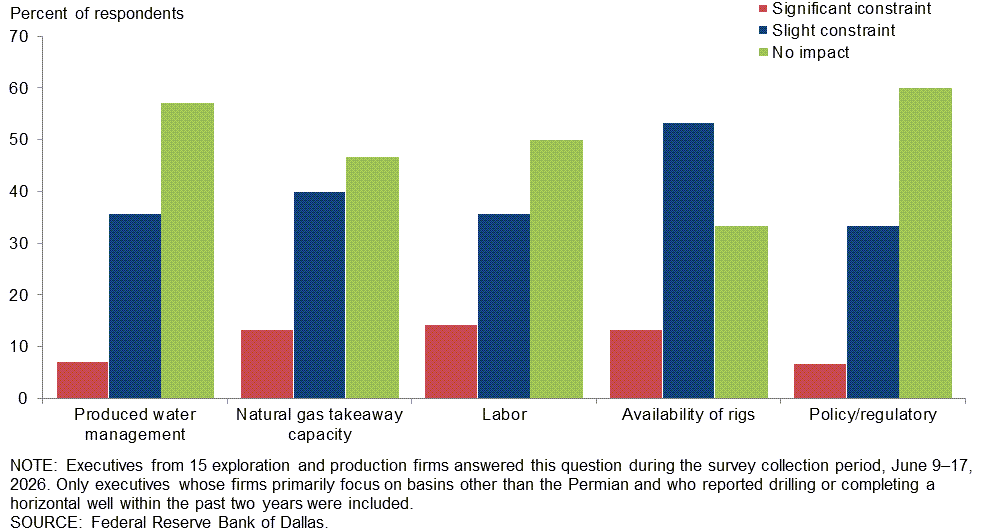
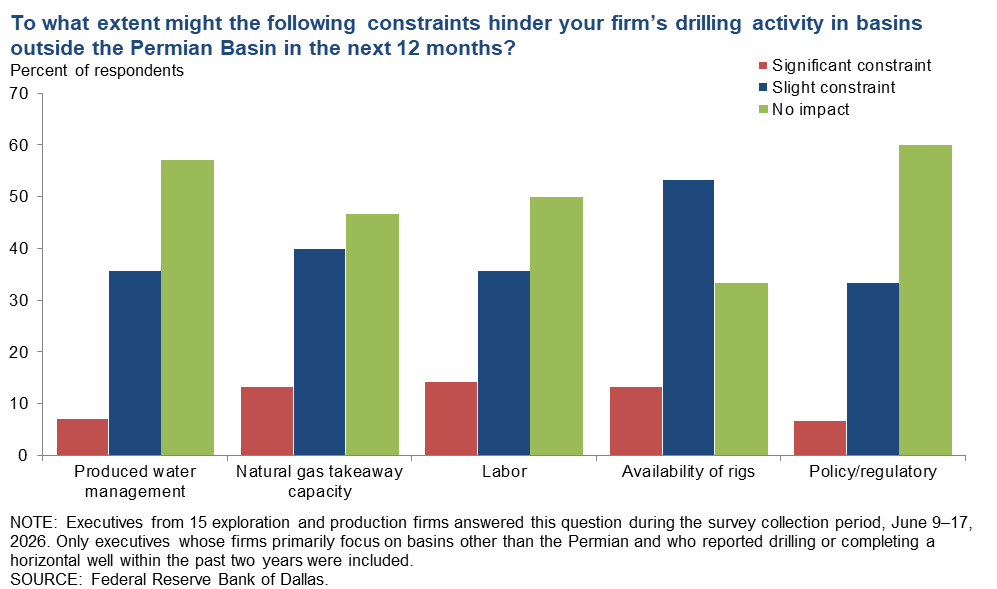
To what extent might the following constraints hinder your firm’s drilling activity in basins outside the Permian Basin in the next 12 months?
This question was posed only to exploration and production firms that indicated their operations are primarily focused outside the Permian Basin and that have drilled or completed a horizontal well within the past two years. Across all listed constraints, few firms reported experiencing significant hindrance.
Special questions comments
Exploration and production (E&P) firms
- It is going to take more time to assess to what degree the energy business and markets are permanently reordered. We certainly have learned that it doesn't matter how much crude you can produce, it is meaningless if you can't get it to your customer in the normal course of business.
- The collision of AI development with local community activists rhymes with the early response to fracking. It's unclear how competitive we can be in the AI arms race unless we temper the rights given to NIMBYists (not in my backyard) and the legal maneuvers they use to stop progress.
- It is clear that the disconnect between commodity physicals and futures creates winners and losers. There is a lot of power in the hands of commodity traders that have the ability to control the price of a molecule that they will never touch. This is a risk factor that must be taken into account in future commodity pricing underwriting models.
- The Middle East situation will not mitigate overnight, nor will this ever go back to normal, whatever that may be. Our project is in the western U.S. in a strategic position to support military and government operations that are important for issues in the Pacific Rim. There is a global reset to hydrocarbon needs and sources. The Middle East is in the news, but the repercussions are worldwide. Energy of all kinds is needed and in demand worldwide, and the industry needs active support. Not everyone is operating in the Permian or engaged in shale development, nor do they want to be. Energy is both a national and international issue of concern.
- Availability of people and frack sand seem to be the first challenges currently.
Oil and gas support services firms
- I do not expect any clean resolution to the Iran war. This will likely be another decade-plus quagmire that will push inflation and add further instability to energy prices. This is the same as it ever was.
- Oil stockpiles have been drawn down, and they will likely take six months to refill.
- The question regarding U.S. oil production growth at high-price scenarios is mostly irrelevant at the time of this writing. In my opinion, the administration is setting up low oil prices for the next five to ten years. It will take six months to a year for it to play out.
- I believe the Iran conflict will be a long and complicated challenge that is not easily solved. The risk premium to Persian Gulf oil will continue.
Additional comments »
Historical data are available from first quarter 2016 to the most current release quarter.
Business indicators: quarter/quarter
| Business Indicators: All Firms Current Quarter (versus previous quarter) | |||||
| Indicator | Current Index | Previous Index | % Reporting Increase | % Reporting No Change | % Reporting Decrease |
Level of Business Activity | 46.1 | 21.0 | 54.0 | 38.1 | 7.9 |
Capital Expenditures | 40.9 | 21.2 | 48.8 | 43.3 | 7.9 |
Supplier Delivery Time | 31.7 | 4.5 | 35.7 | 60.3 | 4.0 |
Employment | 4.7 | 0.8 | 17.3 | 70.1 | 12.6 |
Employee Hours | 11.8 | 12.8 | 22.8 | 66.1 | 11.0 |
Wages and Benefits | 26.0 | 23.5 | 29.1 | 67.7 | 3.1 |
| Indicator | Current Index | Previous Index | % Reporting Improved | % Reporting No Change | % Reporting Worsened |
Company Outlook | 29.3 | 32.2 | 44.4 | 40.5 | 15.1 |
| Indicator | Current Index | Previous Index | % Reporting Increase | % Reporting No Change | % Reporting Decrease |
Uncertainty | 29.9 | 53.7 | 44.9 | 40.2 | 15.0 |
| Business Indicators: E&P Firms Current Quarter (versus previous quarter) | |||||
| Indicator | Current Index | Previous Index | % Reporting Increase | % Reporting No Change | % Reporting Decrease |
Level of Business Activity | 48.2 | 16.6 | 53.1 | 42.0 | 4.9 |
Oil Production | 15.0 | 0.0 | 35.0 | 45.0 | 20.0 |
Natural Gas Wellhead Production | 3.7 | 2.3 | 22.2 | 59.3 | 18.5 |
Capital Expenditures | 42.7 | 18.0 | 51.2 | 40.2 | 8.5 |
Expected Level of Capital Expenditures Next Year | 0.0 | 31.5 | 9.8 | 80.5 | 9.8 |
Supplier Delivery Time | 43.2 | 0.0 | 45.7 | 51.9 | 2.5 |
Employment | 0.0 | –4.5 | 13.4 | 73.2 | 13.4 |
Employee Hours | 12.2 | 8.8 | 20.7 | 70.7 | 8.5 |
Wages and Benefits | 23.2 | 22.5 | 25.6 | 72.0 | 2.4 |
Finding and Development Costs | 40.0 | 22.3 | 41.3 | 57.5 | 1.3 |
Lease Operating Expenses | 43.7 | 30.0 | 45.0 | 53.8 | 1.3 |
| Indicator | Current Index | Previous Index | % Reporting Improved | % Reporting No Change | % Reporting Worsened |
Company Outlook | 48.2 | 33.3 | 53.1 | 42.0 | 4.9 |
| Indicator | Current Index | Previous Index | % Reporting Increase | % Reporting No Change | % Reporting Decrease |
Uncertainty | 34.1 | 60.4 | 46.3 | 41.5 | 12.2 |
| Business Indicators: O&G Support Services Firms Current Quarter (versus previous quarter) | |||||
| Indicator | Current Index | Previous Index | % Reporting Increase | % Reporting No Change | % Reporting Decrease |
Level of Business Activity | 42.3 | 30.3 | 55.6 | 31.1 | 13.3 |
Utilization of Equipment | 31.9 | 30.2 | 45.5 | 40.9 | 13.6 |
Capital Expenditures | 37.7 | 27.9 | 44.4 | 48.9 | 6.7 |
Supplier Delivery Time | 11.1 | 14.2 | 17.8 | 75.6 | 6.7 |
Lag Time in Delivery of Firm's Services | 8.9 | 9.5 | 8.9 | 91.1 | 0.0 |
Employment | 13.3 | 11.6 | 24.4 | 64.4 | 11.1 |
Employment Hours | 11.1 | 20.9 | 26.7 | 57.8 | 15.6 |
Wages and Benefits | 31.2 | 25.5 | 35.6 | 60.0 | 4.4 |
Input Costs | 64.4 | 34.9 | 64.4 | 35.6 | 0.0 |
Prices Received for Services | 24.5 | 9.3 | 28.9 | 66.7 | 4.4 |
Operating Margin | 52.2 | –7.0 | 63.6 | 25.0 | 11.4 |
| Indicator | Current Index | Previous Index | % Reporting Improved | % Reporting No Change | % Reporting Worsened |
Company Outlook | –4.4 | 30.0 | 28.9 | 37.8 | 33.3 |
| Indicator | Current Index | Previous Index | % Reporting Increase | % Reporting No Change | % Reporting Decrease |
Uncertainty | 22.2 | 39.6 | 42.2 | 37.8 | 20.0 |
Business indicators: year/year
| Business Indicators: All Firms Current Quarter (versus same quarter a year ago) | |||||
| Indicator | Current Index | Previous Index | % Reporting Increase | % Reporting No Change | % Reporting Decrease |
Level of Business Activity | 40.4 | 17.7 | 58.1 | 24.2 | 17.7 |
Capital Expenditures | 32.8 | 14.8 | 49.2 | 34.4 | 16.4 |
Supplier Delivery Time | 32.3 | 5.5 | 37.9 | 56.5 | 5.6 |
Employment | 7.2 | 5.3 | 24.0 | 59.2 | 16.8 |
Employee Hours | 12.1 | 8.4 | 26.6 | 58.9 | 14.5 |
Wages and Benefits | 44.8 | 41.6 | 50.4 | 44.0 | 5.6 |
| Indicator | Current Index | Previous Index | % Reporting Improved | % Reporting No Change | % Reporting Worsened |
Company Outlook | 25.5 | 26.5 | 49.2 | 27.1 | 23.7 |
| Business Indicators: E&P Firms Current Quarter (versus same quarter a year ago) | |||||
| Indicator | Current Index | Previous Index | % Reporting Increase | % Reporting No Change | % Reporting Decrease |
Level of Business Activity | 45.0 | 19.6 | 57.5 | 30.0 | 12.5 |
Oil Production | 26.6 | 4.6 | 48.1 | 30.4 | 21.5 |
Natural Gas Wellhead Production | 10.0 | 3.6 | 30.0 | 50.0 | 20.0 |
Capital Expenditures | 44.3 | 11.7 | 57.0 | 30.4 | 12.7 |
Expected Level of Capital Expenditures Next Year | 3.7 | 28.5 | 14.8 | 74.1 | 11.1 |
Supplier Delivery Time | 42.5 | 4.6 | 47.5 | 47.5 | 5.0 |
Employment | 7.5 | 1.1 | 23.5 | 60.5 | 16.0 |
Employee Hours | 15.0 | 3.4 | 25.0 | 65.0 | 10.0 |
Wages and Benefits | 44.5 | 40.2 | 49.4 | 45.7 | 4.9 |
Finding and Development Costs | 48.8 | 27.9 | 51.3 | 46.3 | 2.5 |
Lease Operating Expenses | 60.0 | 48.8 | 63.8 | 32.5 | 3.8 |
| Indicator | Current Index | Previous Index | % Reporting Improved | % Reporting No Change | % Reporting Worsened |
Company Outlook | 50.0 | 27.7 | 60.8 | 28.4 | 10.8 |
| Business Indicators: O&G Support Services Firms Current Quarter (versus same quarter a year ago) | |||||
| Indicator | Current Index | Previous Index | % Reporting Increase | % Reporting No Change | % Reporting Decrease |
Level of Business Activity | 31.8 | 14.0 | 59.1 | 13.6 | 27.3 |
Utilization of Equipment | 28.6 | 11.6 | 52.4 | 23.8 | 23.8 |
Capital Expenditures | 11.6 | 21.0 | 34.9 | 41.9 | 23.3 |
Supplier Delivery Time | 13.7 | 7.1 | 20.5 | 72.7 | 6.8 |
Lag Time in Delivery of Firm's Services | 9.1 | 17.1 | 11.4 | 86.4 | 2.3 |
Employment | 6.8 | 13.9 | 25.0 | 56.8 | 18.2 |
Employment Hours | 6.8 | 18.6 | 29.5 | 47.7 | 22.7 |
Wages and Benefits | 45.5 | 44.2 | 52.3 | 40.9 | 6.8 |
Input Costs | 72.7 | 50.0 | 72.7 | 27.3 | 0.0 |
Prices Received for Services | 21.4 | 0.0 | 33.3 | 54.8 | 11.9 |
Operating Margin | 46.5 | –13.9 | 60.5 | 25.6 | 14.0 |
| Indicator | Current Index | Previous Index | % Reporting Improved | % Reporting No Change | % Reporting Worsened |
Company Outlook | –16.0 | 24.3 | 29.5 | 25.0 | 45.5 |
Activity chart
Comments from Survey Respondents
Survey participants are given the opportunity to submit comments on current issues that may be affecting their businesses. Some comments have been edited for grammar and clarity. Comments from the Special Questions survey can be found below the special questions.
Exploration and production (E&P) firms
- Middle East geopolitical tensions and shifts in U.S. tariff policy have contributed to broader shipping constraints and extended lead times for a few products. No oilfield shortages are evident at this time, but we are keeping a close watch on the evolving dynamic.
- Current political instability in oil markets due to the Iran war has crude oil and natural gas prices inflated. If there is a conclusion to hostilities, there will be continued confusion in the oil markets as normalcy may require time, but eventually calming oil markets will result in significantly lower prices.
- Once the Middle East conflict comes to end it will take 90 to 120 days for oil to settle back to around the $70-per-barrel range.
- Golly. What could possibly be affecting our business other than a COVID-sized supply gap driven by a war being commandeered by an administration that just cannot tell the truth? They jawbone the price down basically every Sunday evening. If they know Hormuz reopening isn't likely, it'll make the medium-term supply issue ten times worse.
- If the Iranian war hasn’t ended by the end of July, we will see the supply cliff hit, whereby all of the various releases from strategic reserves will have been used and actual physical shortages will start showing up. Then all bets will be off on oil prices.
- The Iranian war of course affects outlooks. I am confident that the administration is doing the right thing as to resolving the conflict.
- Markets can price risk, but they can't price a tweet. The whiplash from diplomacy-by-social-media has become the single most unpredictable input in our planning. We don't need certainty about the future, just certainty that policy won't change between the morning and the afternoon.
- Prices are anyone’s guess.
- Under the current conditions with the Iranian war, it is hard to predict the price of crude oil with any amount of certainty. My guess is that we will see higher prices for both crude oil and natural gas for several months even with a ceasefire agreement.
- The market is too soft given today's circumstances. I put $82 per barrel for West Texas Intermediate, but I'll bet that's light.
- The increased cash flow means more drilling.
- The Hormuz uncertainty makes planning difficult. Service providers are taking pricing, which is also not encouraging for increased development in 2027.
- Costs are increasing due to fuel cost and higher demand. For the first time in my career, I had a pressure pump group come back to me asking how much over the proposed rate I would pay to secure a frack date. We went with a different vendor after this comment was made.
- The biggest issues are the lack of acreage and the cost of acquisitions. It's challenging for independents.
- Low natural gas prices have helped us reduce the cost of property acquisitions. Buy low and sell high, hopefully. The increase in liquefied natural gas exports is helping tremendously.
- The prospect that Iran will comply and conform with any agreement, written or oral, is, at best, wishing on a fantasy. Correspondingly, it is unlikely that Israel will elect not to act in what it considers to be it's own interest because it could threaten the peace, which is akin to wishing on a star without a star. In effect, I believe the degree of uncertainty remains substantial.
- Politics in the western U.S., specifically California, are distorting the market and negatively affecting investments. This is a major source of uncertainty reducing the energy available in the state.
- Geopolitical risk is still affecting industry at the upstream producer level, especially small undercapitalized companies.
- Rapid changes in international geopolitics make for a cloudy windshield view of the future direction of oil price and demand. We want to choose drilling prospects that are profitable at $50 per barrel.
- Regulatory compliance is becoming a major expense, with abandonment expense being significantly more burdensome for stripper production.
- The White House seems to prefer commotion and chaos to delivering meaningful, truthful information that serious business decisions can be made on.
- The Iran conflict, i.e., blockade of the Strait of Hormuz, is the wild card in speculating on future prices and development activity.
- It is disheartening to see Democrats reflexively wanting a return to the Windfall Profits Tax.
- We are not hedged in crude oil or natural gas production, so we are susceptible to monthly average spot pricing plus basin differentials (Gulf Coast of Texas). Given this, the first two quarters of 2026 have been highly volatile between the Winter Storm Fern event in January followed by the Iran war affecting oil pricing. We look forward to getting back to fundamentals when it comes to commodity pricing, allowing us to continue underwriting mergers and acquisitions deals with confidence and obtain the ability to better project cash flow.
Oil and gas support services firms
- Elevated oil prices are not directly translating into increased production or increased demand for oilfield services. Unprecedented geopolitical instability is leading to increased uncertainty.
- Predicting future operations given current conditions in all aspects of the business world, not just the oil and gas industry, seems to be next to impossible. Volatility remains the norm.
- Hoping for a new floor in the $70s to $80s per barrel as the Iran conflict looks like it wraps up.
- Uncertainty continues to cast a shadow on long-term structural planning, but the general outlook in two- and three-year timeframes is greatly improved.
- Artificial intelligence (AI) can do much, but AI can not drill a 30,000-foot well.
- As a service provider, we have seen pricing that has become much more competitive with the consolidation of the majors. We are seeing smaller service providers come in and slash pricing to unrealistic numbers. The majors are accepting these price cuts temporarily until they start to experience service problems and failures. It is very difficult for the established larger service providers to have to compete with this tactic of business.
- Business activity has increased in the second quarter of 2026 compared to both the prior quarter and the same period last year, driven by stronger demand for rental equipment and field services in the Midland and Delaware Basins. However, diesel fuel costs have risen sharply—up approximately 65 percent since January. This input cost pressure is partially offsetting strong revenue growth. We remain cautiously optimistic for second half 2026, though continued oil price increases could further compress margins if fuel surcharges cannot be passed through to customers.
- Fuel expenses have greatly increased over the past quarter, but equipment pricing is not keeping up with inflation. E&P consolidation has made an impossible environment to pass on ever increasing costs.
- Workover and well service activity picked up in the Permian Basin in late April and May. The pickup is not at activity levels that would be expected with where WTI prices actually were during that time frame but above the $55 to $60 per barrel level that was being used at the start of the year. With higher activity, the labor market has begun to tighten (must be legal to work in U.S. and pass drug test, which screens out a lot of applicants,) and thus the market for services has tightened slightly, allowing for small pricing gains in addition to fuel surcharges that went into place in Apri in all markets.
- We are activating equipment that stacked in fourth quarter 2023. Rates for services are increasing. Competition for experienced field crews is increasing, and customers are hiring our people.
- Activity is more likely to increase than decrease. Supplies of rental tools and services are tight and suppliers are demanding a return on investment. Capital decisions will be made based on a reward of a return, not the opportunity to supply.
- A fairly consistent theme is volatility and sector cost inflation, where commodity prices don't offset increased costs.
Questions regarding the Dallas Fed Energy Survey can be addressed to Michael Plante at Michael.Plante@dal.frb.org or Kunal Patel at Kunal.Patel@dal.frb.org.
Sign up for our email alert to be automatically notified as soon as the latest Dallas Fed Energy Survey is released on the web. For additional energy-related academic research and market analysis, please visit the Dallas Fed’s Center for Energy and the Economy.