
Dallas Fed Energy Survey

Oil and gas activity increases despite cost pressures, longer supplier delivery times
Special questions this quarter focus on the absolute minimum inventory level for the U.S. Strategic Petroleum Reserve, anticipated Persian Gulf export normalization, expected fuel-price spread reversion to 2025 levels, free cash flow allocation plans for U.S. exploration and production (E&P) firms, and oilfield theft.
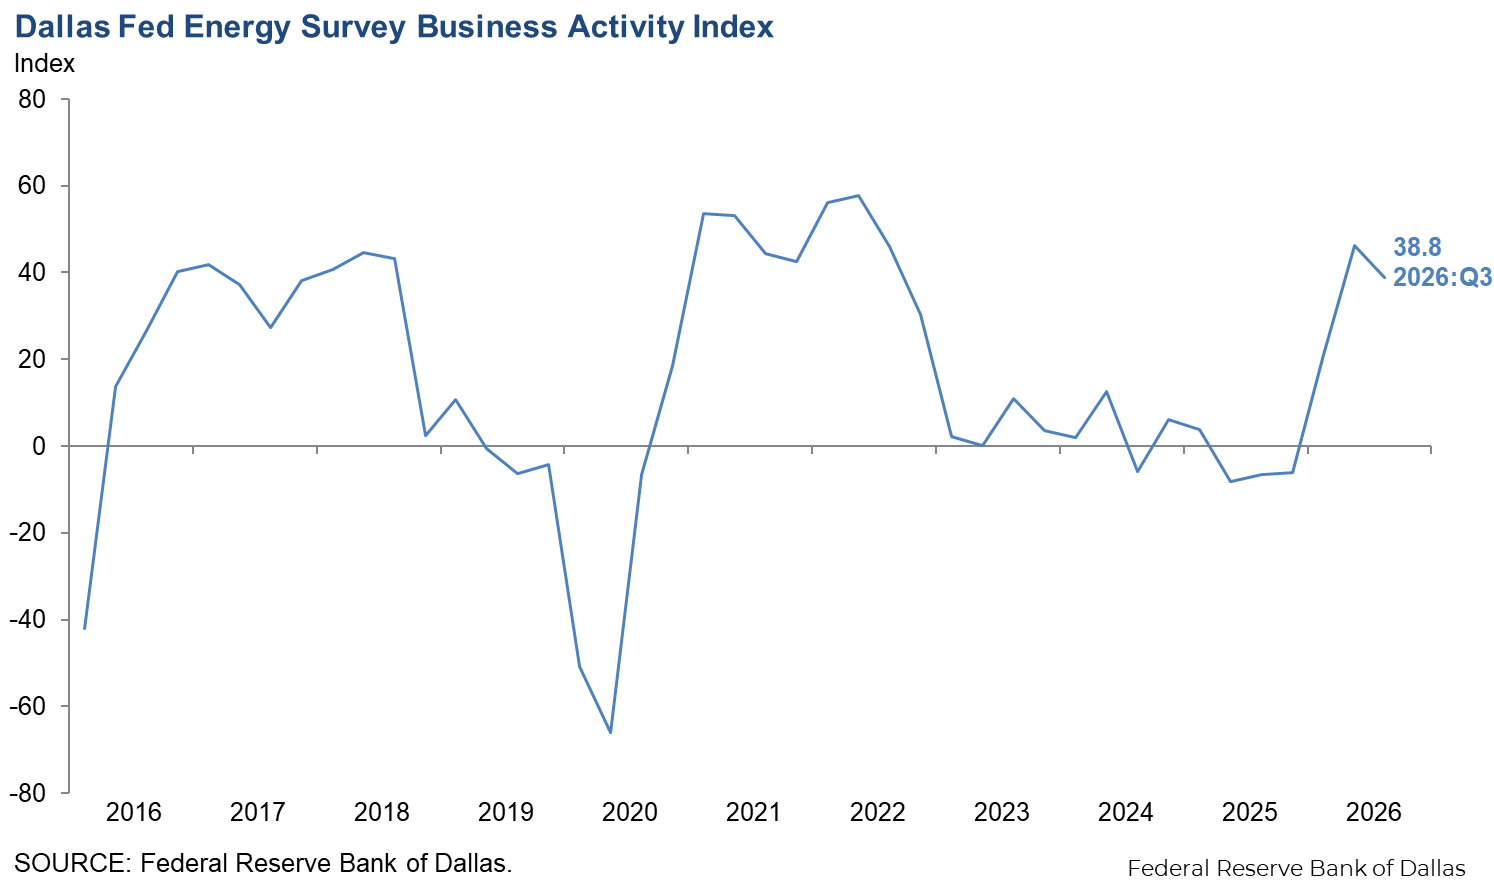
Activity in the oil and gas sector further expanded in third quarter 2026, according to oil and gas executives responding to the Dallas Fed Energy Survey. The business activity index, the survey's broadest measure of the conditions energy firms face in the Eleventh District, remained positive but declined slightly from 46.1 in the second quarter to 38.8 in the third. This suggests the pace of expansion slowed slightly but remained solid.
Outlooks diverged notably between the upstream industry’s two principal segments. E&P firms were more positive, with an outlook index of 50.0, while services firms remained far more neutral, with an outlook index of 4.6. The overall outlook uncertainty index was essentially unchanged at 29.8. Notably, E&P firms reported a higher uncertainty reading of 40.2, compared with 9.5 for services firms. This suggests that uncertainty increased overall, with E&P firms more likely than services firms to report rising uncertainty.
Both oil and natural gas production rose in the third quarter, according to E&P executives. The oil production index increased from 15.0 in the second quarter to 20.7 in the third. Meanwhile, the natural gas production index climbed from 3.7 to 14.8.
Cost pressures remained elevated across the sector. Among oilfield services firms, the input cost index stayed elevated but edged down from 64.4 to 60.4. Among E&P firms, the finding and development costs index and the lease operating expenses index were relatively unchanged at 41.5 and 43.9, respectively. All cost indexes were above their series averages, suggesting costs are growing at a faster-than-average pace.
Oilfield services firms reported improvement in most indicators. The equipment utilization index increased from 31.9 in the second quarter to 41.9 in the third. The operating margin index remained positive but decreased from 52.2 to 37.2, suggesting margins expanded at a slightly slower pace. The prices received for services index also remained positive but declined slightly from 24.5 to 16.3.
Labor market indicators improved modestly in the third quarter. The aggregate employment index rose from 4.7 to 15.2, and the aggregate employee hours index increased from 11.8 to 20.0, both pointing to modest job growth and longer hours worked. The aggregate wages and benefits index remained positive but edged down from 26.0 to 23.2.
Supplier delivery times continued to lengthen. The supplier delivery time index for all firms remained positive and ticked up slightly from 31.7 to 36.2. Among E&P firms, the index was elevated and was relatively unchanged at 43.9, while among oilfield services firms, the index moved up from 11.1 to 21.4.
On average, respondents expect a West Texas Intermediate (WTI) oil price of $88 per barrel at year-end 2026; responses ranged from $70 to $126 per barrel. When asked about longer-term expectations, respondents on average said they expect a WTI oil price of $79 per barrel two years from now and $82 per barrel five years from now. Survey participants foresee a Henry Hub natural gas price of $3.29 per million British thermal units (MMBtu) at year-end 2026. When asked about longer-term expectations, respondents on average said they anticipate a Henry Hub gas price of $3.82 per MMBtu two years from now and $4.28 per MMBtu five years from now. For reference, WTI spot prices averaged $98.70 per barrel during the survey collection period, and Henry Hub spot prices averaged $2.97 per MMBtu.
Next release: Dec. 16, 2026
Data were collected Sept. 16–24, and 125 energy firms responded. Of the respondents, 83 were exploration and production firms, and 42 were oilfield services firms.
The Dallas Fed conducts the Dallas Fed Energy Survey quarterly to obtain a timely assessment of energy activity among oil and gas firms located or headquartered in the Eleventh District. The Eleventh District encompasses Texas, northern Louisiana and southern New Mexico. Firms are asked whether business activity, employment, capital expenditures and other indicators increased, decreased or remained unchanged compared with the prior quarter and with the same quarter a year ago. Survey responses are used to calculate an index for each indicator. Each index is calculated by subtracting the percentage of respondents reporting a decrease from the percentage reporting an increase. When the share of firms reporting an increase exceeds the share reporting a decrease, the index will be greater than zero, suggesting the indicator has increased over the previous quarter. If the share of firms reporting a decrease exceeds the share reporting an increase, the index will be below zero, suggesting the indicator has decreased over the previous quarter.
Price forecasts
West Texas Intermediate Crude
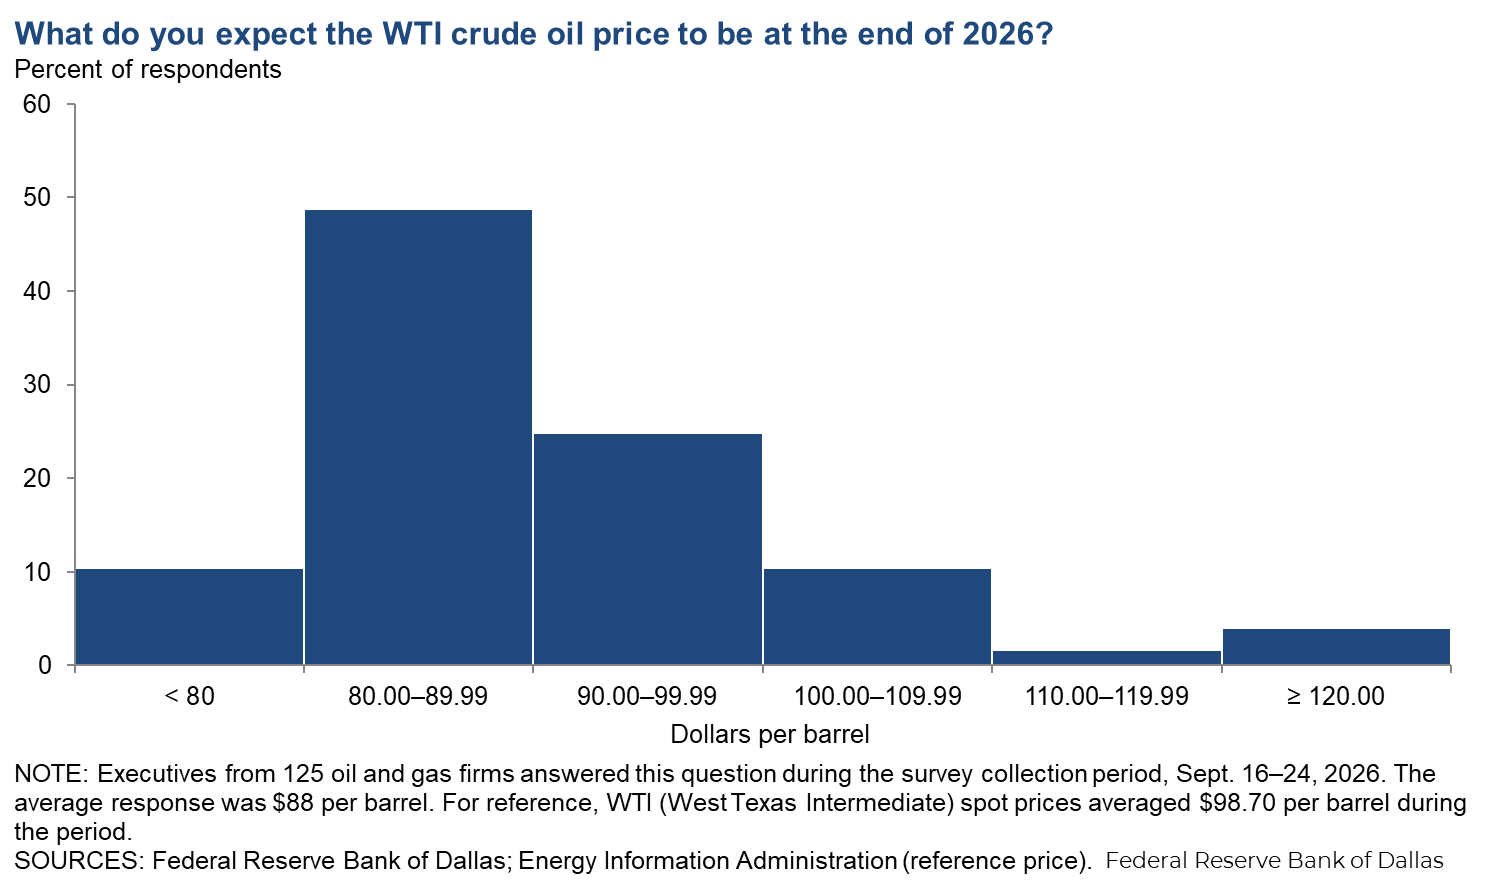
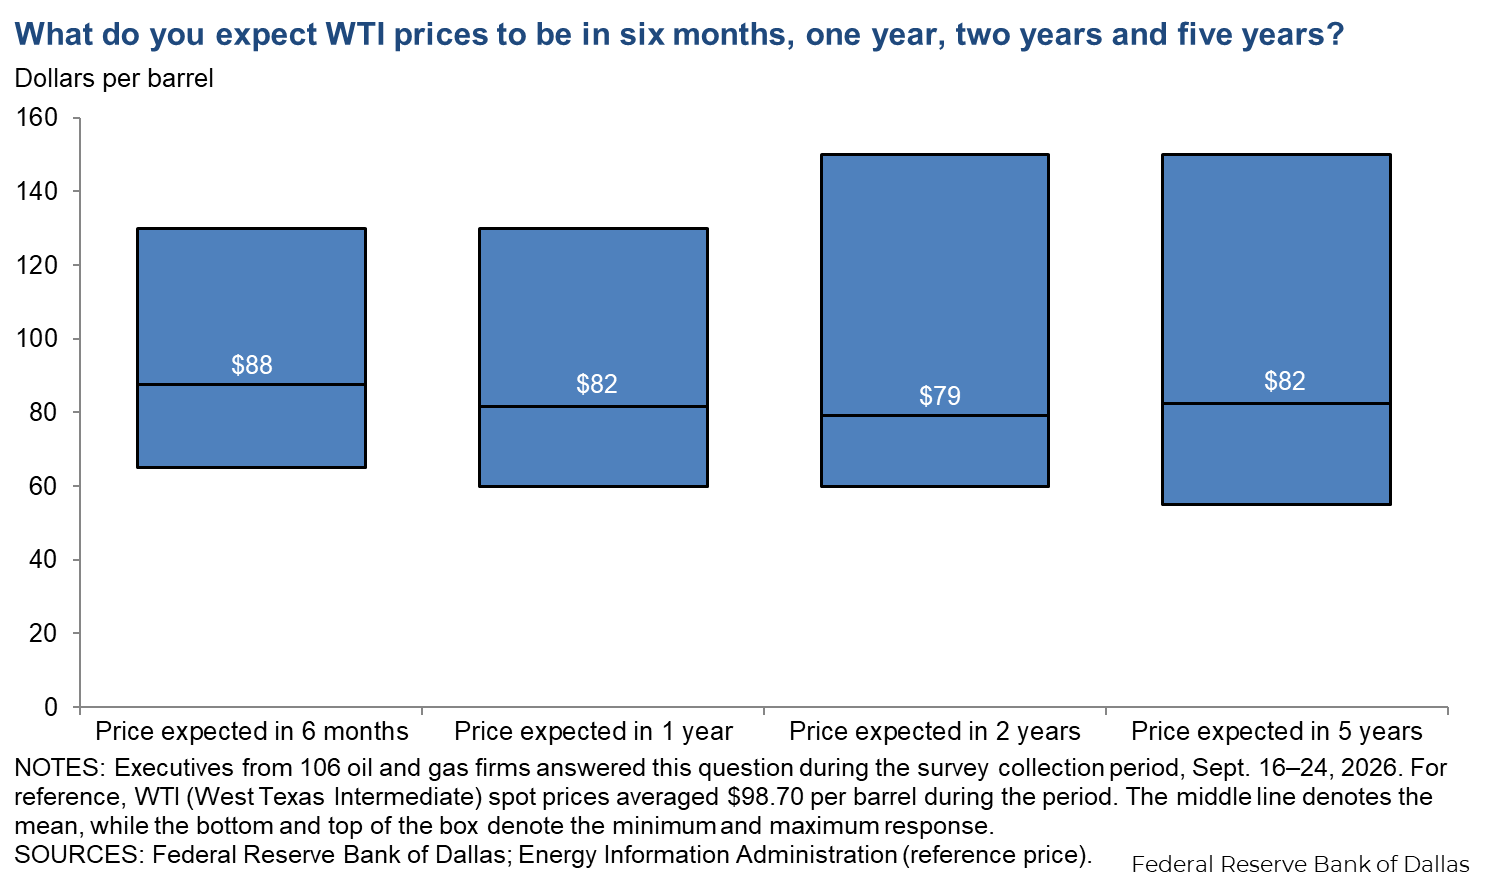
| West Texas Intermediate crude oil price, year-end 2026 | ||||
| Indicator | Survey average | Low forecast | High forecast | Price during survey |
Current quarter | $88.38 | $70.00 | $126.00 | $98.70 |
Prior quarter | $80.55 | $60.00 | $150.00 | $87.27 |
| NOTE: Price during survey is an average of daily spot prices during the survey collection period. SOURCES: Federal Reserve Bank of Dallas; Energy Information Administration. | ||||
Henry Hub Natural Gas
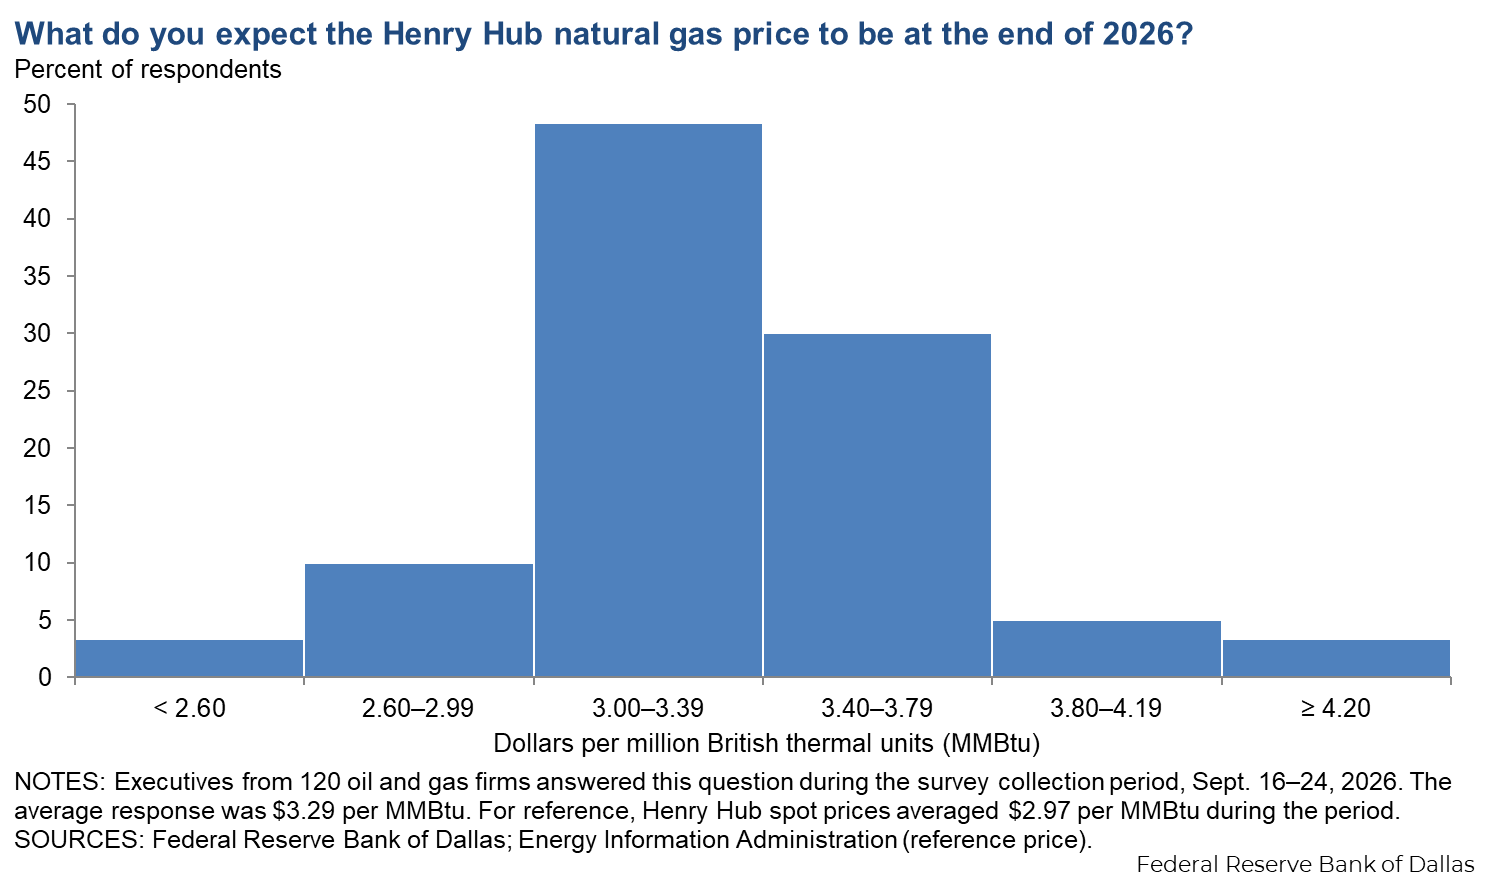
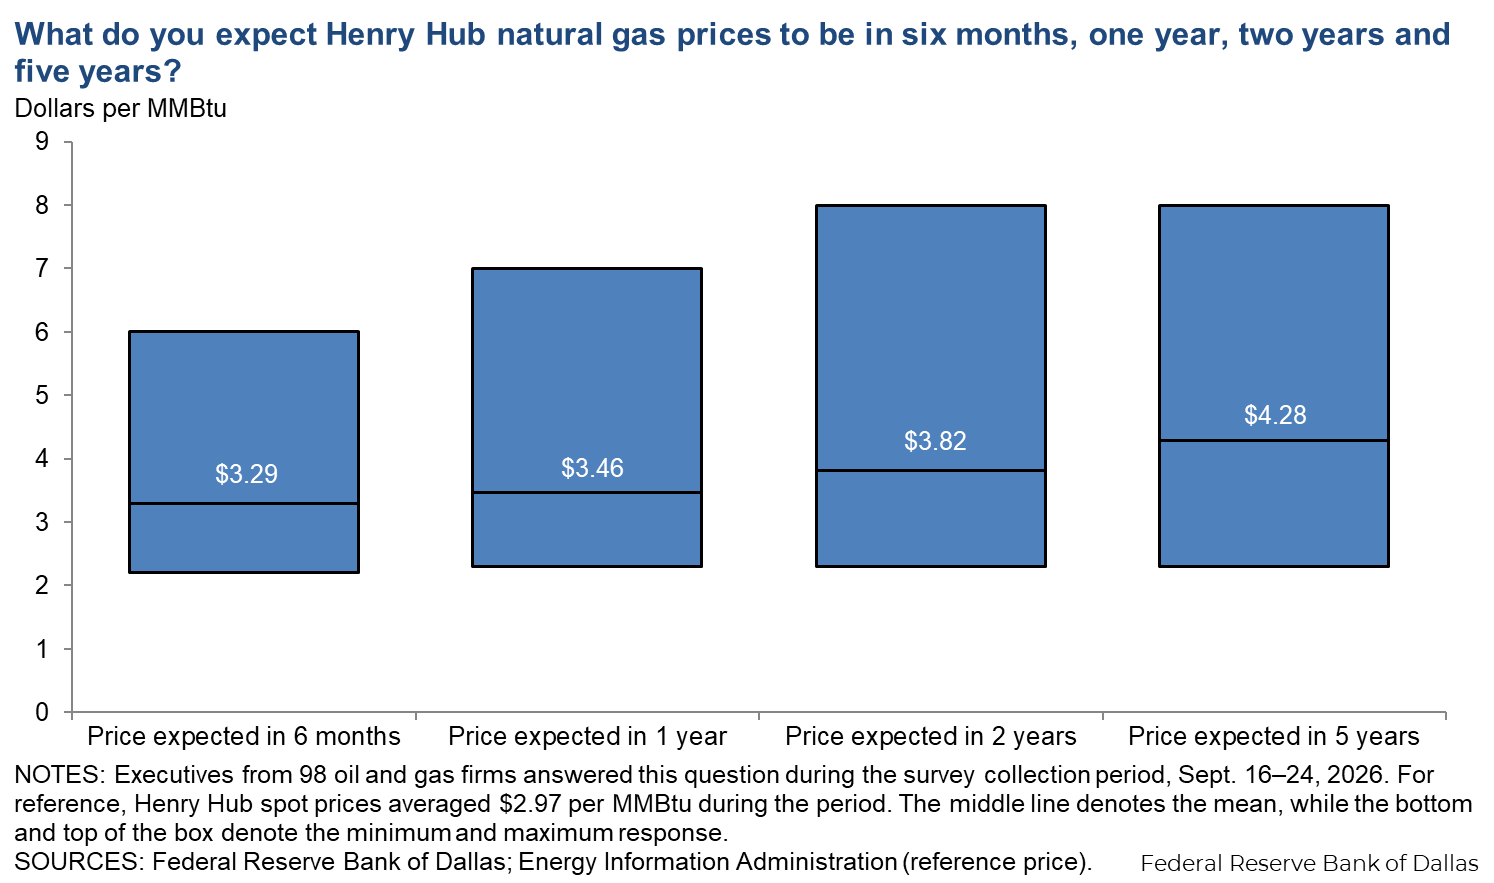
| Henry Hub natural gas price, year-end 2026 | ||||
| Indicator | Survey average | Low forecast | High forecast | Price during survey |
Current quarter | $3.29 | $2.20 | $8.00 | $2.97 |
Prior quarter | $3.36 | $2.00 | $4.65 | $3.15 |
| NOTE: Price during survey is an average of daily spot prices during the survey collection period. SOURCES: Federal Reserve Bank of Dallas; Energy Information Administration. | ||||
Special questions
Data were collected Sept. 16–24; 125 oil and gas firms responded to the special questions survey.
All firms
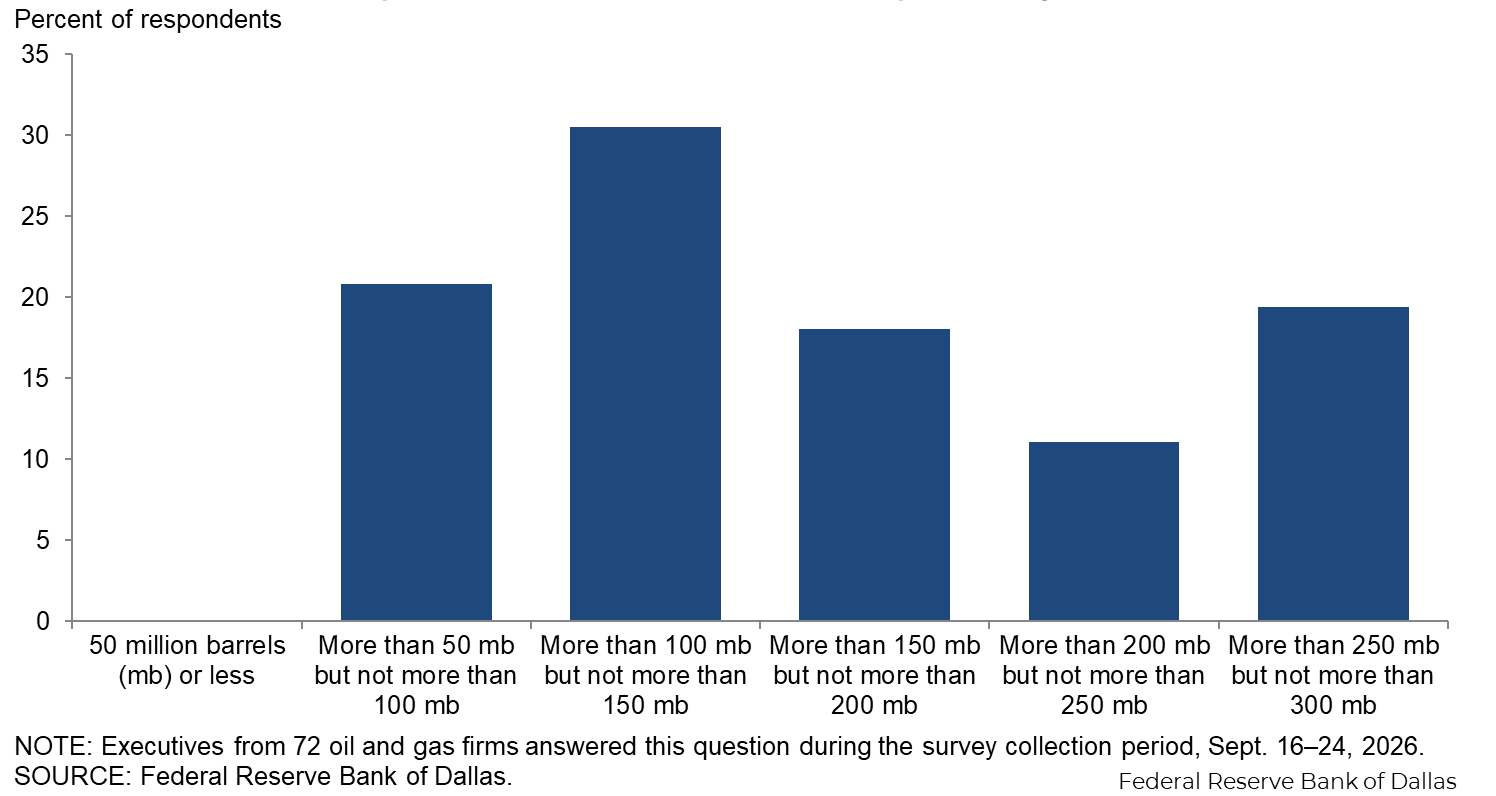
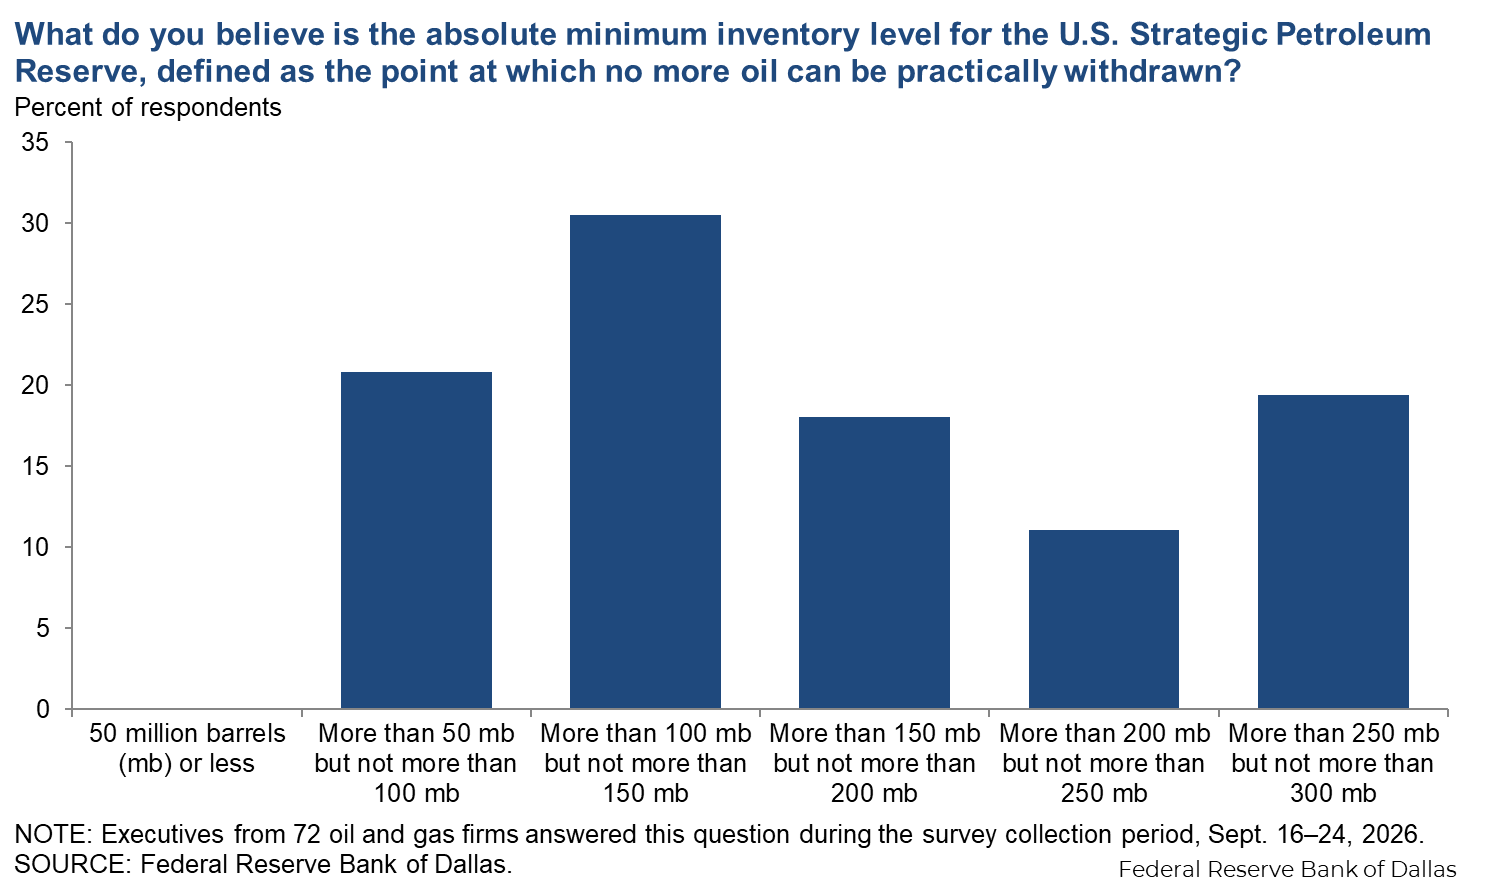
What do you believe is the absolute minimum inventory level for the U.S. Strategic Petroleum Reserve (SPR), defined as the point at which no more oil can be practically withdrawn?
The largest share of executives surveyed—31 percent—believe the absolute minimum inventory level for the U.S. Strategic Petroleum Reserve is more than 100 million barrels (mb) but not more than 150 mb. Additionally, 21 percent of executives consider the minimum to be more than 50 mb but not more than 100 mb, while 19 percent think it is more than 250 mb but not more than 300 mb. Although responses varied, most were below the current SPR inventory level of 285 mb as of Sept. 18.
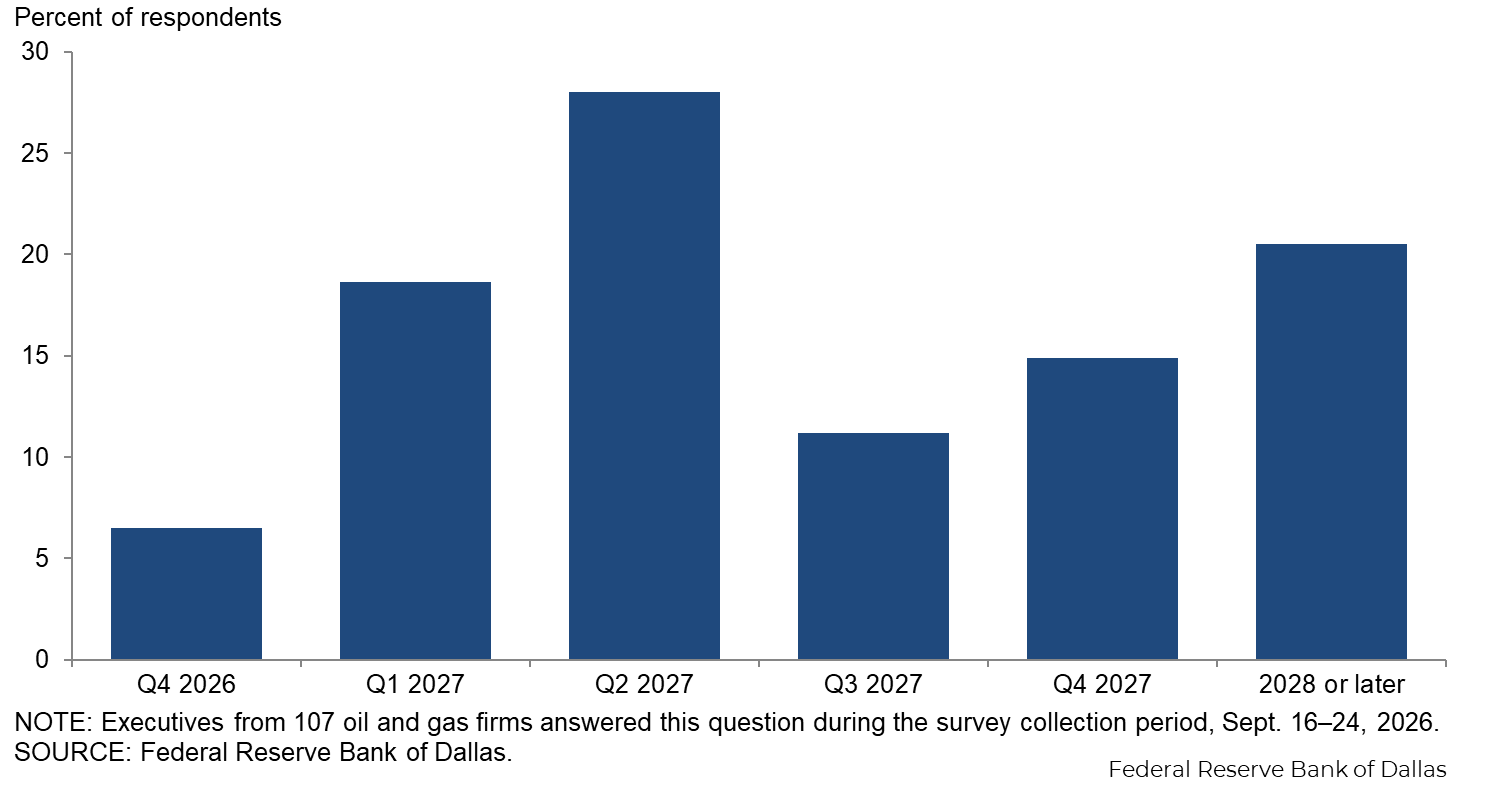
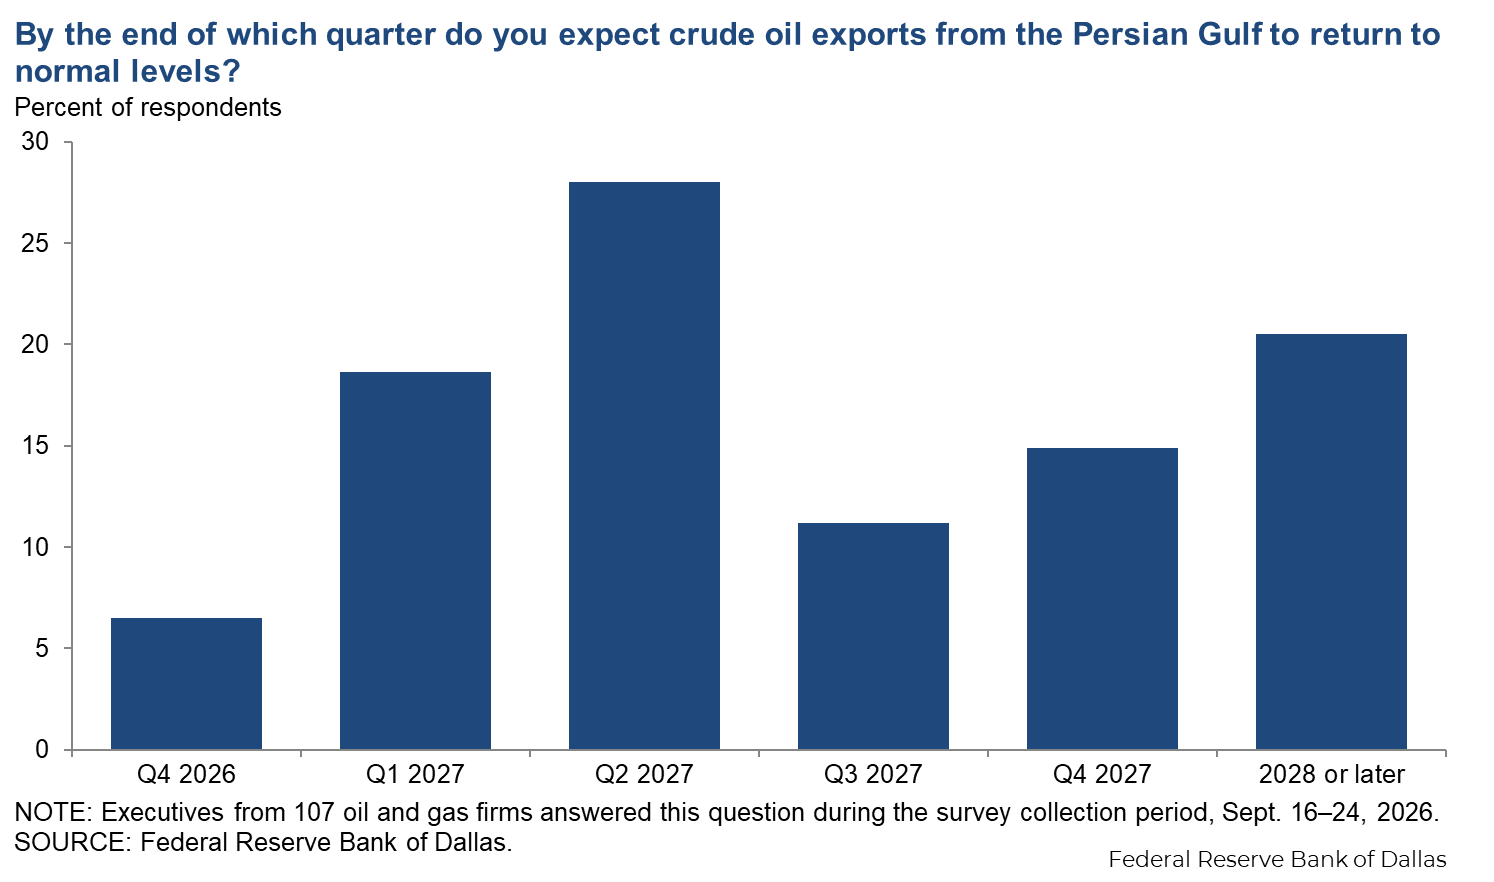
By the end of which quarter do you expect crude oil exports from the Persian Gulf to return to normal levels?
Most respondents anticipate that crude oil exports from the Persian Gulf will require some time to return to normal levels. The most frequently selected time frame was by second quarter 2027 (28 percent of participants). That was followed by 2028 or later (21 percent of respondents) and first quarter 2027 (19 percent of respondents).
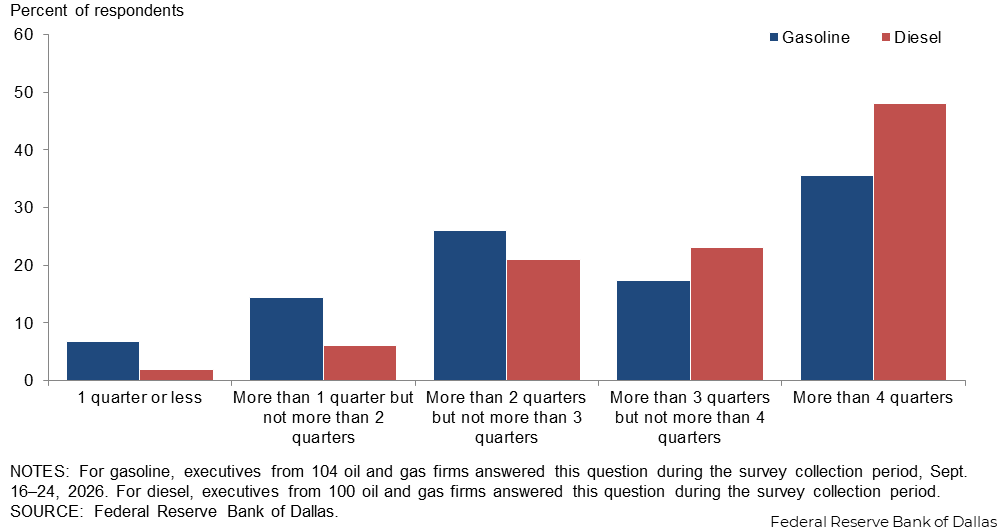
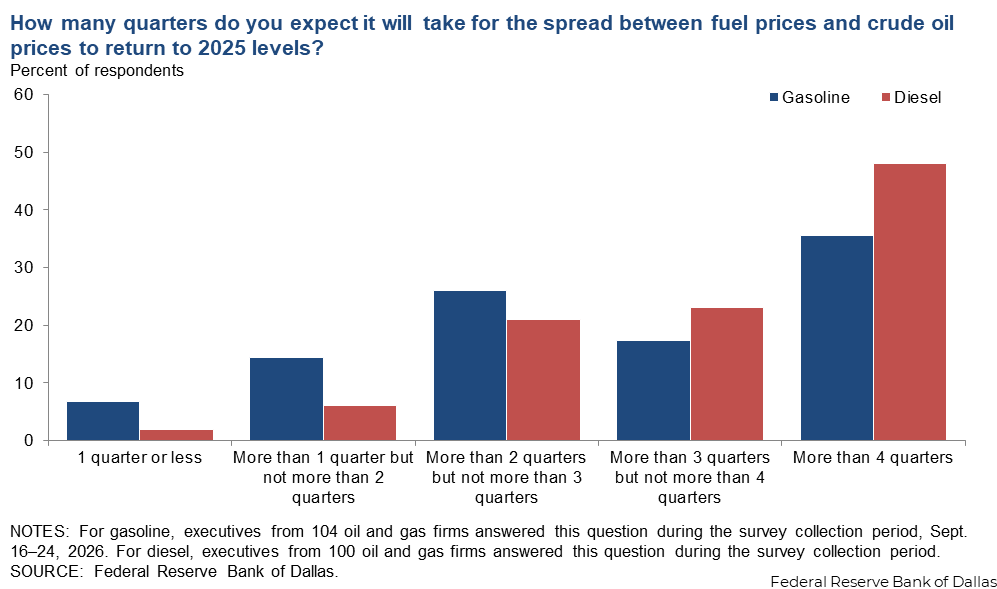
How many quarters do you expect it will take for the spread between fuel prices and crude oil prices to return to 2025 levels?
For both gasoline and diesel, “more than four quarters” was the most-selected response. Nearly half of executives (48 percent) expect diesel prices will take more than four quarters to return to 2025 levels, compared with 36 percent who anticipate the same for gasoline.
Exploration and production (E&P)
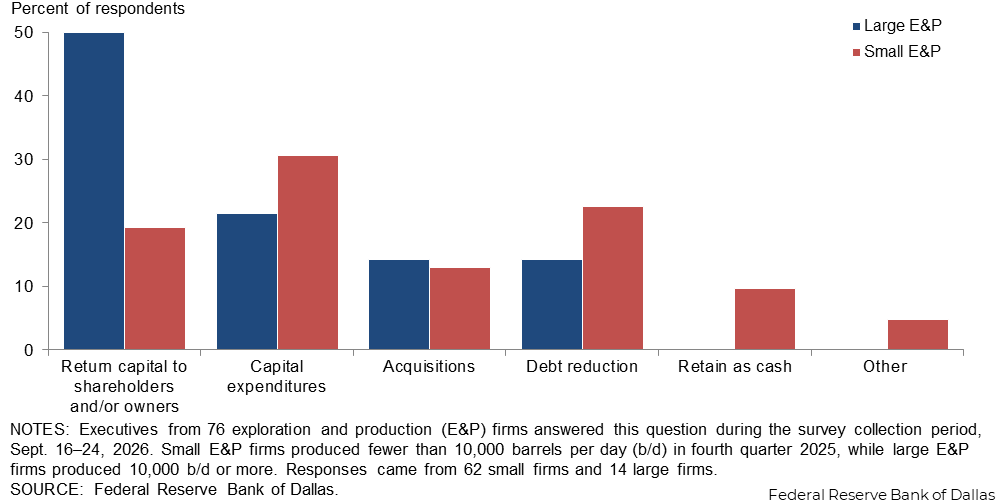
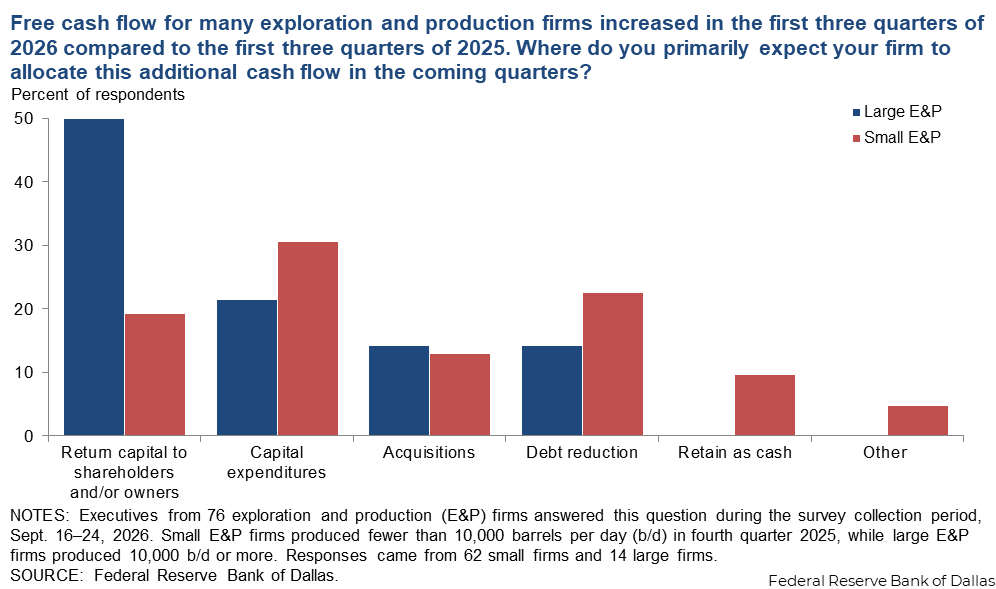
Free cash flow for many exploration and production firms increased in the first three quarters of 2026 compared to the first three quarters of 2025. Where do you primarily expect your firm to allocate this additional cash flow in the coming quarters?
Responses differed depending on firm size and type. E&P firms were classified as small if they produced fewer than 10,000 barrels per day (b/d) or large if they produced 10,000 b/d or more. In the U.S., small E&P firms are greater in number, but large E&P firms make up the majority of production (more than 80 percent).
Among large E&P firms, the majority of executives—50 percent—expect their firm to allocate additional cash flow (largely accumulated earlier in 2026) as capital return to shareholders and/or owners. Capital expenditures ranked second, selected by 21 percent of executives. By comparison, for small E&P firms, the top choice was capital expenditures, selected by 31 percent of executives, followed by debt reduction, cited by 23 percent of executives.
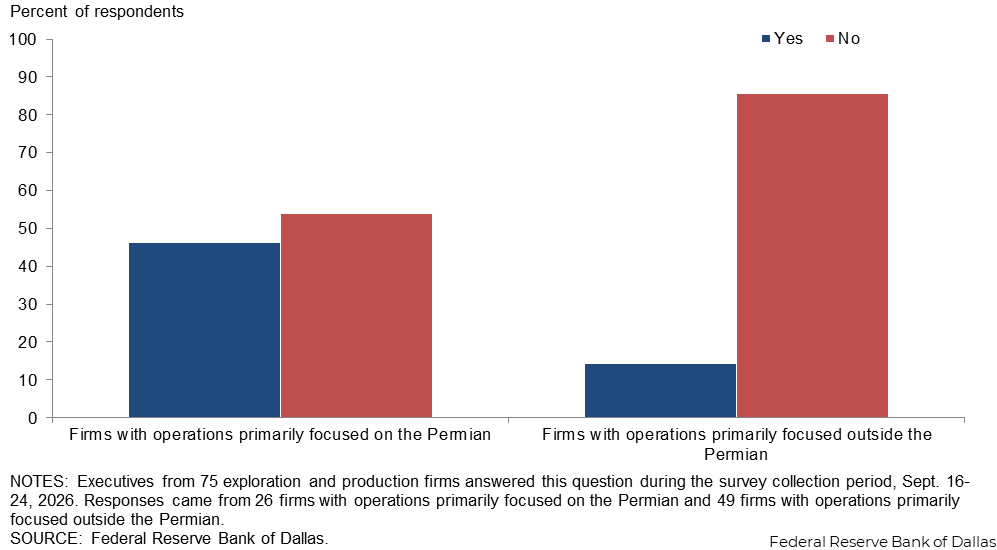
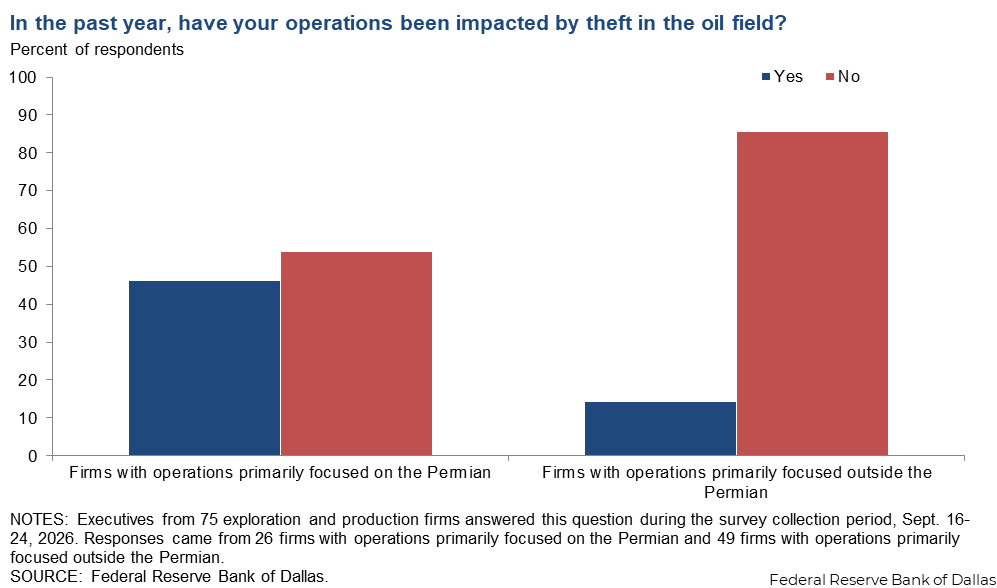
In the past year, have your operations been impacted by theft in the oil field?
Executives were asked whether their firm’s operations primarily focus on the Permian Basin or on other basins. Among those whose firms concentrate on the Permian Basin, 46 percent reported experiencing theft. In contrast, only 14 percent of executives whose firms focus on other basins indicated that theft affected operations.
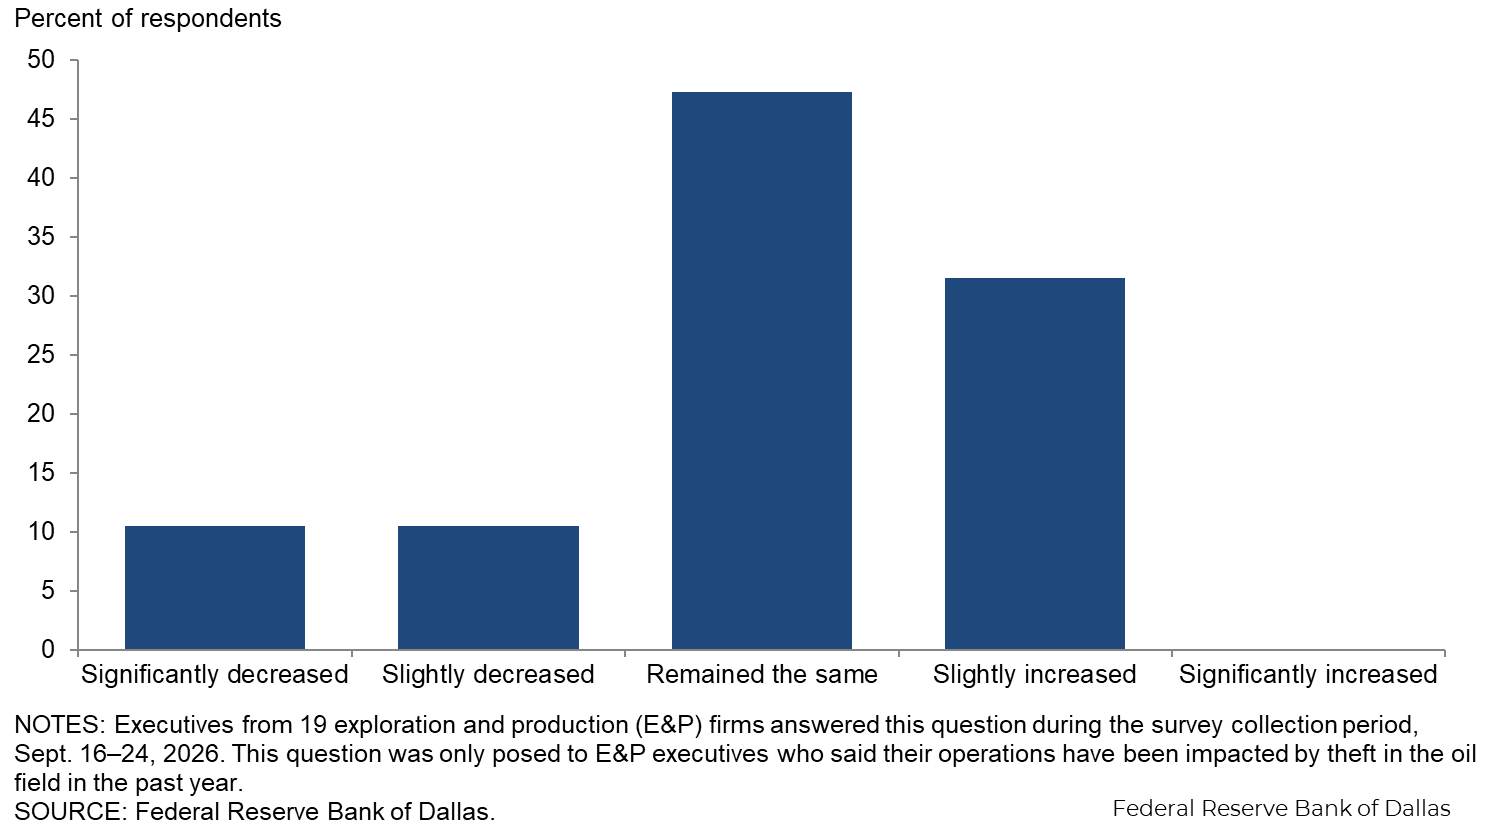
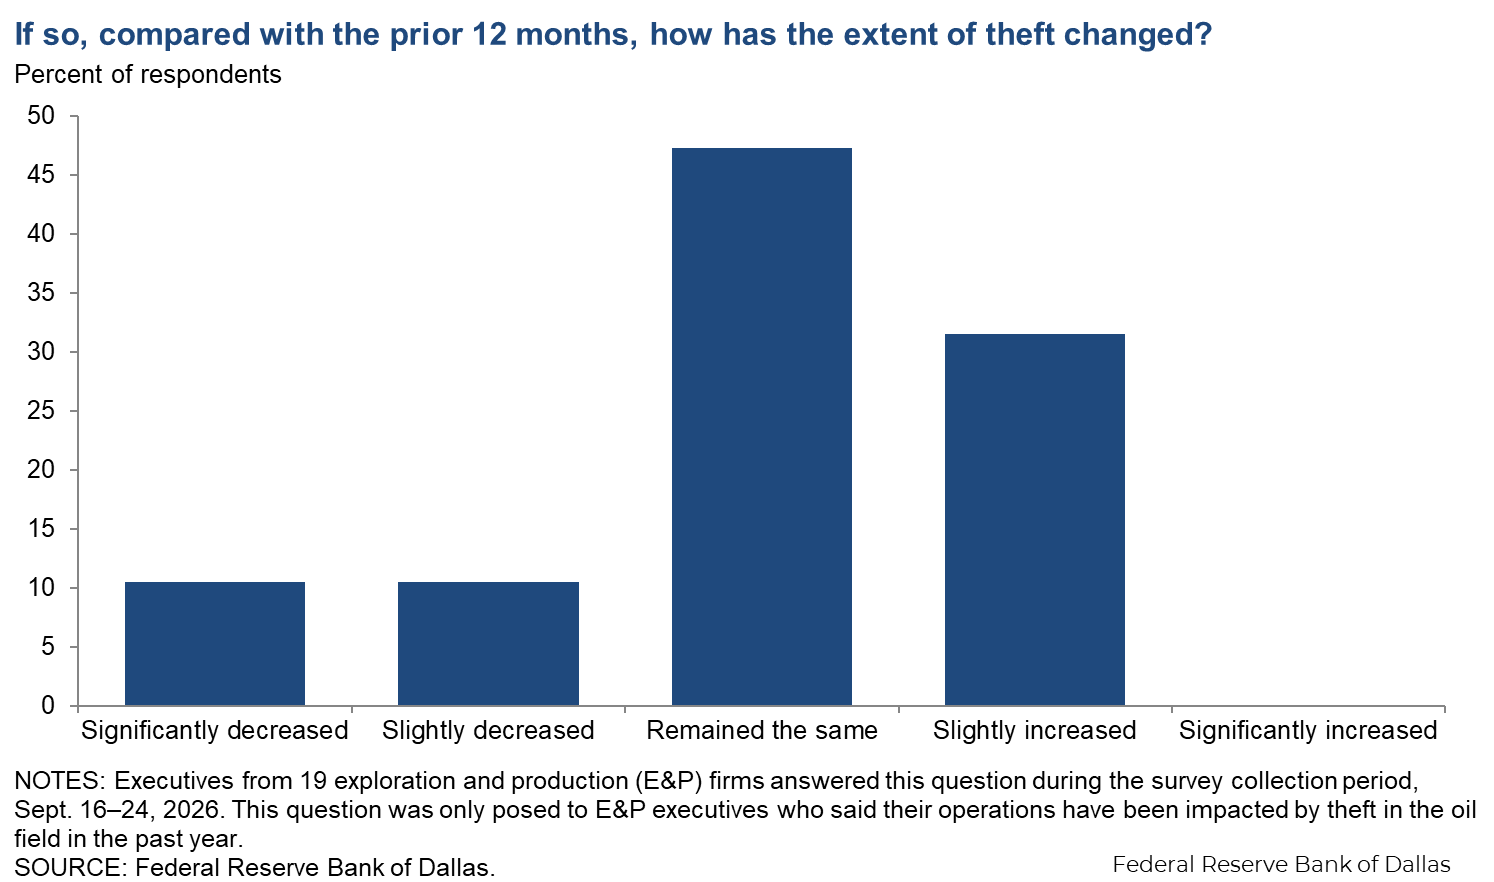
If so, compared with the prior 12 months, how has the extent of theft changed?
This question was only posed to E&P executives who said oilfield theft affected their operations in the past year. Overall, executives at firms impacted by theft indicated that the extent of theft was largely unchanged from the previous 12 months.
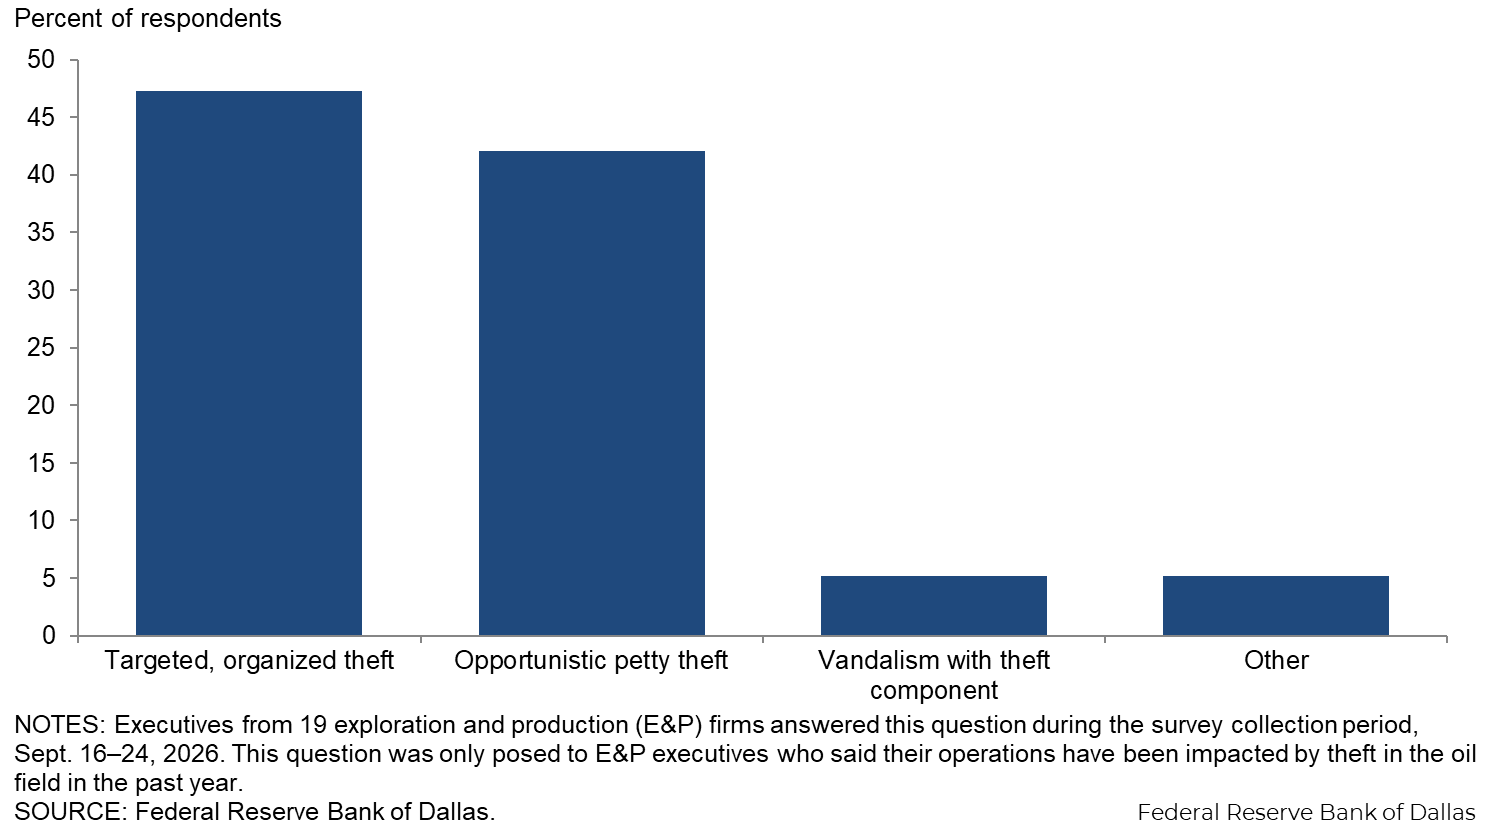
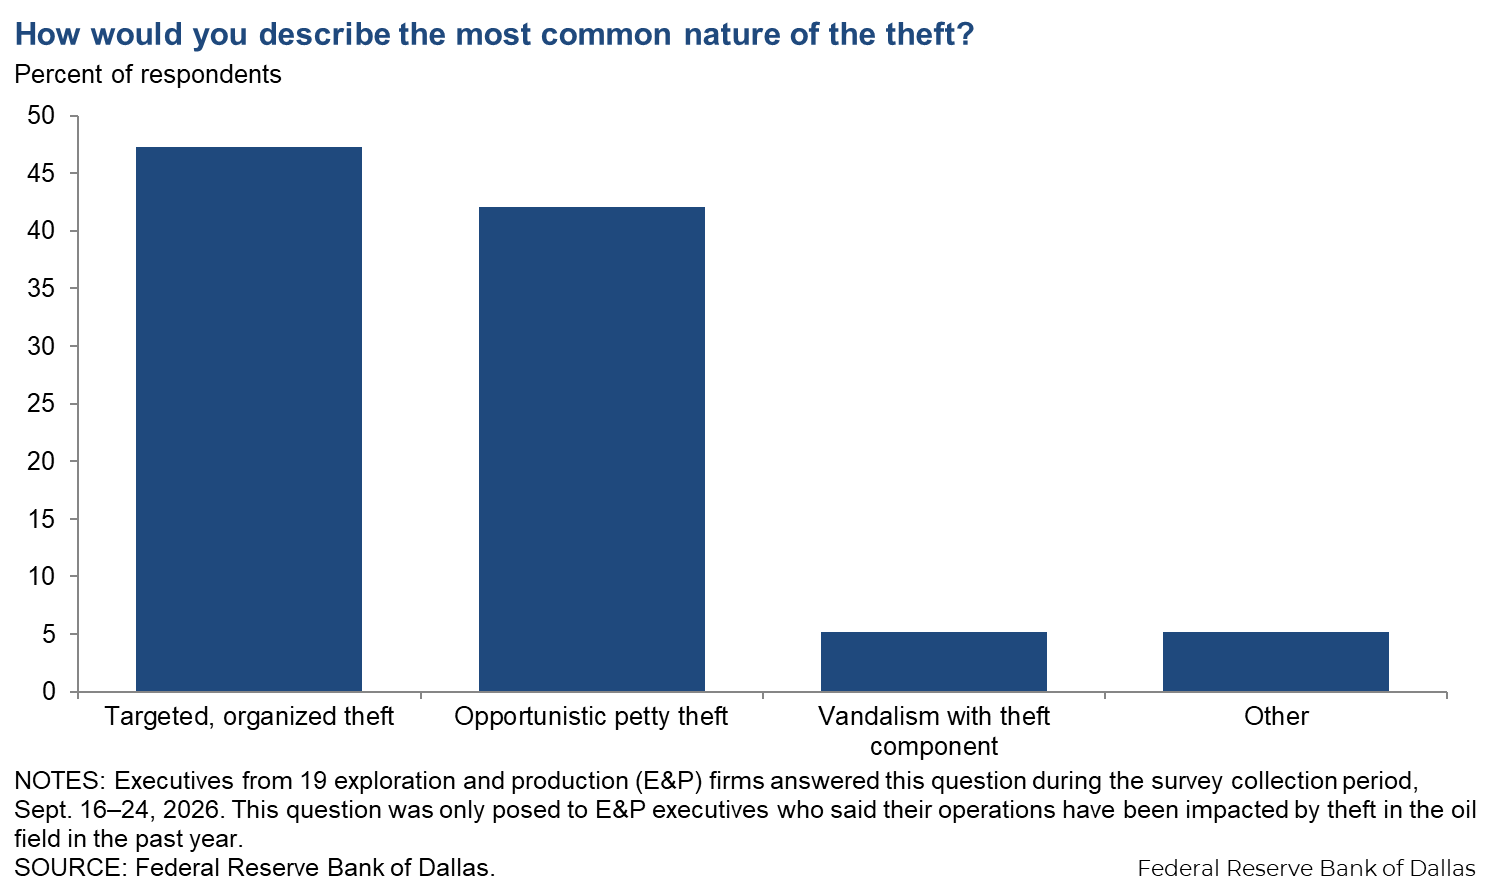
How would you describe the most common nature of the theft?
This question was only posed to E&P executives who said oilfield theft affected operations in the past year. The most-selected response was "targeted, organized theft" (47 percent of respondents), followed by “opportunistic petty theft” (42 percent of respondents).
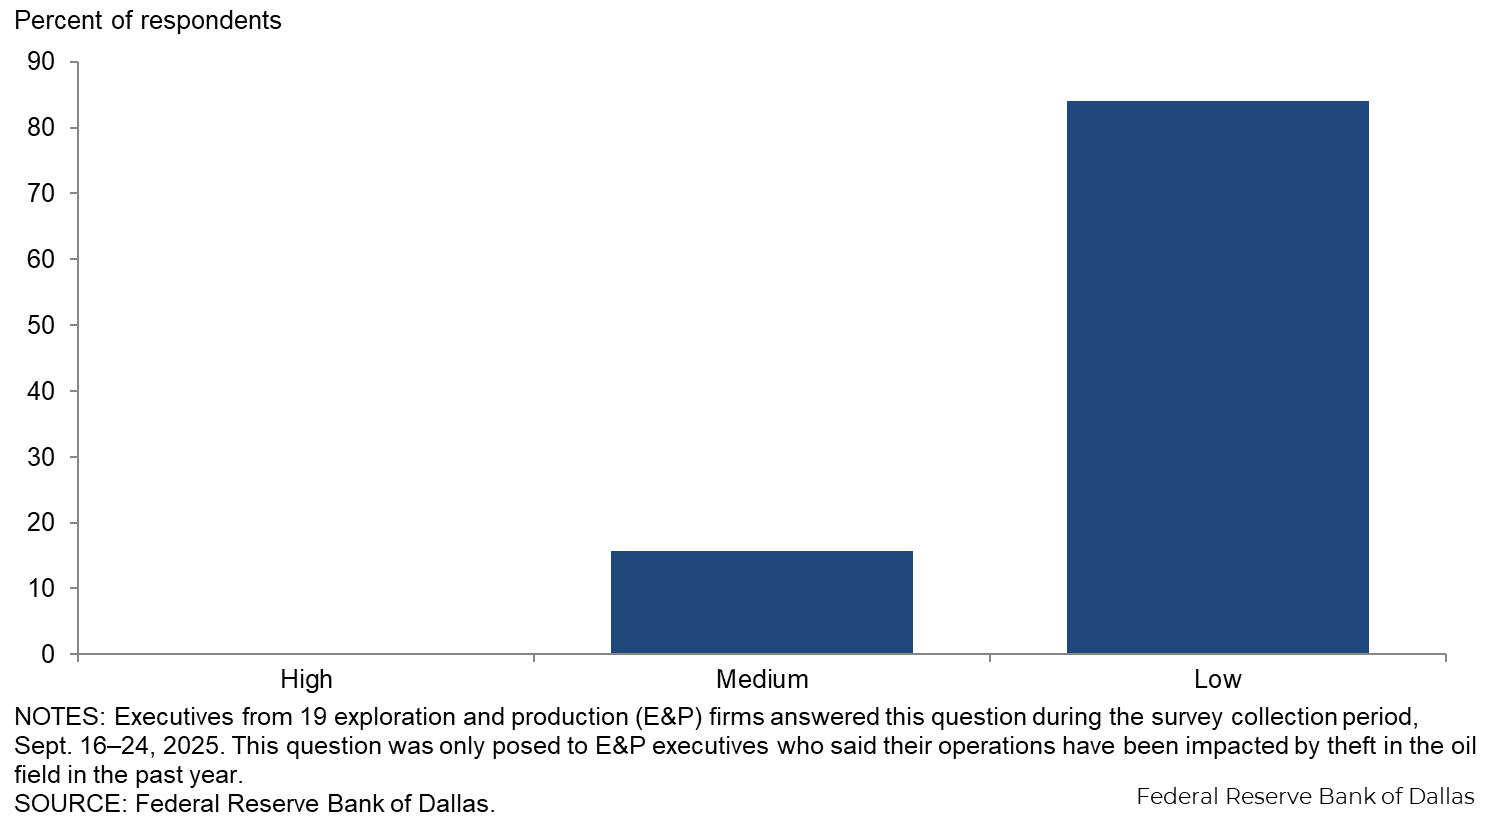
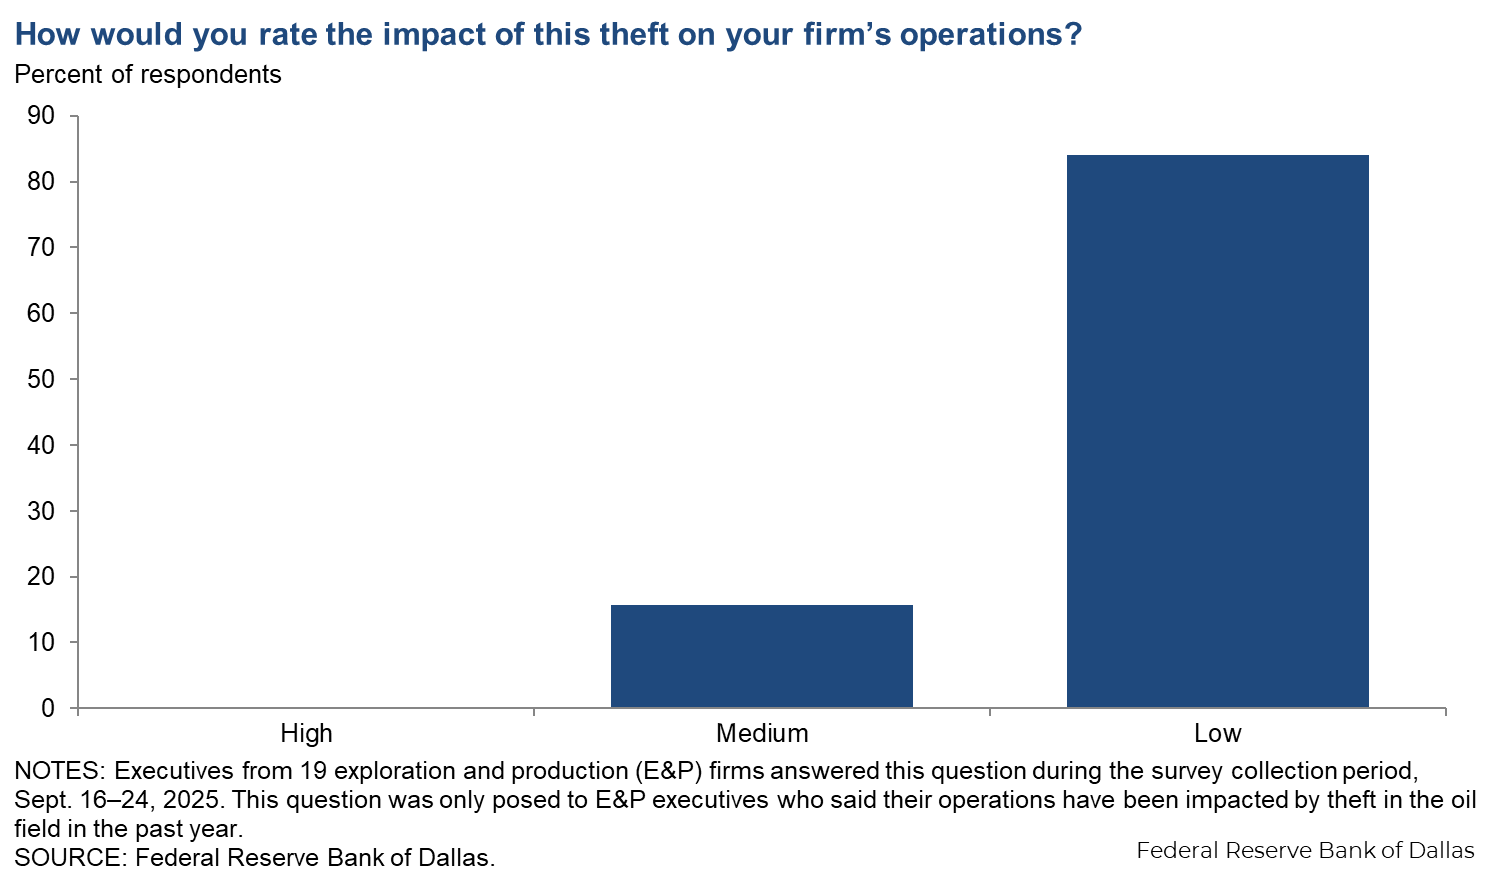
How would you rate the financial impact of the theft on your firm?
This question was only posed to E&P executives who said oilfield theft had affected operations in the past year. Most rated the financial impact of theft on their firm as low. However, some executives at small E&P firms rated the financial impact as medium (see table below).
| Percent of respondents (among each group) | |||
| All E&P | Large E&P | Small E&P | |
| High | 0 | 0 | 0 |
| Medium | 16 | 0 | 21 |
| Low | 84 | 100 | 79 |
| NOTES: Executives from 19 exploration and production (E&P) firms answered this question during the survey collection period, Sept. 16–24, 2026. Small E&P firms produced fewer than 10,000 barrels per day (b/d) in fourth quarter 2025, while large E&P firms produced 10,000 b/d or more. Responses came from 14 small firms and five large firms. This question was only posed to E&P executives who said their operations have been impacted by theft in the oil field in the past year. SOURCE: Federal Reserve Bank of Dallas. | |||
Special questions comments
Exploration and production (E&P) firms
- Regulatory uncertainty poses a material risk to business investment. When administrations’ priorities shift sharply every two to four years, companies face a dilemma: Invest in initiatives the current administration favors or avoid them due to reversal risk under the next administration. This creates decision paralysis as executives defer capital deployment rather than risk stranded investments. The economic consequence is slower productivity growth and capital inefficiency.
- Producers are not seeing all the benefits of the increased crude oil and gasoline prices—refiners are reaping the majority of those benefits.
- We are living through wild times, but it is not the first crisis energy companies have had to weather. A lot of companies have been focused on free cash flow since the pandemic and even before then, so they are now reaping the fruits of cash management via significant enhancements to free cash flow yield on producing assets.
- Material and labor costs continue to rise. Margins are being squeezed, and the cost of funding via debt continues to rise.
- War impact, refinery impact and demand impact are issues affecting our business.
- A global recession could ease the pressure on prices for crude and refined products.
- High monthly leasehold costs are affecting our firm.
Oil and gas support services firms
- I am unsure if crude exports from the Persian Gulf will ever return to normal levels, and I anticipate a new, lower baseline for normal when the conflict ends.
- Eighty percent of the Strategic Petroleum Reserve (SPR) is in phase 2 and phase 3 caverns, giving them reasonable recovery rates (we are assuming 90 percent) with limited damage to the cavern during drawdown. Twenty percent of SPR is in phase 1 caverns, and we're carrying at 50 percent due to their limited remaining drawdowns versus cavern integrity.
- I don't think Russian diesel exports will resume anytime soon, and China may hold the refining cards and ability to supply.
- Diesel is the mother’s milk of the economy. We are just starting to see the impact on the wider economy.
- Spreads between WTI, diesel and gasoline will quickly come into equilibrium because markets will require them to. Finished-product pricing will drag the price of crude oil up quickly.
Additional comments »
Historical data are available from first quarter 2016 to the most current release quarter.
Business indicators: quarter/quarter
| Business Indicators: All Firms Current Quarter (versus previous quarter) | |||||
| Indicator | Current Index | Previous Index | % Reporting Increase | % Reporting No Change | % Reporting Decrease |
Level of Business Activity | 38.8 | 46.1 | 44.4 | 50.0 | 5.6 |
Capital Expenditures | 32.8 | 40.9 | 44.8 | 43.2 | 12.0 |
Supplier Delivery Time | 36.2 | 31.7 | 42.7 | 50.8 | 6.5 |
Employment | 15.2 | 4.7 | 20.8 | 73.6 | 5.6 |
Employee Hours | 20.0 | 11.8 | 26.4 | 67.2 | 6.4 |
Wages and Benefits | 23.2 | 26.0 | 28.8 | 65.6 | 5.6 |
| Indicator | Current Index | Previous Index | % Reporting Improved | % Reporting No Change | % Reporting Worsened |
Company Outlook | 34.1 | 29.3 | 45.5 | 43.1 | 11.4 |
| Indicator | Current Index | Previous Index | % Reporting Increase | % Reporting No Change | % Reporting Decrease |
Uncertainty | 29.8 | 29.9 | 41.9 | 46.0 | 12.1 |
| Business Indicators: E&P Firms Current Quarter (versus previous quarter) | |||||
| Indicator | Current Index | Previous Index | % Reporting Increase | % Reporting No Change | % Reporting Decrease |
Level of Business Activity | 35.8 | 48.2 | 39.5 | 56.8 | 3.7 |
Oil Production | 20.7 | 15.0 | 32.9 | 54.9 | 12.2 |
Natural Gas Wellhead Production | 14.8 | 3.7 | 32.1 | 50.6 | 17.3 |
Capital Expenditures | 35.3 | 42.7 | 46.3 | 42.7 | 11.0 |
Expected Level of Capital Expenditures Next Year | 17.1 | 0.0 | 22.0 | 73.2 | 4.9 |
Supplier Delivery Time | 43.9 | 43.2 | 52.4 | 39.0 | 8.5 |
Employment | 9.8 | 0.0 | 15.9 | 78.0 | 6.1 |
Employee Hours | 17.1 | 12.2 | 23.2 | 70.7 | 6.1 |
Wages and Benefits | 17.1 | 23.2 | 22.0 | 73.2 | 4.9 |
Finding and Development Costs | 41.5 | 40.0 | 42.7 | 56.1 | 1.2 |
Lease Operating Expenses | 43.9 | 43.7 | 48.8 | 46.3 | 4.9 |
| Indicator | Current Index | Previous Index | % Reporting Improved | % Reporting No Change | % Reporting Worsened |
Company Outlook | 50.0 | 48.2 | 55.0 | 40.0 | 5.0 |
| Indicator | Current Index | Previous Index | % Reporting Increase | % Reporting No Change | % Reporting Decrease |
Uncertainty | 40.2 | 34.1 | 50.0 | 40.2 | 9.8 |
| Business Indicators: O&G Support Services Firms Current Quarter (versus previous quarter) | |||||
| Indicator | Current Index | Previous Index | % Reporting Increase | % Reporting No Change | % Reporting Decrease |
Level of Business Activity | 44.2 | 42.3 | 53.5 | 37.2 | 9.3 |
Utilization of Equipment | 41.9 | 31.9 | 51.2 | 39.5 | 9.3 |
Capital Expenditures | 27.9 | 37.7 | 41.9 | 44.2 | 14.0 |
Supplier Delivery Time | 21.4 | 11.1 | 23.8 | 73.8 | 2.4 |
Lag Time in Delivery of Firm's Services | 7.0 | 8.9 | 9.3 | 88.4 | 2.3 |
Employment | 25.5 | 13.3 | 30.2 | 65.1 | 4.7 |
Employment Hours | 25.6 | 11.1 | 32.6 | 60.5 | 7.0 |
Wages and Benefits | 34.9 | 31.2 | 41.9 | 51.2 | 7.0 |
Input Costs | 60.4 | 64.4 | 65.1 | 30.2 | 4.7 |
Prices Received for Services | 16.3 | 24.5 | 23.3 | 69.8 | 7.0 |
Operating Margin | 37.2 | 52.2 | 48.8 | 39.5 | 11.6 |
| Indicator | Current Index | Previous Index | % Reporting Improved | % Reporting No Change | % Reporting Worsened |
Company Outlook | 4.6 | –4.4 | 27.9 | 48.8 | 23.3 |
| Indicator | Current Index | Previous Index | % Reporting Increase | % Reporting No Change | % Reporting Decrease |
Uncertainty | 9.5 | 22.2 | 26.2 | 57.1 | 16.7 |
Business indicators: year/year
| Business Indicators: All Firms Current Quarter (versus same quarter a year ago) | |||||
| Indicator | Current Index | Previous Index | % Reporting Increase | % Reporting No Change | % Reporting Decrease |
Level of Business Activity | 46.2 | 40.4 | 54.6 | 37.0 | 8.4 |
Capital Expenditures | 35.8 | 32.8 | 48.3 | 39.2 | 12.5 |
Supplier Delivery Time | 39.0 | 32.3 | 44.9 | 49.2 | 5.9 |
Employment | 14.2 | 7.2 | 27.5 | 59.2 | 13.3 |
Employee Hours | 16.7 | 12.1 | 29.2 | 58.3 | 12.5 |
Wages and Benefits | 46.6 | 44.8 | 53.3 | 40.0 | 6.7 |
| Indicator | Current Index | Previous Index | % Reporting Improved | % Reporting No Change | % Reporting Worsened |
Company Outlook | 41.6 | 25.5 | 56.6 | 28.3 | 15.0 |
| Business Indicators: E&P Firms Current Quarter (versus same quarter a year ago) | |||||
| Indicator | Current Index | Previous Index | % Reporting Increase | % Reporting No Change | % Reporting Decrease |
Level of Business Activity | 46.2 | 45.0 | 51.3 | 43.6 | 5.1 |
Oil Production | 26.9 | 26.6 | 42.3 | 42.3 | 15.4 |
Natural Gas Wellhead Production | 16.7 | 10.0 | 34.6 | 47.4 | 17.9 |
Capital Expenditures | 38.0 | 44.3 | 49.4 | 39.2 | 11.4 |
Expected Level of Capital Expenditures Next Year | 14.1 | 3.7 | 20.5 | 73.1 | 6.4 |
Supplier Delivery Time | 44.9 | 42.5 | 52.6 | 39.7 | 7.7 |
Employment | 8.8 | 7.5 | 21.5 | 65.8 | 12.7 |
Employee Hours | 15.2 | 15.0 | 25.3 | 64.6 | 10.1 |
Wages and Benefits | 38.0 | 44.5 | 44.3 | 49.4 | 6.3 |
Finding and Development Costs | 53.2 | 48.8 | 53.2 | 46.8 | 0.0 |
Lease Operating Expenses | 50.0 | 60.0 | 56.4 | 37.2 | 6.4 |
| Indicator | Current Index | Previous Index | % Reporting Improved | % Reporting No Change | % Reporting Worsened |
Company Outlook | 52.7 | 50.0 | 59.5 | 33.8 | 6.8 |
| Business Indicators: O&G Support Services Firms Current Quarter (versus same quarter a year ago) | |||||
| Indicator | Current Index | Previous Index | % Reporting Increase | % Reporting No Change | % Reporting Decrease |
Level of Business Activity | 46.4 | 31.8 | 61.0 | 24.4 | 14.6 |
Utilization of Equipment | 50.0 | 28.6 | 60.0 | 30.0 | 10.0 |
Capital Expenditures | 31.7 | 11.6 | 46.3 | 39.0 | 14.6 |
Supplier Delivery Time | 27.5 | 13.7 | 30.0 | 67.5 | 2.5 |
Lag Time in Delivery of Firm's Services | 19.6 | 9.1 | 22.0 | 75.6 | 2.4 |
Employment | 24.4 | 6.8 | 39.0 | 46.3 | 14.6 |
Employment Hours | 19.5 | 6.8 | 36.6 | 46.3 | 17.1 |
Wages and Benefits | 63.4 | 45.5 | 70.7 | 22.0 | 7.3 |
Input Costs | 65.8 | 72.7 | 70.7 | 24.4 | 4.9 |
Prices Received for Services | 36.5 | 21.4 | 46.3 | 43.9 | 9.8 |
Operating Margin | 33.3 | 46.5 | 48.7 | 35.9 | 15.4 |
| Indicator | Current Index | Previous Index | % Reporting Improved | % Reporting No Change | % Reporting Worsened |
Company Outlook | 20.5 | –16.0 | 51.3 | 17.9 | 30.8 |
Activity chart
Comments from Survey Respondents
Survey participants are given the opportunity to submit comments on current issues that may be affecting their businesses. Some comments have been edited for grammar and clarity. Comments from the Special Questions survey can be found below the special questions.
Exploration and production (E&P) firms
- The Iranian conflict continues to be the wild card in the industry. Its movement correlates with commodity prices.
- We are getting to the point in this global conflict and its effect on commodity markets that it is tough to predict what the remainder of 2026 and also 2027 will potentially look like.
- Pricing volatility is near an all-time high given the backdrop of Iran. Swings of $5, $10 and $20 up or down are common. It is very challenging to select a planning price or budgeting price. Companies must look at the steep backwardation and budget off of a $65 per barrel or $70 per barrel price while operating expenses per barrel and finding and development pricing is increasing quickly.
- The WTI crude oil price will be in the range of $75 to $100 per barrel. It is totally dependent on the war with Iran and the continued turmoil in the Middle East.
- Instability will be the word for energy markets with no end in sight until the oil delivery stabilizes in the Middle East. Most instability is tied to the 2026 Iran war. Remember the oil markets from 2012–2020? One hundred dollars per barrel to extreme lows of -$30 per barrel. What an economic turmoil that was. Is 2026 a repeat?
- For independents, credit for investment capital is tight, with many banks cutting back on their lending. Most banks do not lend except on the tightest terms. This hurts smaller companies’ ability to compete.
- War issues affect futures. Refinery capacity is the choke point now for consumer fuel needs. Domestic capacity is low and is affected by both regulations and margins.
- Increased geopolitical volatility, including tariffs, increasing cost of doing business and increasing lead times for execution are issues affecting our business.
- Uncertainty on prices caused some concern, but with increased cash flow I am spending more.
- Geopolitical uncertainty is still the primary concern of many small businesses. Decisions by the executive branch of our Federal Government seem to be driven primarily by concerns over midterm election results.
- I think the Middle East conflict will last longer than most believe.
- It sure would be nice to have a less volatile market.
- The political climate will continue to whipsaw prices until there is major change.
- There is still too much chaos, but it is leading to a bullish oil price sentiment because of all of the ramifications of what has taken place in the Middle East.
- Oil movement around the world is the major unknown today.
- I hope there is some strategic thinking and perhaps dissolution of the Organization of the Petroleum and Exporting Countries (OPEC) and a shift in the balance of energy power away from Russia and the Middle East.
- The costs of services and permitting are increasing dramatically. These are predrill costs, so they dramatically affect the bottom line.
- There will be continuing lack of predictable pricing as long as the current war is continuing. That war needs to be concluded, with the destruction of Iran's ability to continue it. There should be an effort to create an organization composed of the oil-producing countries that has enough structure to mandate coordinated marketing and delivery logistics. We can only wish that oil in all respects was not the leverage it is today in forcing political positions that result in more confusion and random market response.
- I don’t quite understand why the price is high at the pump. The U.S. has plenty of supply.
Oil and gas support services firms
- We continue to see pricing pressure from operators, which will place further downward pressure on margins and risk continued growth.
- Hundred-dollar-per-barrel oil is helping our pricing as an oil field service company, but it is not enough. Roughly 75 percent of our earnings before interest, taxes, depreciation and amortization will have to be spent on capital spending to upgrade equipment to meet our customers' requirements. These upgrades are allowing our customers to make record wells and drill less wells to capture the same production. We are working our way out of a job. Service rates need to go up more to justify the capital we are investing in the business.
- It is difficult to find people with strong work ethics who are willing to stay with you, even though starting pay is around $80,000 working half the year with great benefits.
- Diesel prices continue to erode margins. Operators are significantly more profitable due to commodity prices, but due to limitations on growth and bottlenecks in bringing new wells online, there is little to no growth in demand. The only bright point is that demand from data center construction has caused some firms to reallocate away from the energy industry.
- War in the Middle East has impacted tender activity due to uncertainty regarding the Strait of Hormuz.
- The price for WTI at the end of 2026 is dependent on multiple factors outside of normal market dynamics or the desires of the United States government. Where I do have confidence is in the bottom end of the crude oil price range not being $55 per barrel. It has moved to $65-$70, at least for the next year or two. What that does to operator spending, though, is uncertain; do they invest into a short- to mid-term nonstructural uplift in prices? What happens to the price if U.S. exploration and production firms do not respond to price signals? For production, nondrilling and completion businesses, I believe we will continue to see growing demand for more short-cycle barrels to add to production.
- My oil price crystal ball broke when the administration first hit Iran.
- Geopolitical uncertainty seems to still be holding activity back. The question is: Where will the new floor sit after the Middle East calms down? Although with WTI in the $90s per barrel and pushing $100, if prices stay here for the next month, that will hopefully be a strong motivator.
- Natural gas prices might well spike should current Asian and European liquefied natural gas storage deficits not offset a cold winter. For oil, basically, who knows? It will take time to resolve the supply side.
Questions regarding the Dallas Fed Energy Survey can be addressed to Michael Plante at Michael.Plante@dal.frb.org or Kunal Patel at Kunal.Patel@dal.frb.org.
Sign up for our email alert to be automatically notified as soon as the latest Dallas Fed Energy Survey is released on the web. For additional energy-related academic research and market analysis, please visit the Dallas Fed’s Center for Energy and the Economy.