Special Questions

Special Questions
For this month’s survey, Texas business executives were asked supplemental questions on demand expectations, pricing power and the impact of tariffs. Results below include responses from participants of all three surveys: Texas Manufacturing Outlook Survey, Texas Service Sector Outlook Survey and Texas Retail Outlook Survey.
Texas Business Outlook Surveys
Data were collected Aug. 12–20, and 331 Texas business executives responded to the surveys.
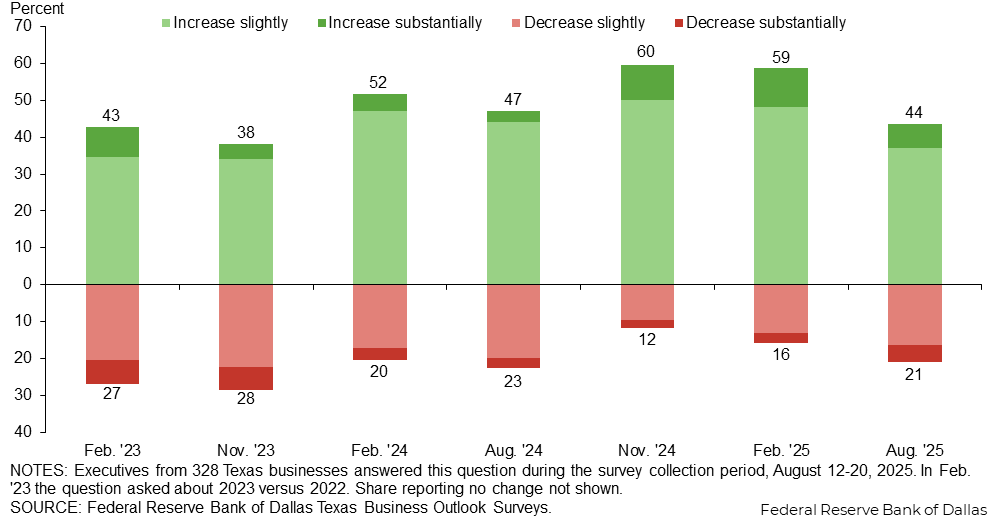
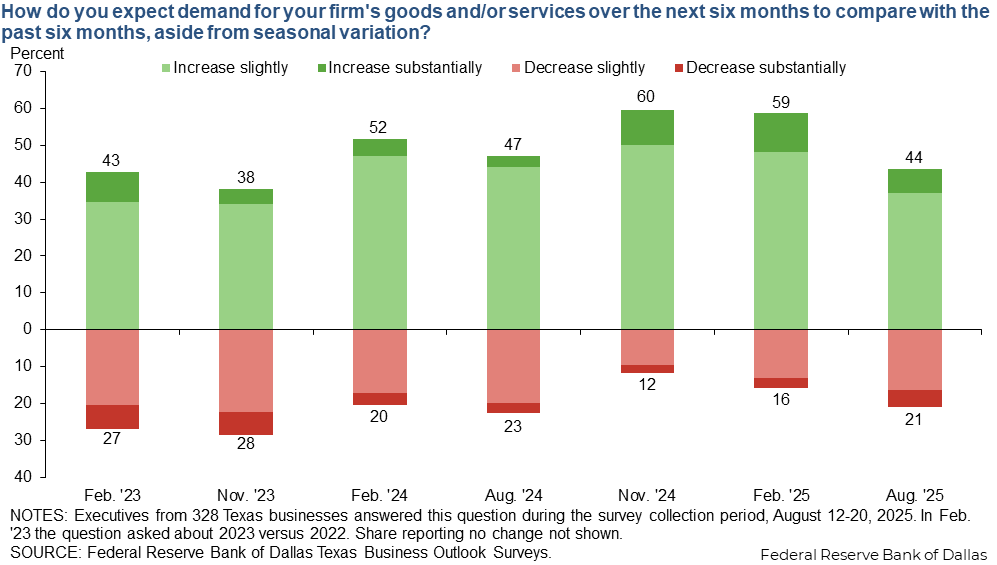
Demand is expected to improve on net over the next six months, though the spread between the share of firms anticipating an increase versus a decrease narrowed somewhat since February. Manufacturers are slightly more optimistic for their demand outlooks than service sector or retail firms are.
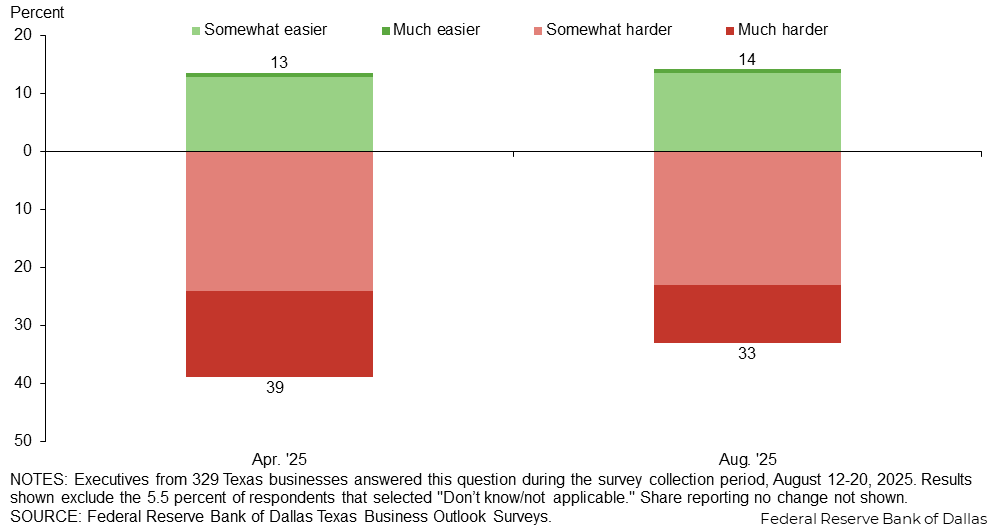
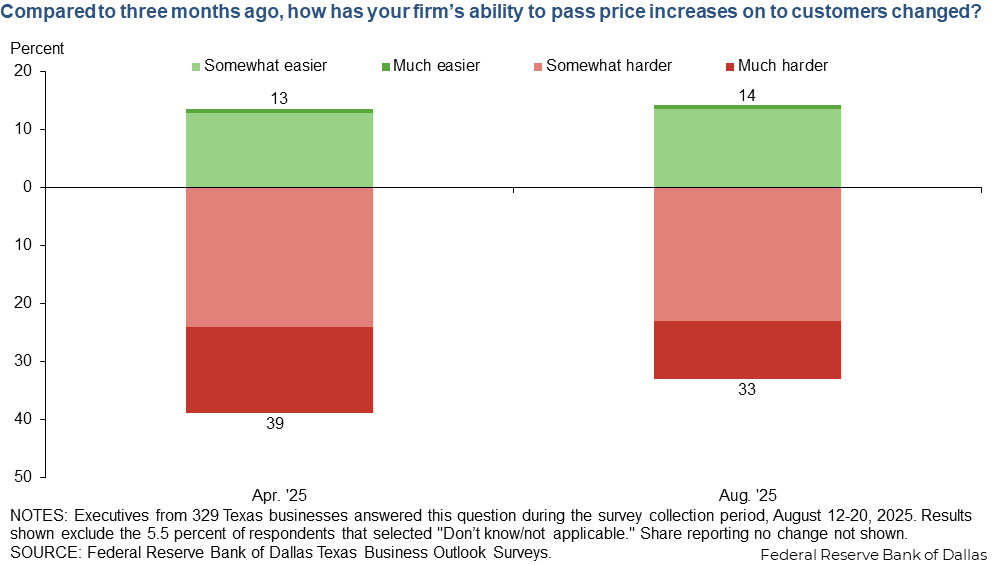
Pricing power has declined on net over the past three months as more firms said it’s gotten harder to pass price increases on to customers than said it has gotten easier.
Of those surveyed, 48 percent of businesses said they’ve been negatively impacted by higher tariffs this year. The effect is most widespread in manufacturing, where more than 70 percent of firms noted negative impacts, followed by retail, where roughly 60 percent of firms noted negative impacts.
| Aug. '25 (percent) |
|
| Yes, positive impact | 2.1 |
| Yes, negative impact | 47.7 |
| No | 38.0 |
| Don't know | 12.2 |
NOTES: 329 responses. We asked a similar question in April 2018, Sept. 2018, June 2019 and Dec. 2019 after tariffs were implemented by the first Trump administration and then most recently in April 2025.
Nearly half of firms reported increased input costs as a result of higher tariffs, and 27 percent reported increased selling prices. Margin compression was noted by nearly 40 percent of firms. Higher tariffs hampered output at 21 percent of firms and spurred output at 5 percent of firms. The impact of higher tariffs on company outlooks was generally negative.
| Significant increase (percent) |
Slight increase (percent) |
No impact (percent) |
Slight decrease (percent) |
Significant decrease (percent) |
|
| Input costs | 16.3 | 32.2 | 50.5 | 0.7 | 0.4 |
| Selling prices | 6.7 | 20.1 | 67.3 | 3.5 | 2.5 |
| Profit margins | 0.4 | 3.5 | 57.2 | 29.5 | 9.5 |
| Supplier delivery times | 1.4 | 12.7 | 73.6 | 8.8 | 3.5 |
| Production/revenue/sales | 1.4 | 3.9 | 73.2 | 15.8 | 5.6 |
| Employment | 0.0 | 1.1 | 88.3 | 8.1 | 2.5 |
| Capital spending plans | 0.7 | 6.7 | 70.9 | 13.5 | 8.2 |
| Company outlook | 0.7 | 3.9 | 61.8 | 24.4 | 9.2 |
NOTES: 160 responses. This question was only posed to those answering yes to question 3, but the results shown are calculated as the share of all firms, where those answering no to question 3 are included under “No impact.” We asked a similar question in April 2018, Sept. 2018 and June 2019 after tariffs were implemented by the first Trump administration and then most recently in April 2025.
Firms negatively impacted by tariffs were mixed on whether they passed on cost increases to customers (48 percent of firms) versus absorbed costs internally (39 percent of firms). Other top actions taken by firms in response to higher tariffs were moving up purchases and finding new suppliers. As far as actions planned, cost pass-through and finding new domestic suppliers top the list.
| Already taken (percent) |
Plan to take (percent) |
Not taking/not applicable (percent) |
|
| Passing cost increases through to customers | 48.2 | 31.9 | 22.7 |
| Absorbing cost increases internally | 38.8 | 22.3 | 40.3 |
| Moving up purchases ahead of tariff implementation | 37.0 | 11.6 | 52.9 |
| Finding new domestic supplier(s) | 23.7 | 23.7 | 54.0 |
| Finding new foreign supplier(s) | 16.7 | 15.2 | 68.8 |
| Relocating production or services to the U.S. | 8.6 | 4.3 | 87.1 |
| Scaling down operations or closing our business | 7.1 | 11.3 | 81.6 |
| Other | 3.7 | 7.4 | 88.9 |
NOTES: 153 responses. This question was only posed to those answering “Yes, negative impact” to question 3. We asked a similar question in June 2019 after tariffs were implemented by the first Trump administration and then most recently in April 2025.
Pass-through is only partial for the majority of firms passing cost increases though to customers. Full pass-through is most common among manufactures (24 percent) and least common among retailers (15 percent).
| Aug. '25 (percent) |
|
| All | 20.9 |
| Most | 35.8 |
| Some | 43.3 |
NOTES: 67 responses. This question was only posed to those answering "Passing cost increases through to customers" to question 3b. We asked a similar question in April 2025.
Nearly half of firms passing tariff costs through to customers are doing so upon tariff announcement or within a month of the tariff taking effect. An additional 28 percent are doing so one to three months after, and 11 percent beyond that. This represents a slightly slower speed of pass-through than was reported in April.
| Apr. '25 (percent) |
Aug. '25 (percent) |
|
| Upon tariff proposal/announcement | 22.5 | 15.6 |
| Less than a month after tariff takes effect | 28.8 | 32.1 |
| 1-3 months after tariff takes effect | 26.1 | 28.4 |
| 4-6 months after tariff takes effect | 5.4 | 7.3 |
| 7-12 months after tariff takes effect | 3.6 | 3.7 |
| Don't know | 13.5 | 12.8 |
NOTES: 109 responses. This question was only posed to those answering "Passing cost increases through to customers" as an action taken/planned in question 3b.
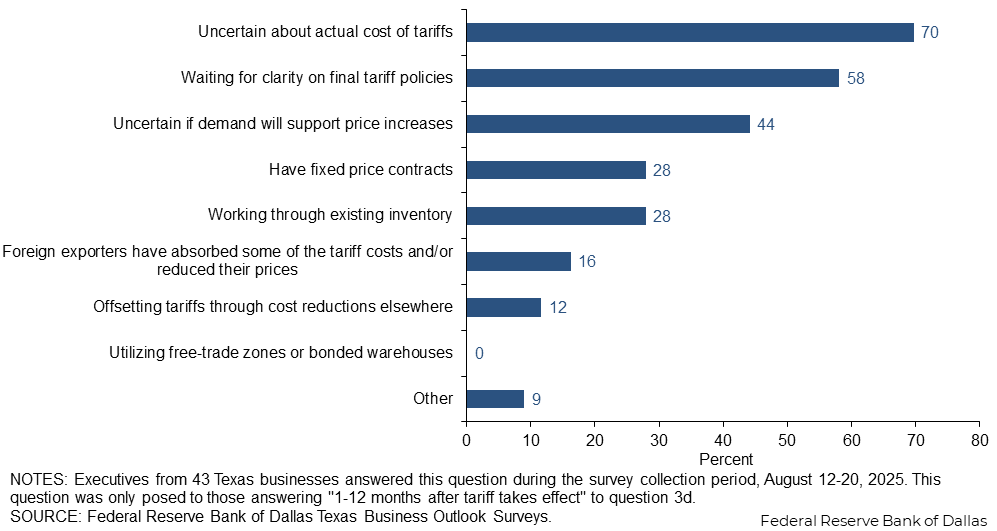
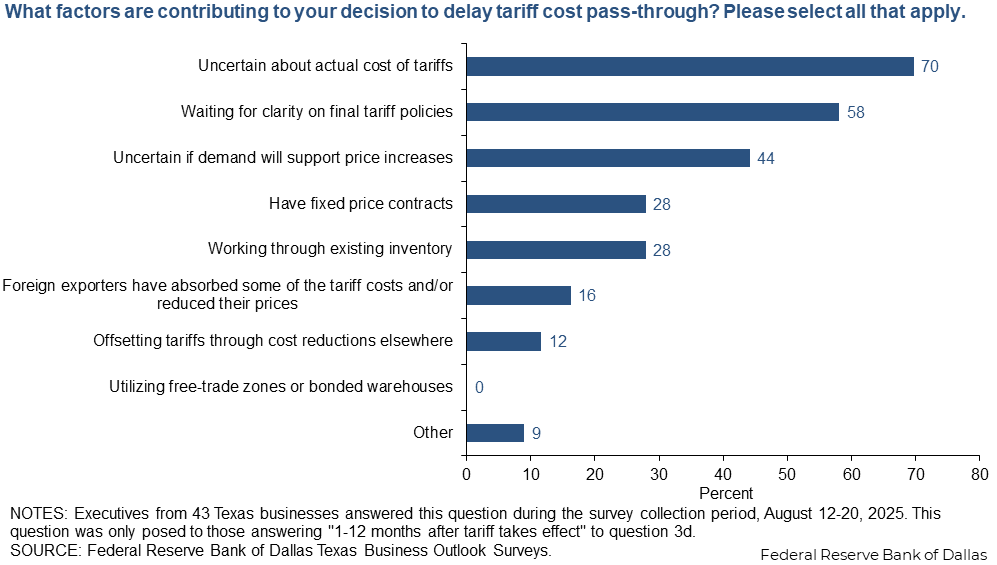
Firms waiting at least a month to pass through tariff cost increases cite uncertainty about the actual cost as the top reason for the delay. Nearly 60 percent said they are awaiting final tariff policies, and 44 percent said they are uncertain if demand will support price increases.
Among firms not already reporting an impact from higher tariffs, 19 percent expect to be negatively impacted over the remainder of the year. In manufacturing, an equal share (7 percent) expect positive impacts as expect negative impacts.
| Aug. '25 (percent) |
|
| Yes, a positive impact | 1.6 |
| Yes, a negative impact | 18.5 |
| No | 65.3 |
| Don’t know | 14.5 |
NOTES: 124 responses. This question was only posed to those answering “No” to question 3. We asked a similar question in April 2018, Sept. 2018, June 2019 and Dec. 2019 after tariffs were implemented by the first Trump administration and then most recently in April 2025.
Survey respondents were given the opportunity to also provide comments, which can be found in the Comments tab above.
Texas Business Outlook Surveys
Data were collected August 12-20, and 81 Texas manufacturers responded to the survey.
| Feb. '23 (percent) |
Nov. '23 (percent) |
Feb. '24 (percent) |
Aug. '24 (percent) |
Nov. '24 (percent) |
Feb. '25 (percent) |
Aug. '25 (percent) |
|
| Increase substantially | 11.0 | 5.7 | 5.5 | 1.3 | 14.3 | 19.8 | 12.3 |
| Increase slightly | 30.0 | 33.0 | 46.2 | 53.8 | 58.3 | 43.0 | 37.0 |
| Remain the same | 28.0 | 29.5 | 23.1 | 20.0 | 17.9 | 15.1 | 29.6 |
| Decrease slightly | 17.0 | 20.5 | 17.6 | 22.5 | 8.3 | 18.6 | 16.0 |
| Decrease substantially | 14.0 | 11.4 | 7.7 | 2.5 | 1.2 | 3.5 | 4.9 |
NOTES: 81 responses. In Feb. 2023, the question asked about 2023 versus 2022.
| April '25 (percent) |
Aug. '25 (percent) |
|
| Much easier | 1.3 | 1.3 |
| Somewhat easier | 22.5 | 16.5 |
| No change | 38.8 | 46.8 |
| Somewhat harder | 22.5 | 27.8 |
| Much harder | 15.0 | 7.6 |
NOTE: 81 responses.
| Aug. '25 (percent) |
|
| Yes, positive impact | 3.7 |
| Yes, negative impact | 71.6 |
| No | 17.3 |
| Don't know | 7.4 |
NOTES: 81 responses. We asked a similar question in April 2018, Sept. 2018, June 2019 and Dec. 2019 after tariffs were implemented by the first Trump administration and then most recently in April 2025.
| Significant increase (percent) |
Slight increase (percent) |
No impact (percent) |
Slight decrease (percent) |
Significant decrease (percent) |
|
| Input costs | 32.0 | 45.3 | 21.3 | 1.3 | 0.0 |
| Selling prices | 13.3 | 34.7 | 48.0 | 2.7 | 1.3 |
| Profit margins | 1.3 | 1.3 | 44.0 | 37.3 | 16.0 |
| Supplier delivery times | 0.0 | 16.0 | 73.3 | 9.3 | 1.3 |
| Production | 1.4 | 8.1 | 75.7 | 9.5 | 5.4 |
| Employment | 0.0 | 0.0 | 89.3 | 9.3 | 1.3 |
| Capital spending plans | 1.4 | 10.8 | 60.8 | 14.9 | 12.2 |
| Company outlook | 1.4 | 10.8 | 54.1 | 23.0 | 10.8 |
NOTES: 61 responses. This question was only posed to those answering yes to question 3, but the results shown are calculated as the share of all firms, where those answering no to question 3 are included under “No impact.” We asked a similar question in April 2018, Sept. 2018 and June 2019 after tariffs were implemented by the first Trump administration and then most recently in April 2025.
| Already taken (percent) |
Plan to take (percent) |
Not taking/not applicable (percent) |
|
| Passing cost increases through to customers | 63.6 | 30.9 | 9.1 |
| Absorbing cost increases internally | 46.3 | 14.8 | 40.7 |
| Moving up purchases ahead of tariff implementation | 44.4 | 16.7 | 40.7 |
| Finding new domestic supplier(s) | 29.1 | 25.5 | 47.3 |
| Finding new foreign supplier(s) | 27.8 | 20.4 | 53.7 |
| Relocating production or services to the U.S. | 12.7 | 7.3 | 80.0 |
| Scaling down operations or closing our business | 7.4 | 9.3 | 83.3 |
| Other | 0.0 | 0.0 | 100.0 |
NOTES: 57 responses. This question was only posed to those answering “Yes, negative impact” to question 3. We asked a similar question in June 2019 after tariffs were implemented by the first Trump administration and then most recently in April 2025.
| Aug. '25 (percent) |
|
| All | 23.5 |
| Most | 38.2 |
| Some | 38.2 |
NOTES: 34 responses. This question was only posed to those answering “Passing cost increases through to customers” to question 3b. We asked a similar question in April 2025.
| Apr. '25 (percent) |
Aug. '25 (percent) |
|
| Upon tariff proposal/announcement | 31.7 | 16.0 |
| Less than a month after tariff takes effect | 24.4 | 36.0 |
| 1-3 months after tariff takes effect | 22.0 | 32.0 |
| 4-6 months after tariff takes effect | 4.9 | 6.0 |
| 7-12 months after tariff takes effect | 7.3 | 4.0 |
| Don't know | 9.8 | 6.0 |
NOTES: 50 responses. This question was only posed to those answering “Passing cost increases through to customers” as an action taken/planned in question 3b.
| Aug. '25 (percent) |
|
| Yes, a positive impact | 7.1 |
| Yes, a negative impact | 7.1 |
| No | 78.6 |
| Don’t know | 7.1 |
NOTES: 14 responses. This question was only posed to those answering “No” to question 3. We asked a similar question in April 2018, Sept. 2018, June 2019 and Dec. 2019 after tariffs were implemented by the first Trump administration and then most recently in April 2025.
Survey respondents were given the opportunity to also provide comments, which can be found in the Comments tab above.
Texas Business Outlook Surveys
Data were collected August 12-20, and 250 Texas business executives responded to the survey.
| Feb. '23 (percent) |
Nov. '23 (percent) |
Feb. '24 (percent) |
Aug. '24 (percent) |
Nov. '24 (percent) |
Feb. '25 (percent) |
Aug. '25 (percent) |
|
| Increase substantially | 7.0 | 3.6 | 4.5 | 3.5 | 7.9 | 7.2 | 4.5 |
| Increase slightly | 36.2 | 34.3 | 47.4 | 41.2 | 47.4 | 50.0 | 37.2 |
| Remain the same | 31.2 | 34.7 | 29.3 | 33.3 | 32.0 | 29.2 | 37.2 |
| Decrease slightly | 21.6 | 23.0 | 16.9 | 19.2 | 9.9 | 11.0 | 16.6 |
| Decrease substantially | 4.0 | 4.4 | 1.9 | 2.7 | 2.8 | 2.5 | 4.5 |
NOTES: 247 responses. In Feb. 2023, the question asked about 2023 versus 2022.
| April '25 (percent) |
Aug. '25 (percent) |
|
| Much easier | 0.4 | 0.4 |
| Somewhat easier | 9.8 | 12.5 |
| No change | 51.2 | 54.7 |
| Somewhat harder | 24.0 | 21.6 |
| Much harder | 14.6 | 10.8 |
NOTE: 248 responses.
| Aug. '25 (percent) |
|
| Yes, positive impact | 1.6 |
| Yes, negative impact | 39.9 |
| No | 44.8 |
| Don't know | 13.7 |
NOTES: 248 responses. We asked a similar question in April 2018, Sept. 2018, June 2019 and Dec. 2019 after tariffs were implemented by the first Trump administration and then most recently in April 2025.
| Significant increase (percent) |
Slight increase (percent) |
No impact (percent) |
Slight decrease (percent) |
Significant decrease (percent) |
|
| Input costs | 10.6 | 27.4 | 61.1 | 0.5 | 0.5 |
| Selling prices | 4.3 | 14.8 | 74.2 | 3.8 | 2.9 |
| Profit margins | 0.0 | 4.3 | 61.9 | 26.7 | 7.1 |
| Supplier delivery times | 1.9 | 11.5 | 73.7 | 8.6 | 4.3 |
| Production | 1.4 | 2.4 | 72.4 | 18.1 | 5.7 |
| Employment | 0.0 | 1.4 | 88.0 | 7.7 | 2.9 |
| Capital spending plans | 0.5 | 5.3 | 74.5 | 13.0 | 6.7 |
| Company outlook | 0.5 | 1.4 | 64.6 | 24.9 | 8.6 |
NOTES: 99 responses. This question was only posed to those answering yes to question 3, but the results shown are calculated as the share of all firms, where those answering no to question 3 are included under “No impact.” We asked a similar question in April 2018, Sept. 2018 and June 2019 after tariffs were implemented by the first Trump administration and then most recently in April 2025.
| Already taken (percent) |
Plan to take (percent) |
Not taking/not applicable (percent) |
|
| Passing cost increases through to customers | 38.4 | 32.6 | 31.4 |
| Absorbing cost increases internally | 34.1 | 27.1 | 40.0 |
| Moving up purchases ahead of tariff implementation | 32.1 | 8.3 | 60.7 |
| Finding new domestic supplier(s) | 20.2 | 22.6 | 58.3 |
| Finding new foreign supplier(s) | 9.5 | 11.9 | 78.6 |
| Scaling down operations or closing our business | 6.9 | 12.6 | 80.5 |
| Relocating production or services to the U.S. | 5.9 | 2.4 | 91.8 |
| Other | 4.8 | 9.5 | 85.7 |
NOTES: 97 responses. This question was only posed to those answering “Yes, negative impact” to question 3. We asked a similar question in June 2019 after tariffs were implemented by the first Trump administration and then most recently in April 2025.
| Aug. '25 (percent) |
|
| All | 18.2 |
| Most | 33.3 |
| Some | 48.5 |
NOTES: 33 responses. This question was only posed to those answering “Passing cost increases through to customers” to question 3b. We asked a similar question in April 2025.
| Apr. '25 (percent) |
Aug. '25 (percent) |
|
| Upon tariff proposal/announcement | 17.1 | 15.3 |
| Less than a month after tariff takes effect | 31.4 | 28.8 |
| 1-3 months after tariff takes effect | 28.6 | 25.4 |
| 4-6 months after tariff takes effect | 5.7 | 8.5 |
| 7-12 months after tariff takes effect | 1.4 | 3.4 |
| Don't know | 15.7 | 18.6 |
NOTES: 59 responses. This question was only posed to those answering “Passing cost increases through to customers” as an action taken/planned in question 3b.
| Aug. '25 (percent) |
|
| Yes, a positive impact | 0.9 |
| Yes, a negative impact | 20.0 |
| No | 63.6 |
| Don’t know | 15.5 |
NOTES: 110 responses. This question was only posed to those answering “No” to question 3. We asked a similar question in April 2018, Sept. 2018, June 2019 and Dec. 2019 after tariffs were implemented by the first Trump administration and then most recently in April 2025.
Survey respondents were given the opportunity to also provide comments, which can be found in the Comments tab above.
Texas Business Outlook Surveys
Data were collected August 12-20, and 43 Texas business executives responded to the survey.
| Feb. '23 (percent) |
Nov. '23 (percent) |
Feb. '24 (percent) |
Aug. '24 (percent) |
Nov. '24 (percent) |
Feb. '25 (percent) |
Aug. '25 (percent) |
|
| Increase substantially | 4.4 | 3.5 | 1.8 | 2.1 | 6.1 | 2.4 | 4.8 |
| Increase slightly | 23.5 | 31.6 | 36.4 | 29.2 | 40.8 | 54.8 | 33.3 |
| Remain the same | 39.7 | 33.3 | 30.9 | 39.6 | 30.6 | 26.2 | 38.1 |
| Decrease slightly | 29.4 | 28.1 | 30.9 | 25.0 | 18.4 | 16.7 | 19.0 |
| Decrease substantially | 2.9 | 3.5 | 0.0 | 4.2 | 4.1 | 0.0 | 4.8 |
NOTES: 42 responses. In Feb. 2023, the question asked about 2023 versus 2022.
| April '25 (percent) |
Aug. '25 (percent) |
|
| Much easier | 0.0 | 0.0 |
| Somewhat easier | 19.6 | 14.0 |
| No change | 39.1 | 53.5 |
| Somewhat harder | 28.3 | 25.6 |
| Much harder | 13.0 | 7.0 |
NOTE: 43 responses.
| Aug. '25 (percent) |
|
| Yes, positive impact | 2.3 |
| Yes, negative impact | 60.5 |
| No | 23.3 |
| Don't know | 14.0 |
NOTES: 43 responses. We asked a similar question in April 2018, Sept. 2018, June 2019 and Dec. 2019 after tariffs were implemented by the first Trump administration and then most recently in April 2025.
| Significant increase (percent) |
Slight increase (percent) |
No impact (percent) |
Slight decrease (percent) |
Significant decrease (percent) |
|
| Input costs | 24.3 | 40.5 | 29.7 | 2.7 | 2.7 |
| Selling prices | 18.9 | 37.8 | 35.1 | 5.4 | 2.7 |
| Profit margins | 0.0 | 13.5 | 35.1 | 45.9 | 5.4 |
| Supplier delivery times | 2.7 | 10.8 | 67.6 | 13.5 | 5.4 |
| Production | 0.0 | 5.4 | 51.4 | 35.1 | 8.1 |
| Employment | 0.0 | 2.7 | 86.5 | 8.1 | 2.7 |
| Capital spending plans | 0.0 | 5.4 | 67.6 | 13.5 | 13.5 |
| Company outlook | 0.0 | 2.7 | 48.6 | 40.5 | 8.1 |
NOTES: 27 responses. This question was only posed to those answering yes to question 3, but the results shown are calculated as the share of all firms, where those answering no to question 3 are included under “No impact.” We asked a similar question in April 2018, Sept. 2018 and June 2019 after tariffs were implemented by the first Trump administration and then most recently in April 2025.
| Already taken (percent) |
Plan to take (percent) |
Not taking/not applicable (percent) |
|
| Passing cost increases through to customers | 54.2 | 41.7 | 8.3 |
| Absorbing cost increases internally | 47.8 | 8.7 | 43.5 |
| Moving up purchases ahead of tariff implementation | 31.8 | 27.3 | 40.9 |
| Finding new domestic supplier(s) | 30.4 | 17.4 | 52.2 |
| Finding new foreign supplier(s) | 13.6 | 4.5 | 81.8 |
| Relocating production or services to the U.S. | 4.3 | 4.3 | 91.3 |
| Scaling down operations or closing our business | 0.0 | 17.4 | 82.6 |
| Other | 0.0 | 50.0 | 50.0 |
NOTES: 26 responses. This question was only posed to those answering “Yes, negative impact” to question 3. We asked a similar question in June 2019 after tariffs were implemented by the first Trump administration and then most recently in April 2025.
| Aug. '25 (percent) |
|
| All | 15.4 |
| Most | 38.5 |
| Some | 46.2 |
NOTES: 13 responses. This question was only posed to those answering “Passing cost increases through to customers” to question 3b. We asked a similar question in April 2025.
| Apr. '25 (percent) |
Aug. '25 (percent) |
|
| Upon tariff proposal/announcement | 12.0 | 22.7 |
| Less than a month after tariff takes effect | 40.0 | 36.4 |
| 1-3 months after tariff takes effect | 40.0 | 13.6 |
| 4-6 months after tariff takes effect | 4.0 | 4.5 |
| 7-12 months after tariff takes effect | 0.0 | 0.0 |
| Don't know | 4.0 | 22.7 |
NOTES: 22 responses. This question was only posed to those answering “Passing cost increases through to customers” as an action taken/planned in question 3b.
| Aug. '25 (percent) |
|
| Yes, a positive impact | 0.0 |
| Yes, a negative impact | 30.0 |
| No | 70.0 |
| Don’t know | 0.0 |
NOTES: 10 responses. This question was only posed to those answering “No” to question 3. We asked a similar question in April 2018, Sept. 2018, June 2019 and Dec. 2019 after tariffs were implemented by the first Trump administration and then most recently in April 2025.
Survey respondents were given the opportunity to also provide comments, which can be found in the Comments tab above.
Questions regarding the Texas Business Outlook Surveys can be addressed to Jesus Cañas at jesus.canas@dal.frb.org.
Sign up for our email alert to be automatically notified as soon as the latest surveys are released on the web.
Special Questions Comments
Survey participants are given the opportunity to submit comments. Some comments have been edited for grammar and clarity.