Special Questions

Special Questions
For this month’s survey, Texas business executives were asked supplemental questions on wages, prices, outlook concerns, tax reform and remote work. Results below include responses from participants of all three surveys: Texas Manufacturing Outlook Survey, Texas Service Sector Outlook Survey and Texas Retail Outlook Survey.
Texas Business Outlook Surveys
Data were collected September 16–24, and 323 Texas business executives responded to the surveys.
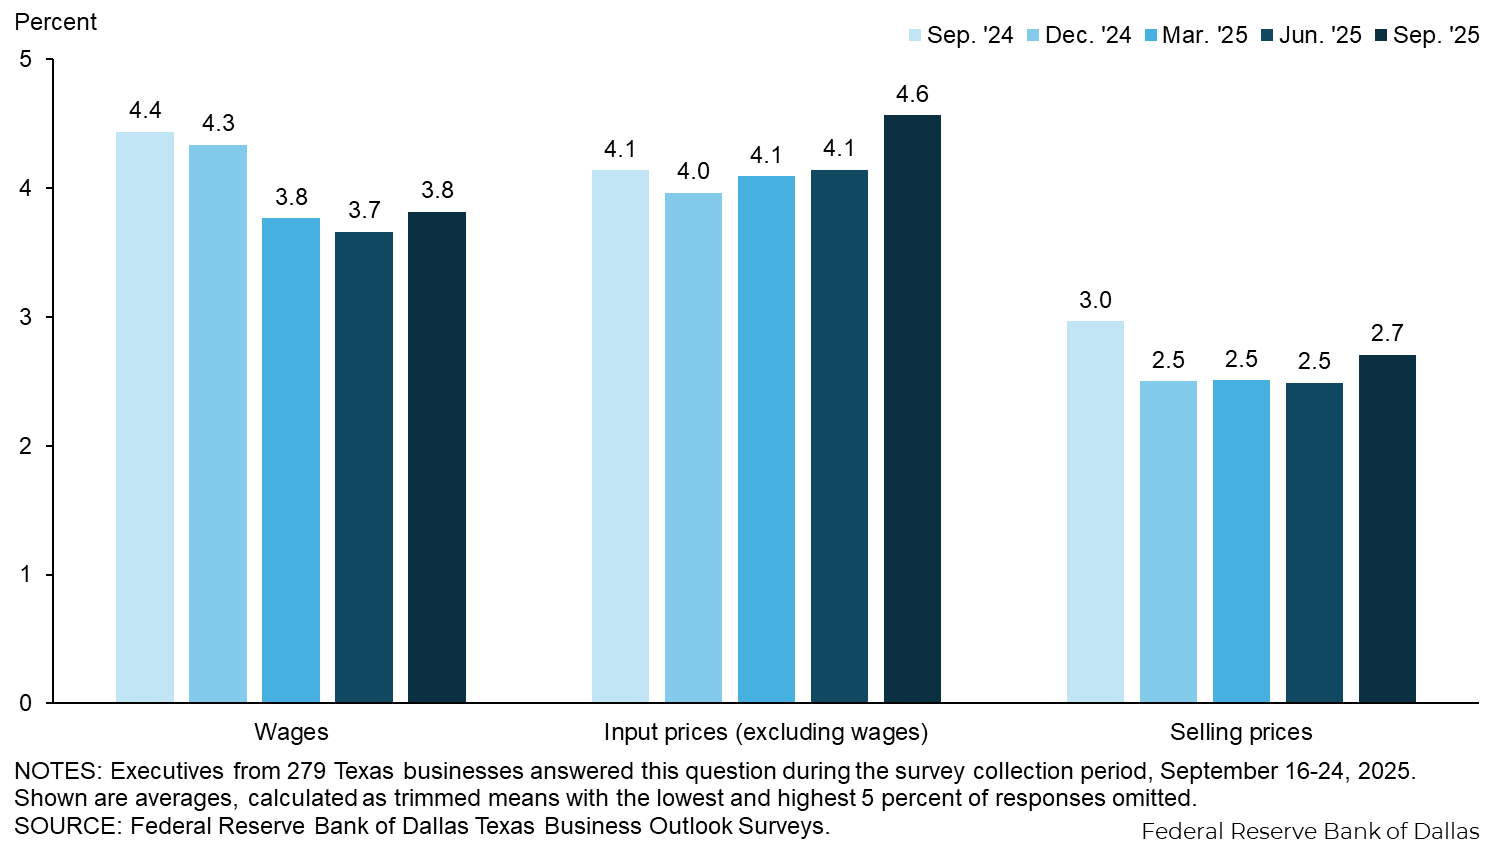
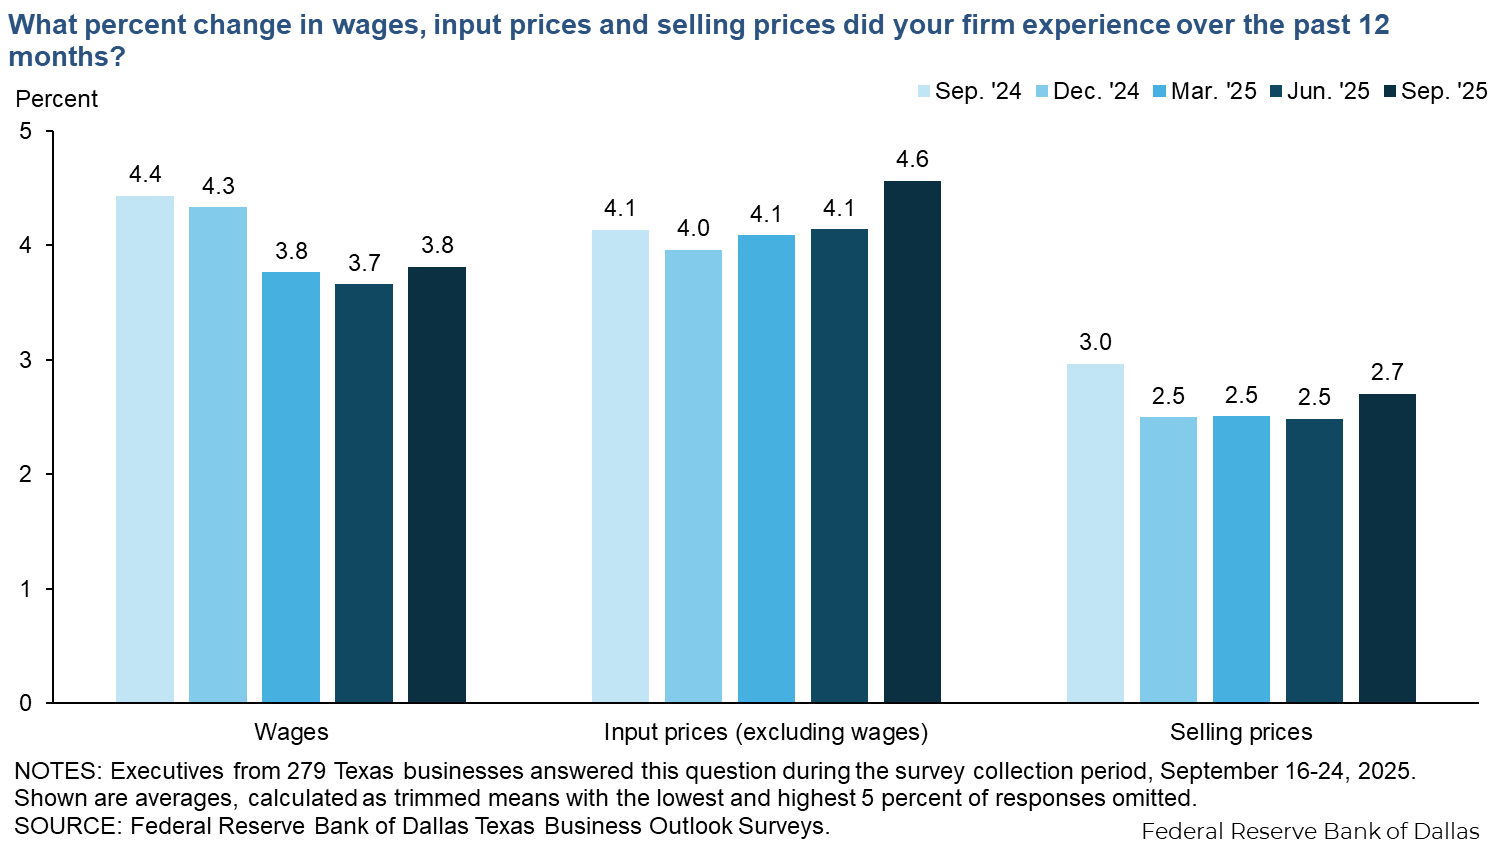
Wage and price growth has accelerated somewhat, particularly for inputs. Texas firms surveyed report wage growth of 3.8 percent over the past 12 months, on average, 4.6 percent growth in input prices and 2.7 percent growth in selling prices. Price growth picked up pace from June in both the manufacturing and service sectors.
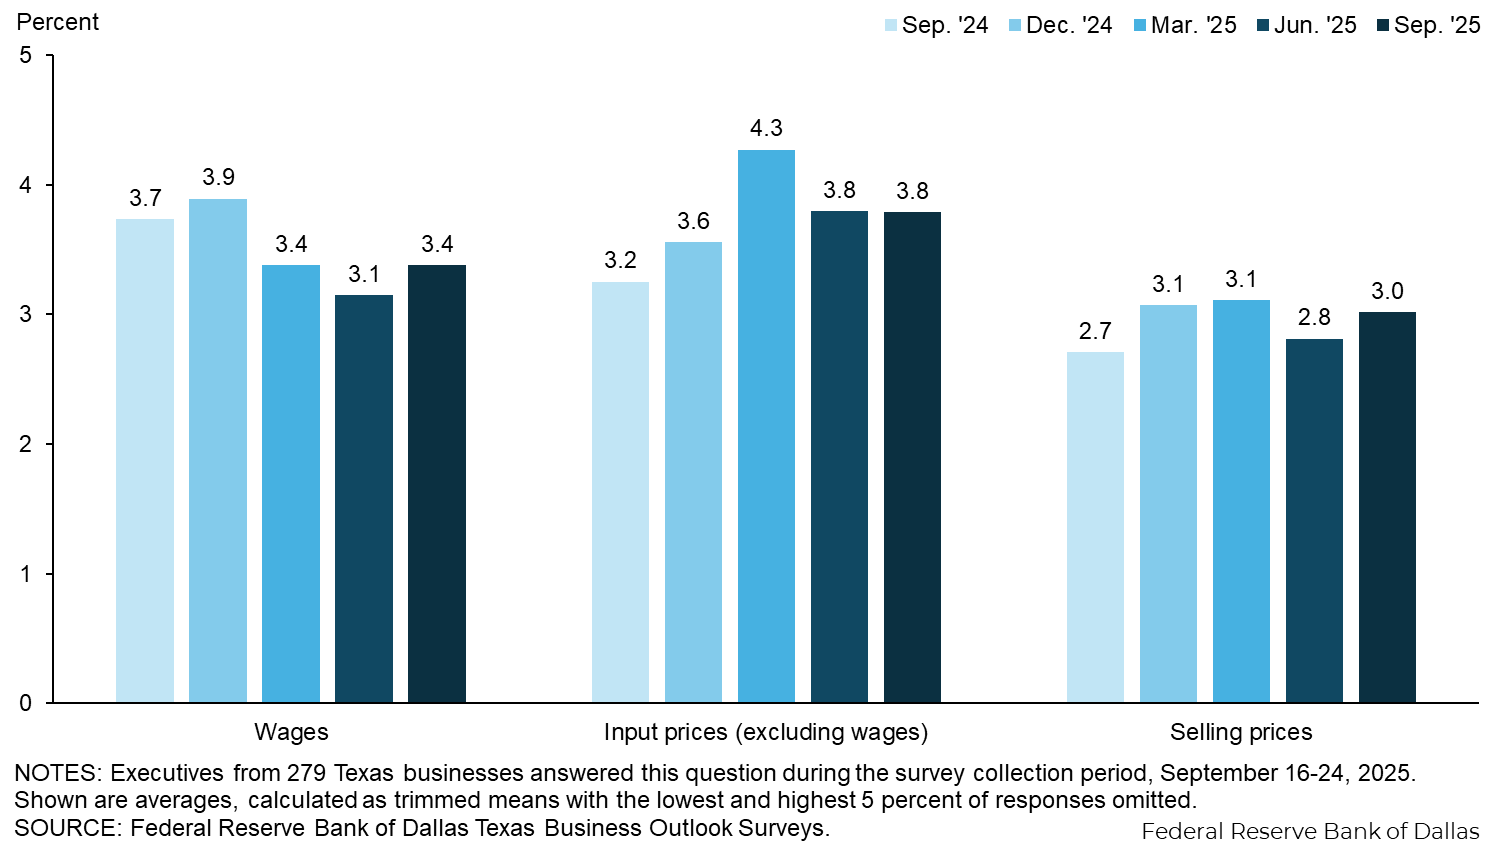
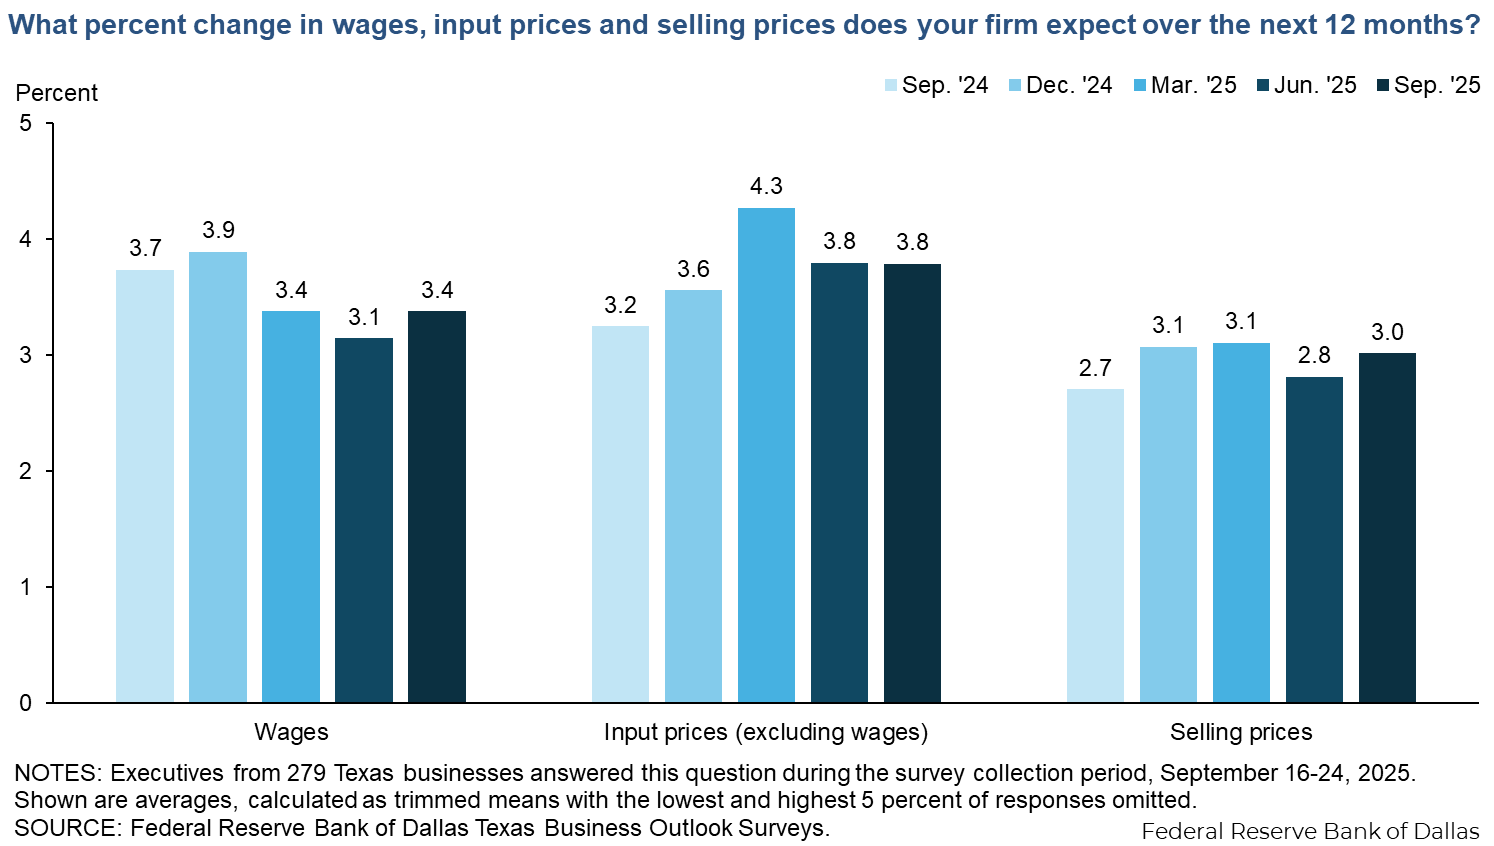
Wage and selling price growth expectations picked up in September, while expectations for input price growth held steady. Texas firms surveyed expect wages to increase 3.4 percent over the next 12 months, on average. They expect input prices to increase 3.8 percent and selling prices to increase 3.0 percent.
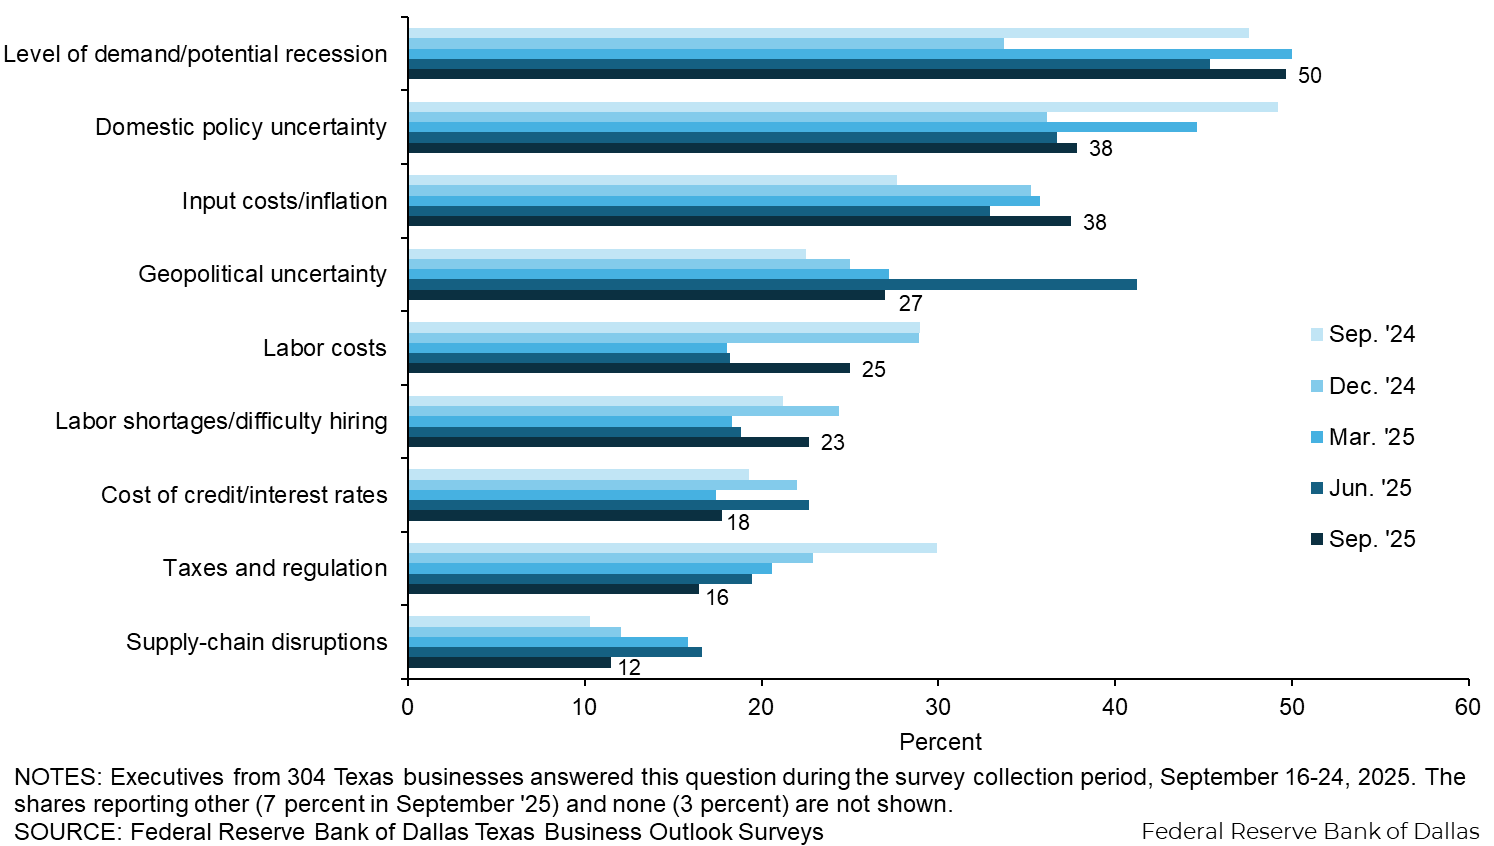
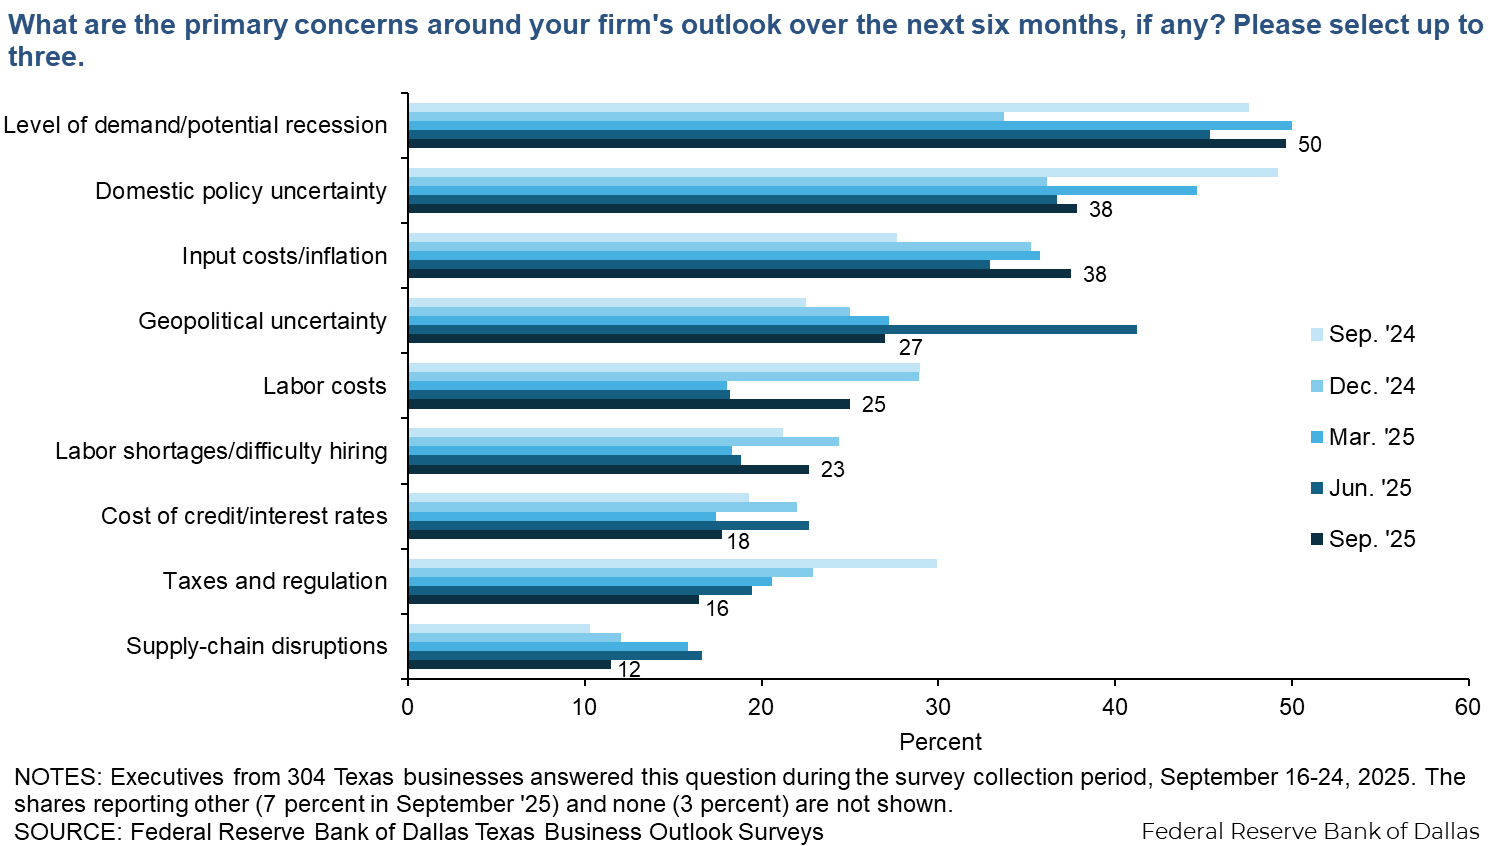
Demand remains the top outlook concern among Texas firms surveyed. The shares of firms citing domestic policy uncertainty and inflation rose in September, while geopolitical uncertainty retreated to the No. 4 spot.
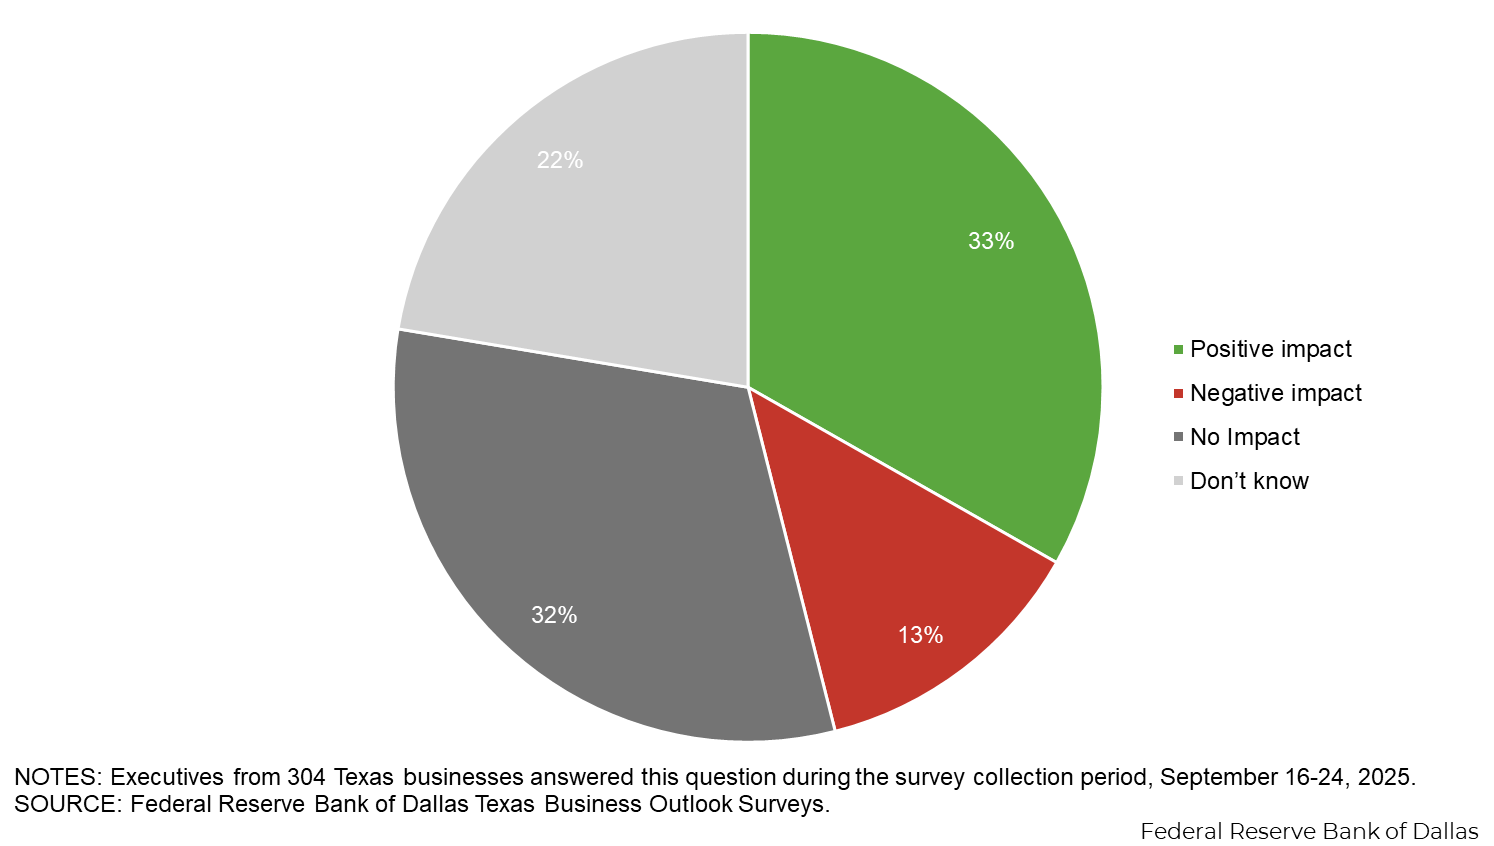
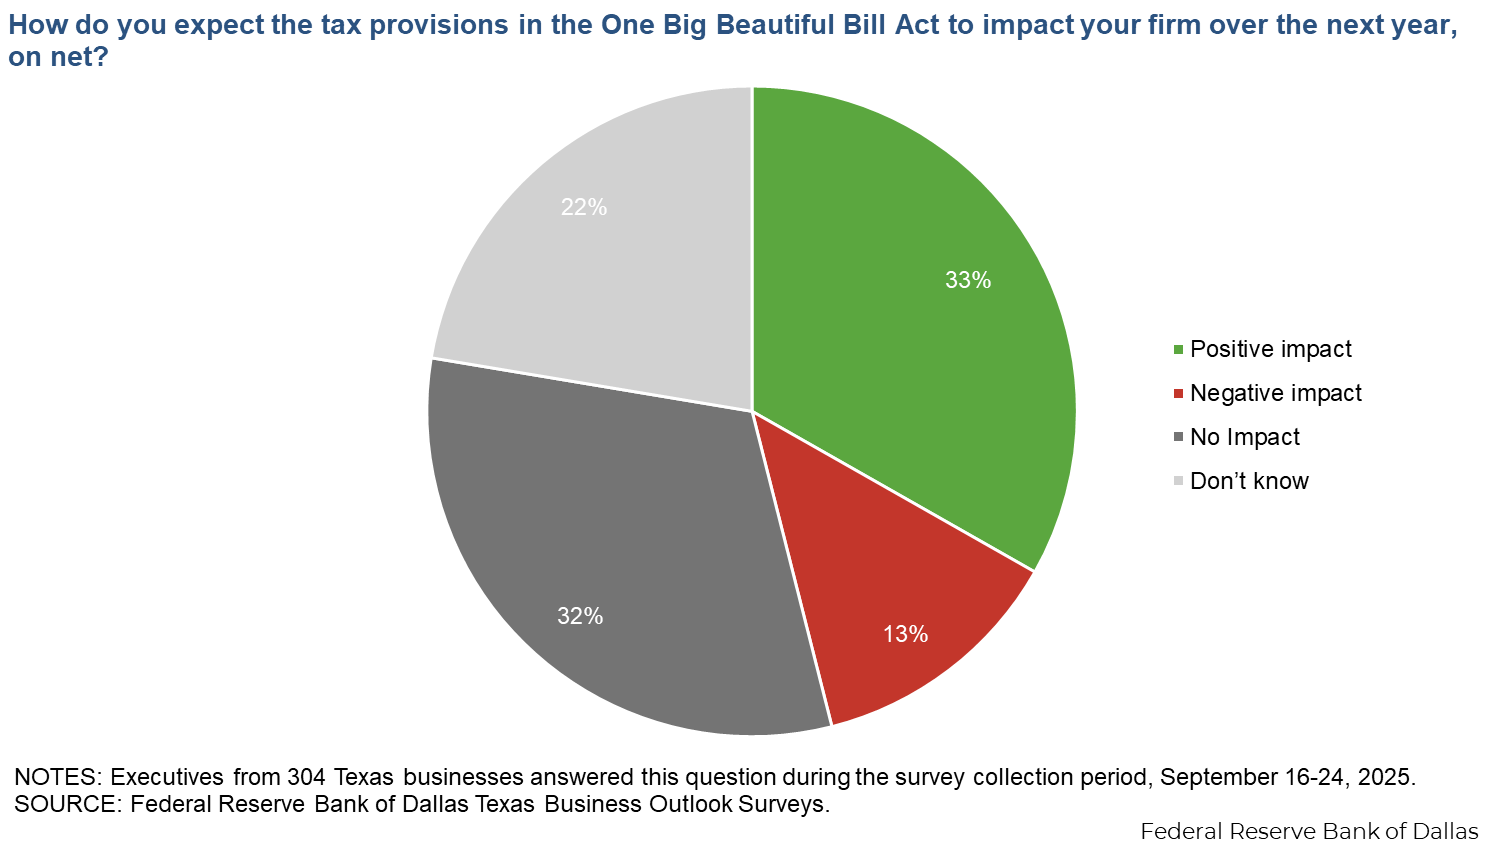
A third of responding Texas businesses say they expect the tax provisions in the OBBBA to have a positive impact on their firm. Thirteen percent expect a negative impact, and the remainder don’t expect an impact or aren’t sure.
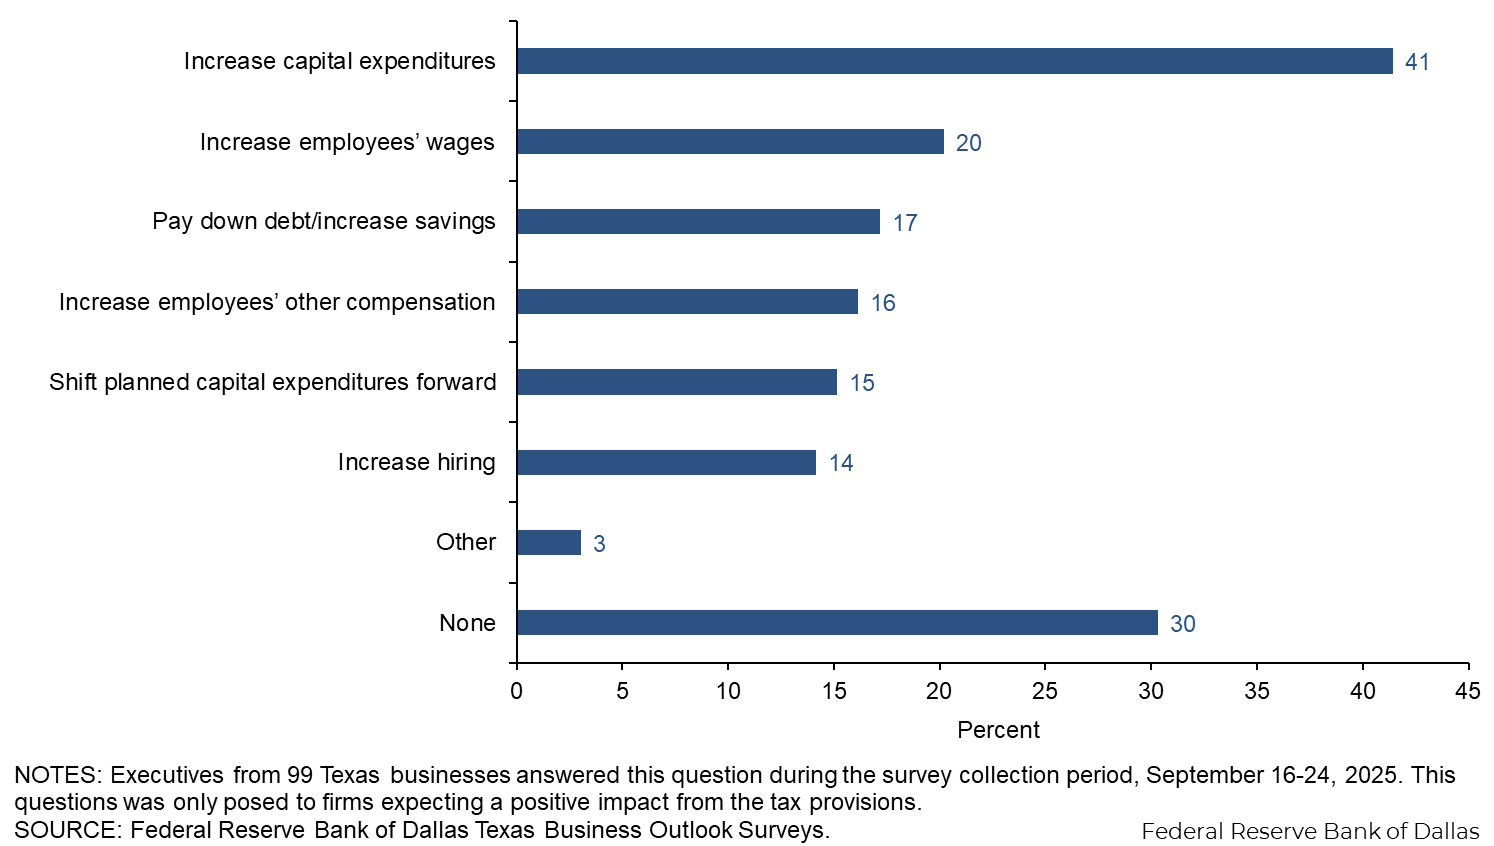
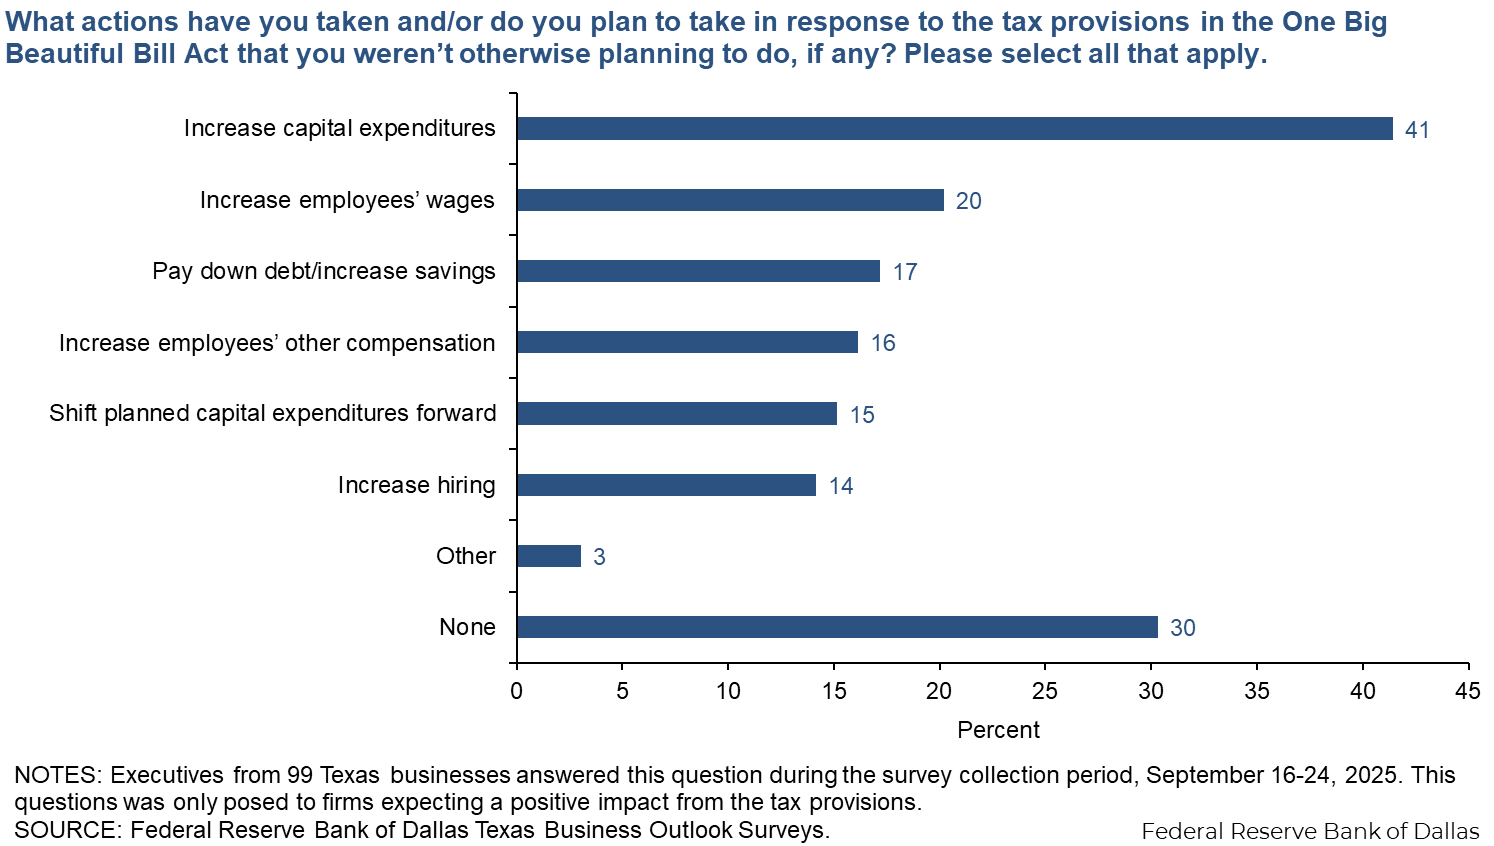
Among those positively impacted by OBBBA, the No. 1 action taken or planned in response is an increase in capital expenditures, followed by an increase in wages.
The share of employees working remotely at responding Texas businesses has remained fairly stable over the past couple of years, after peaking in 2022 then retreating somewhat in 2023. Slightly more than 30 percent of employees on average work at least partially remote across Texas firms, with a fairly even split between fully remote versus hybrid work arrangements. The share is much smaller among manufacturers and retailers.
| Feb. '20 (percent) |
Aug. '20 (percent) |
Feb. '21 (percent) |
Apr. '22 (percent) |
Sep. '23 (percent) |
Sep. '24 (percent) |
Sep. '25 (percent) |
|
| Combined fully remote and hybrid | 8.3 | 35.0 | 35.2 | 39.3 | 32.1 | 30.3 | 31.7 |
| Fully remote | 15.6 | 14.4 | 13.2 | 15.1 | |||
| Hybrid | 23.6 | 17.7 | 17.1 | 16.6 |
NOTES: 275 responses. Shown are averages, calculated as the means of received responses. Prior to April 2022, respondents were not asked to break out fully remote versus hybrid, and responses could be lower as a result if respondents had in mind only workers working mostly remotely. Responses for February 2020 are from an August 2020 question asking, "What share of your employees were working remotely in February (pre-COVID-19)?"
The vast majority of Texas businesses surveyed say the shares of employees working remotely has not changed over the past year. Fourteen percent report decreases, exceeding the 6 percent share reporting increases
| Sep. '24 (percent) |
Sep. '25 (percent) |
|
| Increased | 10.6 | 6.1 |
| No change | 76.5 | 80.1 |
| Decreased | 12.9 | 13.8 |
NOTE: 297 responses.
| Sep. '25 (percent) |
|
| Yes, it has made hiring and retention more difficult | 7.1 |
| Yes, it has made hiring and retention easier | 35.7 |
| No | 57.1 |
NOTES: 14 responses. This question was only posed to firms who noted increases in remote work.
| Sep. '25 (percent) |
|
| Yes, it has made hiring and retention more difficult | 34.2 |
| Yes, it has made hiring and retention easier | 5.3 |
| No | 60.5 |
NOTES: 38 responses. This question was only posed to firms who noted decreases in remote work.
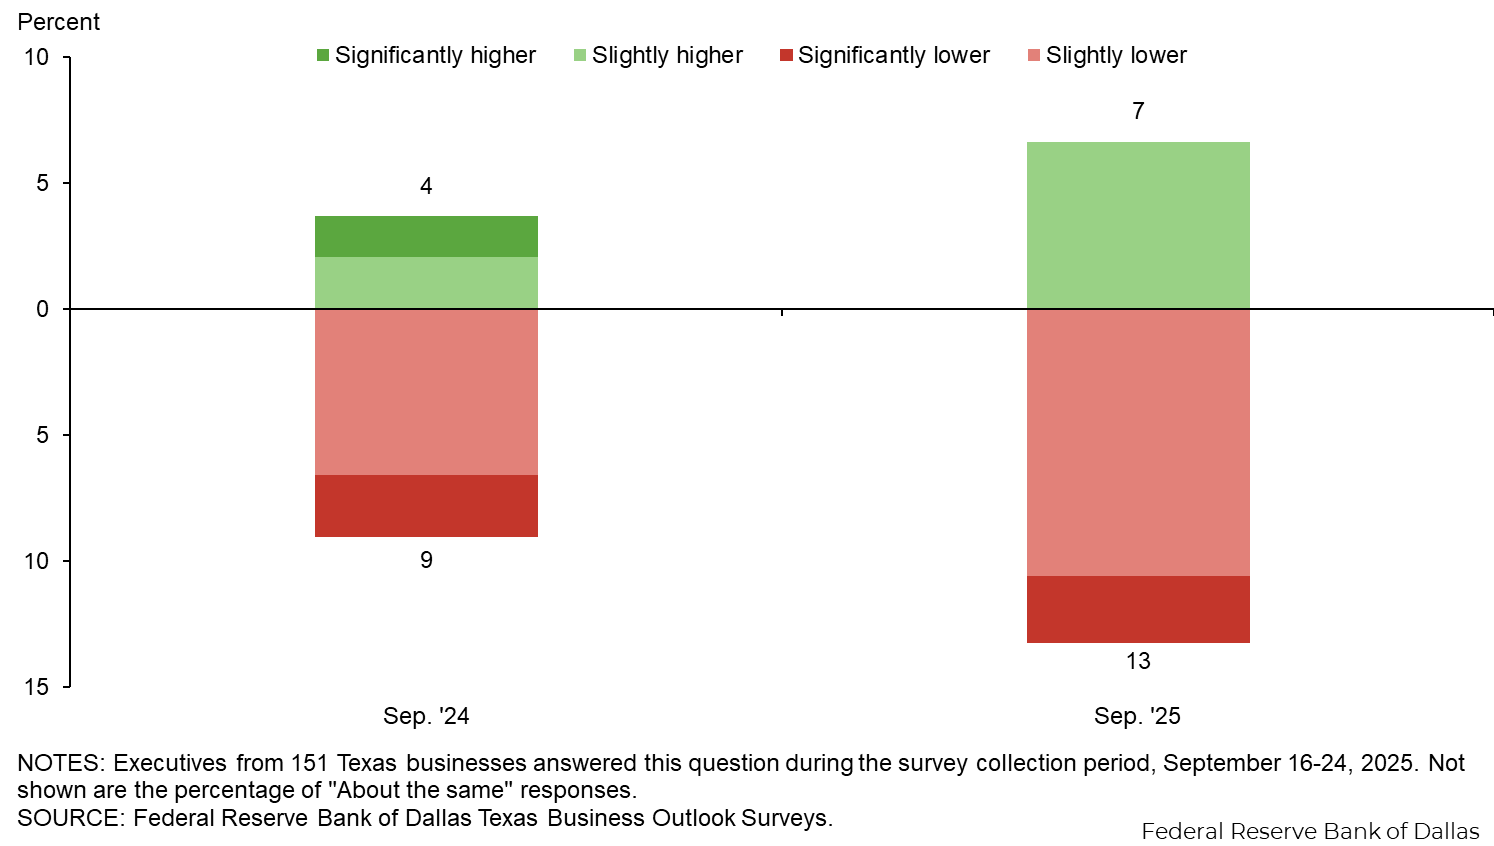
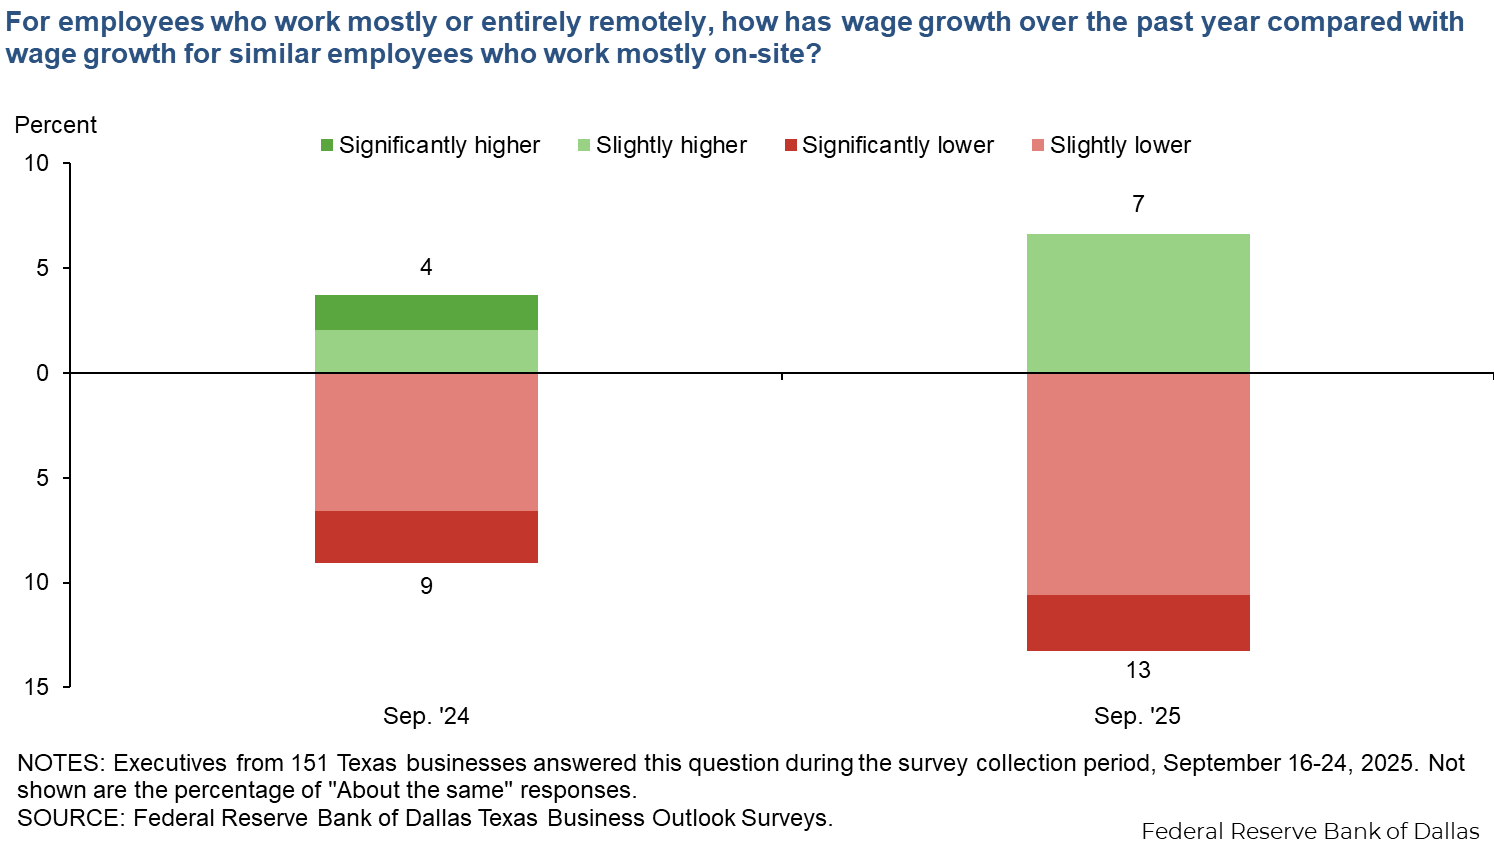
Most responding Texas businesses say wage growth over the past year has been about the same for employees who work remotely as it was for those who work mostly on-site. Thirteen percent report lower wage growth among remote workers, exceeding the 7 percent share reporting higher wage growth.
Survey respondents were given the opportunity to also provide comments, which can be found in the Comments tab above.
Texas Business Outlook Surveys
Data were collected September 16-24, and 68 Texas manufacturers responded to the survey.
| Dec. '24 | Mar. '25 | Jun. '25 | Sep. '25 | |||||
| Past 12 months (percent) |
Next 12 months (percent) |
Past 12 months (percent) |
Next 12 months (percent) |
Past 12 months (percent) |
Next 12 months (percent) |
Past 12 months (percent) |
Next 12 months (percent) |
|
| Wages | 4.0 | 3.4 | 3.6 | 3.2 | 3.3 | 3.1 | 3.8 | 3.2 |
| Input prices (excluding wages) | 3.8 | 3.7 | 4.5 | 4.9 | 5.5 | 4.5 | 5.8 | 4.2 |
| Selling prices | 2.0 | 3.3 | 2.0 | 3.8 | 3.0 | 3.7 | 3.8 | 3.8 |
NOTES: 64 responses. Shown are averages, calculated as trimmed means with the lowest and highest 5 percent of responses omitted.
| Jun. '24 (percent) |
Sep. '24 (percent) |
Dec. '24 (percent) |
Mar. '25 (percent) |
Jun. '25 (percent) |
Sep. '25 (percent) |
|
| Level of demand/potential recession | 52.4 | 63.2 | 37.5 | 50.0 | 47.9 | 50.0 |
| Input costs/inflation | 30.5 | 28.9 | 37.5 | 43.8 | 45.2 | 45.5 |
| Domestic policy uncertainty | 41.5 | 56.6 | 45.0 | 40.0 | 27.4 | 40.9 |
| Geopolitical uncertainty | 23.2 | 27.6 | 35.0 | 30.0 | 43.8 | 31.8 |
| Labor costs | 26.8 | 26.3 | 25.0 | 15.0 | 13.7 | 27.3 |
| Labor shortages/difficulty hiring | 25.6 | 14.5 | 22.5 | 18.8 | 17.8 | 22.7 |
| Supply-chain disruptions | 13.4 | 19.7 | 20.0 | 17.5 | 30.1 | 19.7 |
| Taxes and regulation | 30.5 | 31.6 | 16.3 | 23.8 | 23.3 | 12.1 |
| Cost of credit/interest rates | 19.5 | 13.2 | 13.8 | 10.0 | 13.7 | 10.6 |
| Other | 2.4 | 1.3 | 8.8 | 15.0 | 11.0 | 7.6 |
| None | 2.4 | 0.0 | 2.5 | 2.5 | 0.0 | 1.5 |
NOTE: 66 responses.
| Sep. '25 (percent) |
|
| Positive impact | 40.9 |
| No impact | 34.8 |
| Negative impact | 7.6 |
| Don’t know | 16.7 |
NOTE: 66 responses.
| Sep. '25 (percent) |
|
| Increase capital expenditures | 55.6 |
| Shift planned capital expenditures forward | 22.2 |
| Increase employees’ other compensation (e.g. bonuses, benefits, stock) | 18.5 |
| Increase employees’ wages | 14.8 |
| Pay down debt/increase savings | 14.8 |
| Increase hiring | 7.4 |
| Other | 7.4 |
| None | 14.8 |
NOTES: 27 responses. This questions was only posed to firms expecting a positive impact from the tax provisions.
| Feb. '20 (percent) |
Aug. '20 (percent) |
Feb. '21 (percent) |
Apr. '22 (percent) |
Sep. '23 (percent) |
Sep. '24 (percent) |
Sep. '25 (percent) |
|
| Combined fully remote and hybrid | 4.9 | 20.4 | 17.2 | 17.3 | 9.9 | 14.2 | 10.2 |
| Fully remote | 5.4 | 4.0 | 8.5 | 5.2 | |||
| Hybrid | 12.0 | 5.9 | 5.7 | 5.0 |
NOTES: 63 responses. Shown are averages, calculated as the mean of received responses. Prior to Apr. '22 respondents were not asked to break out fully remote versus hybrid, and responses could be lower as a result if respondents had in mind only workers working mostly remotely. Responses for Feb. '20 are from an Aug. '20 question asking, "What share of your employees were working remotely in February (pre-COVID-19)?"
| Sep. '24 (percent) |
Sep. '25 (percent) |
|
| Increased | 13.2 | 6.2 |
| No change | 75.0 | 87.7 |
| Decreased | 11.8 | 6.2 |
NOTE: 65 responses.
| Sep. '24 (percent) |
Sep. '25 (percent) |
|
| Significantly higher | 0.0 | 0.0 |
| Slightly higher | 1.8 | 6.5 |
| About the same | 83.9 | 80.6 |
| Slightly lower | 10.7 | 9.7 |
| Significantly lower | 3.6 | 3.2 |
NOTE: 31 responses.
Survey respondents were given the opportunity to also provide comments, which can be found in the Comments tab above.
Texas Business Outlook Surveys
Data were collected September 16-24, and 255 Texas business executives responded to the survey.
| Dec. '24 | Mar. '25 | Jun. '25 | Sep. '25 | |||||
| Past 12 months (percent) |
Next 12 months (percent) |
Past 12 months (percent) |
Next 12 months (percent) |
Past 12 months (percent) |
Next 12 months (percent) |
Past 12 months (percent) |
Next 12 months (percent) |
|
| Wages | 4.5 | 4.1 | 3.8 | 3.5 | 3.8 | 3.2 | 3.8 | 3.4 |
| Input prices (excluding wages) | 4.0 | 3.5 | 4.0 | 4.1 | 3.8 | 3.6 | 4.2 | 3.7 |
| Selling prices | 2.6 | 3.0 | 2.7 | 2.9 | 2.3 | 2.5 | 2.4 | 2.8 |
NOTES: 215 responses. Shown are averages, calculated as trimmed means with the lowest and highest 5 percent of responses omitted.
| Jun. '24 (percent) |
Sep. '24 (percent) |
Dec. '24 (percent) |
Mar. '25 (percent) |
Jun. '25 (percent) |
Sep. '25 (percent) |
|
| Level of demand/potential recession | 42.5 | 42.6 | 32.5 | 50.0 | 44.6 | 49.6 |
| Domestic policy uncertainty | 36.5 | 46.8 | 33.3 | 46.2 | 39.6 | 37.0 |
| Input costs/inflation | 35.7 | 27.2 | 34.5 | 33.1 | 29.2 | 35.3 |
| Geopolitical uncertainty | 18.7 | 20.9 | 21.8 | 26.3 | 40.4 | 25.6 |
| Labor costs | 35.3 | 29.8 | 30.2 | 19.1 | 19.6 | 24.4 |
| Labor shortages/difficulty hiring | 22.6 | 23.4 | 25.0 | 18.2 | 19.2 | 22.7 |
| Cost of credit/interest rates | 28.6 | 21.3 | 24.6 | 19.9 | 25.4 | 19.7 |
| Taxes and regulation | 19.8 | 29.4 | 25.0 | 19.5 | 18.3 | 17.6 |
| Supply-chain disruptions | 6.0 | 7.2 | 9.5 | 15.3 | 12.5 | 9.2 |
| Other | 2.4 | 2.6 | 6.0 | 6.8 | 7.1 | 7.1 |
| None | 4.8 | 3.4 | 2.4 | 1.7 | 1.7 | 3.4 |
NOTE: 238 responses.
| Sep. '25 (percent) |
|
| Positive impact | 31.1 |
| No impact | 30.7 |
| Negative impact | 14.3 |
| Don’t know | 23.9 |
NOTE: 238 responses.
| Sep. '25 (percent) |
|
| Increase capital expenditures | 36.1 |
| Increase employees’ wages | 22.2 |
| Pay down debt/increase savings | 18.1 |
| Increase hiring | 16.7 |
| Increase employees’ other compensation (e.g. bonuses, benefits, stock) | 15.3 |
| Shift planned capital expenditures forward | 12.5 |
| Other | 1.4 |
| None | 36.1 |
NOTES: 72 responses. This questions was only posed to firms expecting a positive impact from the tax provisions.
| Feb. '20 (percent) |
Aug. '20 (percent) |
Feb. '21 (percent) |
Apr. '22 (percent) |
Sep. '23 (percent) |
Sep. '24 (percent) |
Sep. '25 (percent) |
|
| Combined fully remote and hybrid | 9.5 | 40.4 | 42.2 | 47.1 | 39.4 | 35.7 | 38.0 |
| Fully remote | 19.4 | 17.8 | 14.9 | 18.1 | |||
| Hybrid | 27.7 | 21.6 | 20.8 | 19.9 |
NOTES: 212 responses. Shown are averages, calculated as the mean of received responses. Prior to Apr. '22 respondents were not asked to break out fully remote versus hybrid, and responses could be lower as a result if respondents had in mind only workers working mostly remotely. Responses for Feb. '20 are from an Aug. '20 question asking, "What share of your employees were working remotely in February (pre-COVID-19)?"
| Sep. '24 (percent) |
Sep. '25 (percent) |
|
| Increased | 9.8 | 6.0 |
| No change | 77.0 | 78.0 |
| Decreased | 13.2 | 15.9 |
NOTE: 232 responses.
| Sep. '24 (percent) |
Sep. '25 (percent) |
|
| Significantly higher | 2.1 | 0.0 |
| Slightly higher | 2.1 | 6.7 |
| About the same | 88.2 | 80.0 |
| Slightly lower | 5.3 | 10.8 |
| Significantly lower | 2.1 | 2.5 |
NOTE: 120 responses.
Survey respondents were given the opportunity to also provide comments, which can be found in the Comments tab above.
Texas Business Outlook Surveys
Data were collected September 16-24, and 47 Texas business executives responded to the survey.
| Dec. '24 | Mar. '25 | Jun. '25 | Sep. '25 | |||||
| Past 12 months (percent) |
Next 12 months (percent) |
Past 12 months (percent) |
Next 12 months (percent) |
Past 12 months (percent) |
Next 12 months (percent) |
Past 12 months (percent) |
Next 12 months (percent) |
|
| Wages | 4.3 | 2.9 | 3.7 | 3.4 | 3.3 | 2.7 | 4.2 | 3.2 |
| Input prices (excluding wages) | 3.5 | 3.3 | 4.1 | 4.7 | 4.6 | 4.8 | 4.4 | 4.6 |
| Selling prices | 1.3 | 2.6 | 3.1 | 3.9 | 2.9 | 3.7 | 3.3 | 3.7 |
NOTES: 38 responses. Shown are averages, calculated as trimmed means with the lowest and highest 5 percent of responses omitted.
| Jun. '24 (percent) |
Sep. '24 (percent) |
Dec. '24 (percent) |
Mar. '25 (percent) |
Jun. '25 (percent) |
Sep. '25 (percent) |
|
| Level of demand/potential recession | 45.3 | 48.1 | 42.6 | 43.6 | 42.1 | 47.7 |
| Input costs/inflation | 37.7 | 26.9 | 38.3 | 46.2 | 39.5 | 43.2 |
| Geopolitical uncertainty | 15.1 | 19.2 | 25.5 | 23.1 | 55.3 | 34.1 |
| Labor costs | 34.0 | 23.1 | 21.3 | 15.4 | 21.1 | 31.8 |
| Labor shortages/difficulty hiring | 18.9 | 25.0 | 27.7 | 23.1 | 15.8 | 25.0 |
| Domestic policy uncertainty | 28.3 | 42.3 | 31.9 | 33.3 | 34.2 | 25.0 |
| Supply-chain disruptions | 7.5 | 13.5 | 17.0 | 25.6 | 28.9 | 20.5 |
| Taxes and regulation | 11.3 | 26.9 | 14.9 | 17.9 | 7.9 | 20.5 |
| Cost of credit/interest rates | 45.3 | 26.9 | 25.5 | 17.9 | 21.1 | 13.6 |
| Other | 1.9 | 0.0 | 6.4 | 5.1 | 10.5 | 4.5 |
| None | 3.8 | 3.8 | 2.1 | 2.6 | 0.0 | 2.3 |
NOTE: 44 responses.
| Sep. '25 (percent) |
|
| Positive impact | 36.4 |
| No impact | 31.8 |
| Negative impact | 11.4 |
| Don’t know | 20.5 |
NOTE: 44 responses.
| Sep. '25 (percent) |
|
| Increase capital expenditures | 37.5 |
| Pay down debt/increase savings | 31.3 |
| Increase employees’ other compensation (e.g. bonuses, benefits, stock) | 25.0 |
| Increase employees’ wages | 18.8 |
| Shift planned capital expenditures forward | 12.5 |
| Increase hiring | 12.5 |
| Other | 0.0 |
| None | 31.3 |
NOTES: 16 responses. This questions was only posed to firms expecting a positive impact from the tax provisions.
| Feb. '20 (percent) |
Aug. '20 (percent) |
Feb. '21 (percent) |
Apr. '22 (percent) |
Sep. '23 (percent) |
Sep. '24 (percent) |
Sep. '25 (percent) |
|
| Combined fully remote and hybrid | 6.0 | 21.2 | 28.4 | 28.6 | 21.3 | 14.2 | 16.7 |
| Fully remote | 17.7 | 15.1 | 8.9 | 10.3 | |||
| Hybrid | 10.9 | 6.3 | 5.3 | 6.4 |
NOTES: 42 responses. Shown are averages, calculated as the mean of received responses. Prior to Apr. '22 respondents were not asked to break out fully remote versus hybrid, and responses could be lower as a result if respondents had in mind only workers working mostly remotely. Responses for Feb. '20 are from an Aug. '20 question asking, "What share of your employees were working remotely in February (pre-COVID-19)?"
| Sep. '24 (percent) |
Sep. '25 (percent) |
|
| Increased | 5.8 | 4.5 |
| No change | 86.5 | 86.4 |
| Decreased | 7.7 | 9.1 |
NOTE: 44 responses.
| Sep. '24 (percent) |
Sep. '25 (percent) |
|
| Significantly higher | 0.0 | 0.0 |
| Slightly higher | 0.0 | 0.0 |
| About the same | 91.2 | 93.8 |
| Slightly lower | 5.9 | 6.3 |
| Significantly lower | 2.9 | 0.0 |
NOTE: 16 responses.
Survey respondents were given the opportunity to also provide comments, which can be found in the Comments tab above.
Questions regarding the Texas Business Outlook Surveys can be addressed to Emily Kerr at emily.kerr@dal.frb.org.
Sign up for our email alert to be automatically notified as soon as the latest surveys are released on the web.
Special Questions Comments
Survey participants are given the opportunity to submit comments. Some comments have been edited for grammar and clarity.