Texas Manufacturing Outlook Survey

July 31, 2017
Texas Manufacturing Activity Strengthens, Outlooks Improve
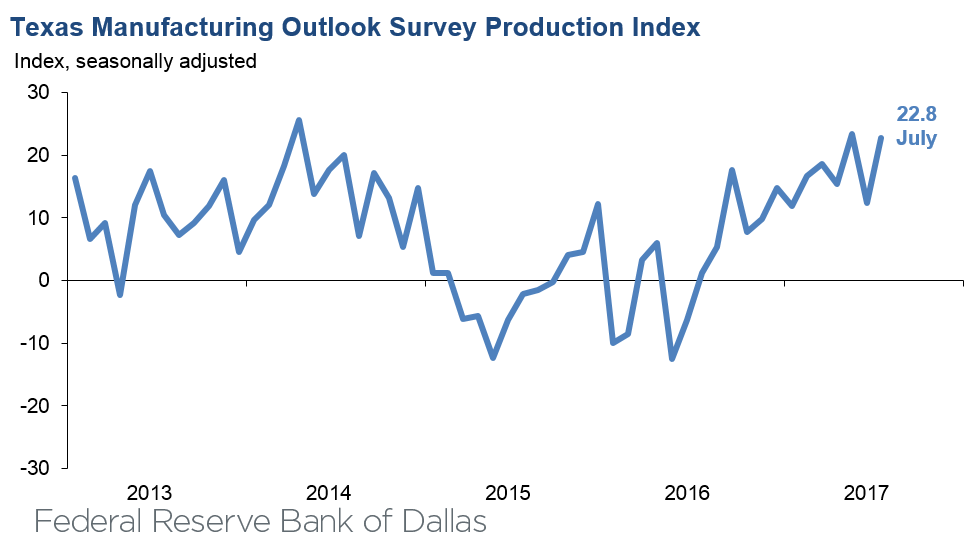
Texas factory activity increased again in July, according to business executives responding to the Texas Manufacturing Outlook Survey. The production index, a key measure of state manufacturing conditions, rose 11 points to 22.8, indicating output grew at a faster pace than in June.
Other measures of current manufacturing activity also indicated a pickup in growth. The new orders and the growth rate of orders indexes rose several points each, coming in at 16.1 and 12.2, respectively. The capacity utilization index moved up to 18.1 and the shipments index increased three points to 11.6.
Perceptions of broader business conditions improved again in July, with a sharp pickup in outlooks. The general business activity index edged up to 16.8, marking a 10th consecutive positive reading. The company outlook index jumped 15 points to 25.9, reaching its highest level since 2010.
Labor market measures indicated slightly stronger employment gains and longer workweeks this month. The employment index has been positive all year and edged up to 11.2, its highest reading since the end of 2015. Twenty-one percent of firms noted net hiring, compared with 9 percent noting net layoffs. The hours worked index ticked up to 9.8.
Prices and wages continued to rise in July. The raw materials prices index held steady at 15.5, while the finished goods prices index moved up slightly to 5.6. The wages and benefits index remained somewhat elevated at 20.6.
Expectations regarding future business conditions continued to reflect optimism. The indexes of future general business activity and future company outlook held steady at 31.6 and 34.8, respectively. Other indexes of future manufacturing activity showed mixed movements but remained solidly in positive territory.
Next release: Monday, August 28
|
Data were collected July 18–26, and 113 Texas manufacturers responded to the survey. The Dallas Fed conducts the Texas Manufacturing Outlook Survey monthly to obtain a timely assessment of the state’s factory activity. Firms are asked whether output, employment, orders, prices and other indicators increased, decreased or remained unchanged over the previous month. Survey responses are used to calculate an index for each indicator. Each index is calculated by subtracting the percentage of respondents reporting a decrease from the percentage reporting an increase. When the share of firms reporting an increase exceeds the share reporting a decrease, the index will be greater than zero, suggesting the indicator has increased over the prior month. If the share of firms reporting a decrease exceeds the share reporting an increase, the index will be below zero, suggesting the indicator has decreased over the prior month. An index will be zero when the number of firms reporting an increase is equal to the number of firms reporting a decrease. Data have been seasonally adjusted as necessary. |
July 31, 2017
Results Summary
Historical data are available from June 2004 to the most current release month.
| Business Indicators Relating to Facilities and Products in Texas Current (versus previous month) |
||||||||
| Indicator | Jul Index | Jun Index | Change | Indicator Direction* | Trend** (Months) | % Reporting Increase | % Reporting No Change |
% Reporting Decrease |
|
Production |
22.8 |
12.3 |
+10.5 |
Increasing |
13 |
37.3 |
48.3 |
14.5 |
|
Capacity Utilization |
18.1 |
12.3 |
+5.8 |
Increasing |
13 |
30.9 |
56.3 |
12.8 |
|
New Orders |
16.1 |
9.6 |
+6.5 |
Increasing |
9 |
32.5 |
51.1 |
16.4 |
|
Growth Rate of Orders |
12.2 |
4.7 |
+7.5 |
Increasing |
7 |
24.6 |
63.0 |
12.4 |
|
Unfilled Orders |
1.0 |
1.3 |
–0.3 |
Increasing |
7 |
14.2 |
72.6 |
13.2 |
|
Shipments |
11.6 |
8.5 |
+3.1 |
Increasing |
8 |
28.5 |
54.6 |
16.9 |
|
Delivery Time |
4.3 |
0.0 |
+4.3 |
Increasing |
1 |
14.1 |
76.1 |
9.8 |
|
Materials Inventories |
3.6 |
–1.6 |
+5.2 |
Increasing |
1 |
18.9 |
65.8 |
15.3 |
|
Finished Goods Inventories |
–1.7 |
–7.1 |
+5.4 |
Decreasing |
3 |
13.3 |
71.7 |
15.0 |
|
Prices Paid for Raw Materials |
15.5 |
15.6 |
–0.1 |
Increasing |
17 |
23.3 |
68.9 |
7.8 |
|
Prices Received for Finished Goods |
5.6 |
3.6 |
+2.0 |
Increasing |
12 |
13.0 |
79.6 |
7.4 |
|
Wages and Benefits |
20.6 |
21.1 |
–0.5 |
Increasing |
92 |
21.3 |
78.0 |
0.7 |
|
Employment |
11.2 |
9.6 |
+1.6 |
Increasing |
7 |
20.6 |
70.0 |
9.4 |
|
Hours Worked |
9.8 |
8.9 |
+0.9 |
Increasing |
9 |
20.8 |
68.2 |
11.0 |
|
Capital Expenditures |
11.6 |
12.7 |
–1.1 |
Increasing |
11 |
19.2 |
73.2 |
7.6 |
| General Business Conditions Current (versus previous month) |
||||||||
| Indicator | Jul Index | Jun Index | Change | Indicator Direction* | Trend** (Months) | % Reporting Improved | % Reporting No Change |
% Reporting Worsened |
|
Company Outlook |
25.9 |
10.8 |
+15.1 |
Improving |
11 |
32.9 |
60.1 |
7.0 |
|
General Business Activity |
16.8 |
15.0 |
+1.8 |
Improving |
10 |
29.5 |
57.8 |
12.7 |
| Business Indicators Relating to Facilities and Products in Texas Future (six months ahead) |
||||||||
| Indicator | Jul Index | Jun Index | Change | Indicator Direction* | Trend** (Months) | % Reporting Increase | % Reporting No Change |
% Reporting Decrease |
|
Production |
48.8 |
47.5 |
+1.3 |
Increasing |
101 |
56.4 |
36.0 |
7.6 |
|
Capacity Utilization |
39.9 |
42.9 |
–3.0 |
Increasing |
101 |
49.0 |
41.8 |
9.1 |
|
New Orders |
43.6 |
52.6 |
–9.0 |
Increasing |
101 |
51.0 |
41.6 |
7.4 |
|
Growth Rate of Orders |
32.8 |
35.7 |
–2.9 |
Increasing |
101 |
36.7 |
59.4 |
3.9 |
|
Unfilled Orders |
11.2 |
10.4 |
+0.8 |
Increasing |
22 |
16.3 |
78.6 |
5.1 |
|
Shipments |
47.0 |
45.0 |
+2.0 |
Increasing |
101 |
51.3 |
44.4 |
4.3 |
|
Delivery Time |
3.9 |
0.9 |
+3.0 |
Increasing |
8 |
11.9 |
80.1 |
8.0 |
|
Materials Inventories |
4.6 |
14.9 |
–10.3 |
Increasing |
8 |
20.0 |
64.6 |
15.4 |
|
Finished Goods Inventories |
4.7 |
7.4 |
–2.7 |
Increasing |
13 |
17.8 |
69.2 |
13.1 |
|
Prices Paid for Raw Materials |
20.8 |
18.5 |
+2.3 |
Increasing |
100 |
27.4 |
66.0 |
6.6 |
|
Prices Received for Finished Goods |
21.2 |
15.9 |
+5.3 |
Increasing |
18 |
23.1 |
75.0 |
1.9 |
|
Wages and Benefits |
45.9 |
44.7 |
+1.2 |
Increasing |
158 |
45.9 |
54.1 |
0.0 |
|
Employment |
36.2 |
32.3 |
+3.9 |
Increasing |
56 |
41.1 |
54.0 |
4.9 |
|
Hours Worked |
10.2 |
8.3 |
+1.9 |
Increasing |
14 |
20.2 |
69.8 |
10.0 |
|
Capital Expenditures |
27.1 |
25.2 |
+1.9 |
Increasing |
92 |
33.6 |
59.8 |
6.5 |
| General Business Conditions Future (six months ahead) |
||||||||
| Indicator | Jul Index | Jun Index | Change | Indicator Direction* | Trend** (Months) | % Reporting Increase | % Reporting No Change |
% Reporting Worsened |
|
Company Outlook |
34.8 |
35.6 |
–0.8 |
Improving |
18 |
37.2 |
60.4 |
2.4 |
|
General Business Activity |
31.6 |
31.9 |
–0.3 |
Improving |
14 |
32.6 |
66.4 |
1.0 |
*Indicator direction refers to this month's index. If index is positive (negative), indicator is increasing (decreasing) or improving (worsening). If zero, indicator is unchanged.
**Number of months moving in current direction.
Data have been seasonally adjusted as necessary.
July 31, 2017
Production Index
July 31, 2017
Comments from Survey Respondents
These comments are from respondents' completed surveys and have been edited for publication.
Chemical Manufacturing
- Life sciences have experienced strong growth over the past several quarters. However, we hear from our clients that they have corporate requirements to reduce their inventories by the end of the year, which will have an impact on our production levels.
Primary Metal Manufacturing
- Business is good, not great. We are busy.
Fabricated Metal Product Manufacturing
- The foreign competition for new equipment is extremely competitive and our company is not able to match their selling prices.
- Things are going poorly in the economy. We have no projects, and business is slow.
- We are experiencing the summertime blues. Business is very dull July to date.
- We are feeling more confident about the economy improving. More buyers seem to be more confident and placing orders with increased volumes and deliveries further into the future.
- One huge order has spurred our manufacturing. However, nothing similar is expected in the near future.
- There has been a notable decline in orders from energy industry customers over the past 30 days given the drop in oil prices. There is very little visibility on customer demand in the second half of the year.
Machinery Manufacturing
- The drop in oil prices in 2015 forced us out of our comfort zone and into new industries and locations. We have found that manufacturing technology from the oil industry applies equally well to defense, aerospace, heavy vehicle manufacturing and power generation. As oil recovers, we will also benefit from working in these new markets.
- Grocery store deli and fast-food chain activity remains fairly slow. We are seeing increased activity, with convenience store remodels driven by increased food offerings.
Electrical Equipment, Appliance, and Component Manufacturing
- Volumes are good, not great. They have been good for about the last three to four years. Our biggest complaint is new management at most of our major competitors who don’t manage pricing and subsequent margins well at all. We are low cost and high service and try to lead the parade up on pricing. That is the key to survival. The other issue on the aluminum-wire side is dumping by the Chinese, which we have alerted federal officials about.
- Foreign competition continues to pressure our industry, specifically in the value associated with Chinese aluminum and electronics versus similarly sourced materials from other locations.
Transportation Equipment Manufacturing
- Washington, D.C., is still a significant contingent factor for a better or worse outlook. Prospects for better are dimming.
- The improved outlook for our business over the next six months is contingent on what we expect to be an increase in municipal tax revenues as the state continues to rebound from the pullback in the energy sector. It’s possible that for us, it takes a little longer than six months, but we see initial signs of improvement.
Paper Manufacturing
- The increases in business are small but measurable. We have been trying to add employees over the last six months, with no qualified candidates available.
Printing and Related Support Activities
- I cannot explain it, but we are slower than we have ever been at this time and it seems like we are not the only ones. This is crazy how summer-vacation mindset seems to have set in and companies are just not committing to projects. Most everyone I have spoken to in the graphic arts community is complaining of the same thing. If this doesn’t turn around quickly, there will be some significant cutbacks around here—something that will be very painful, as we are down to only talented workers with no fat to trim.
Historical Data
Historical data can be downloaded dating back to June 2004.
Indexes
Download indexes for all indicators. For the definitions of all variables, see Data Definitions.
| Unadjusted |
| Seasonally adjusted |
All Data
Download indexes and components of the indexes (percentage of respondents reporting increase, decrease, or no change). For the definitions of all variables, see Data Definitions.
| Unadjusted |
| Seasonally adjusted |
Questions regarding the Texas Manufacturing Outlook Survey can be addressed to Emily Kerr at emily.kerr@dal.frb.org.
Sign up for our email alert to be automatically notified as soon as the latest Texas Manufacturing Outlook Survey is released on the web.