Texas Manufacturing Outlook Survey

Texas manufacturing production remains flat
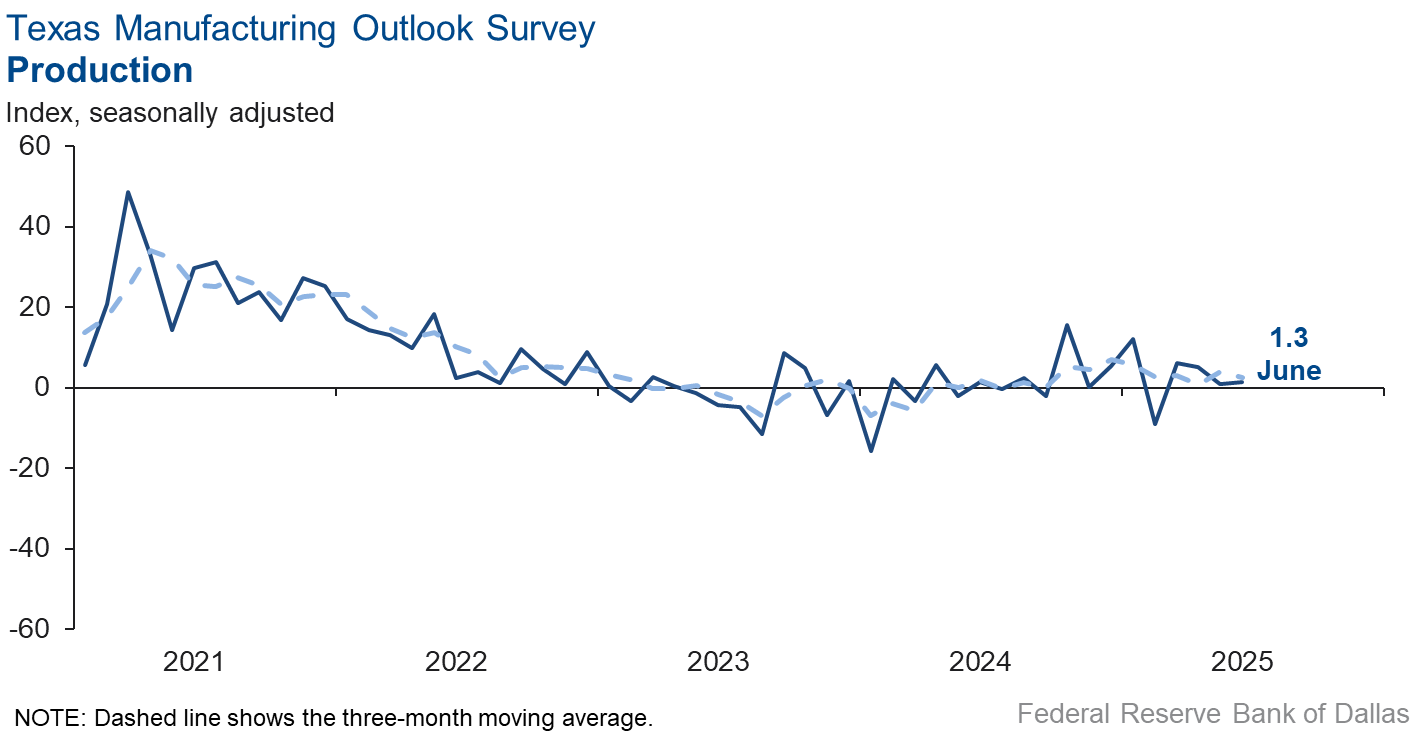
Texas factory activity was largely unchanged in June, according to business executives responding to the Texas Manufacturing Outlook Survey. The production index, a key measure of state manufacturing conditions, held steady at 1.3, with the near-zero reading indicating a second month of flat output.
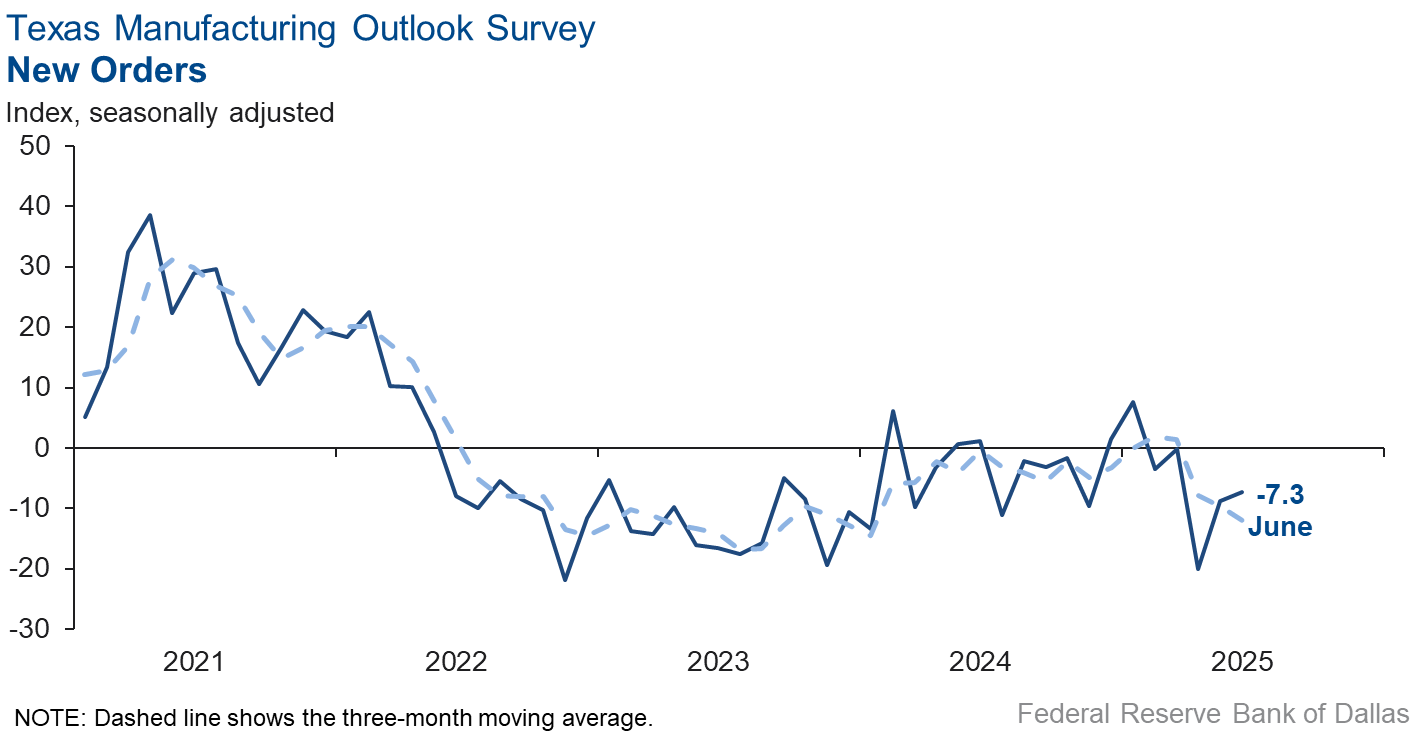
Other measures of manufacturing activity indicated a decline in June. The new orders index remained negative but edged up to -7.3 from -8.7. The capacity utilization index was largely unchanged at -1.0. The shipments index fell eight points to -7.3.
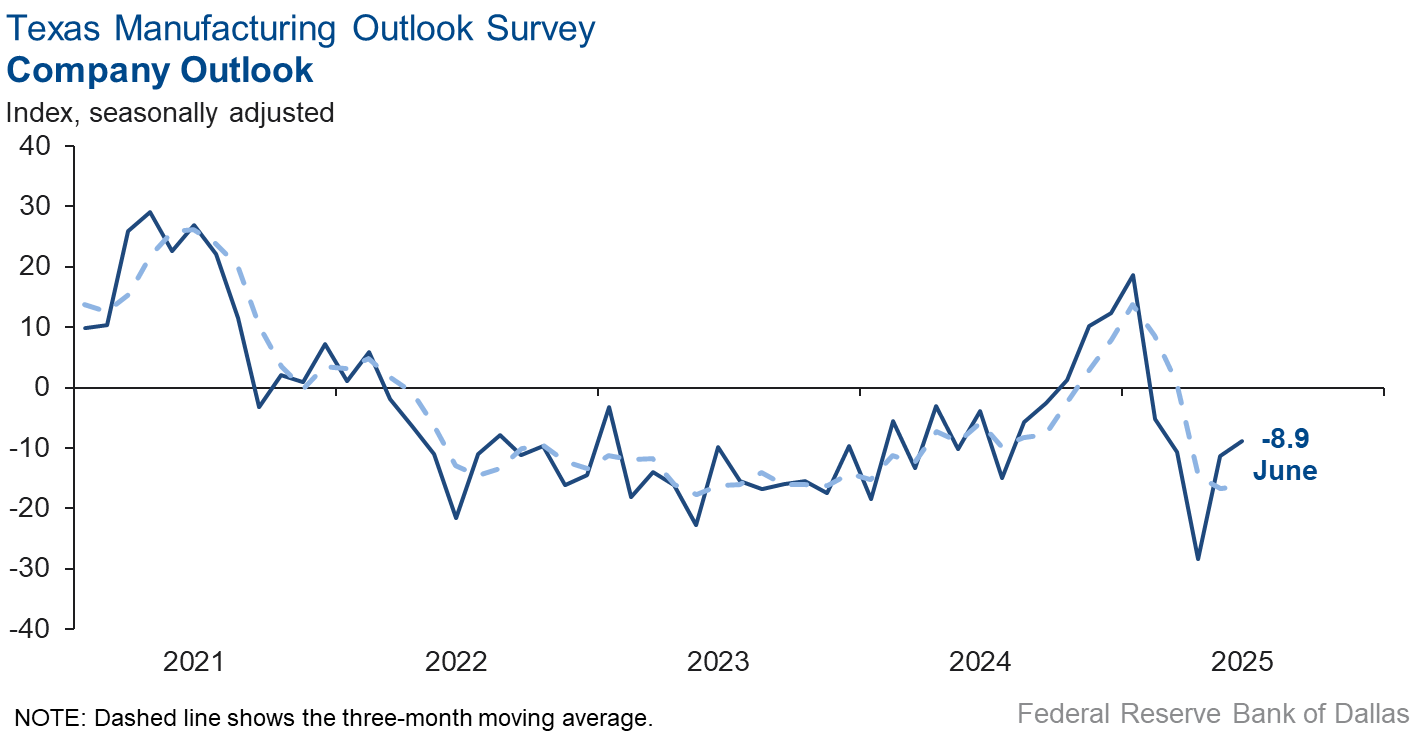
Perceptions of broader business conditions continued to worsen in June, though the indexes were slightly less negative than last month. The general business activity index inched up to -12.7, and the company outlook index edged up to -8.9. The outlook uncertainty index rose three points to 15.2.
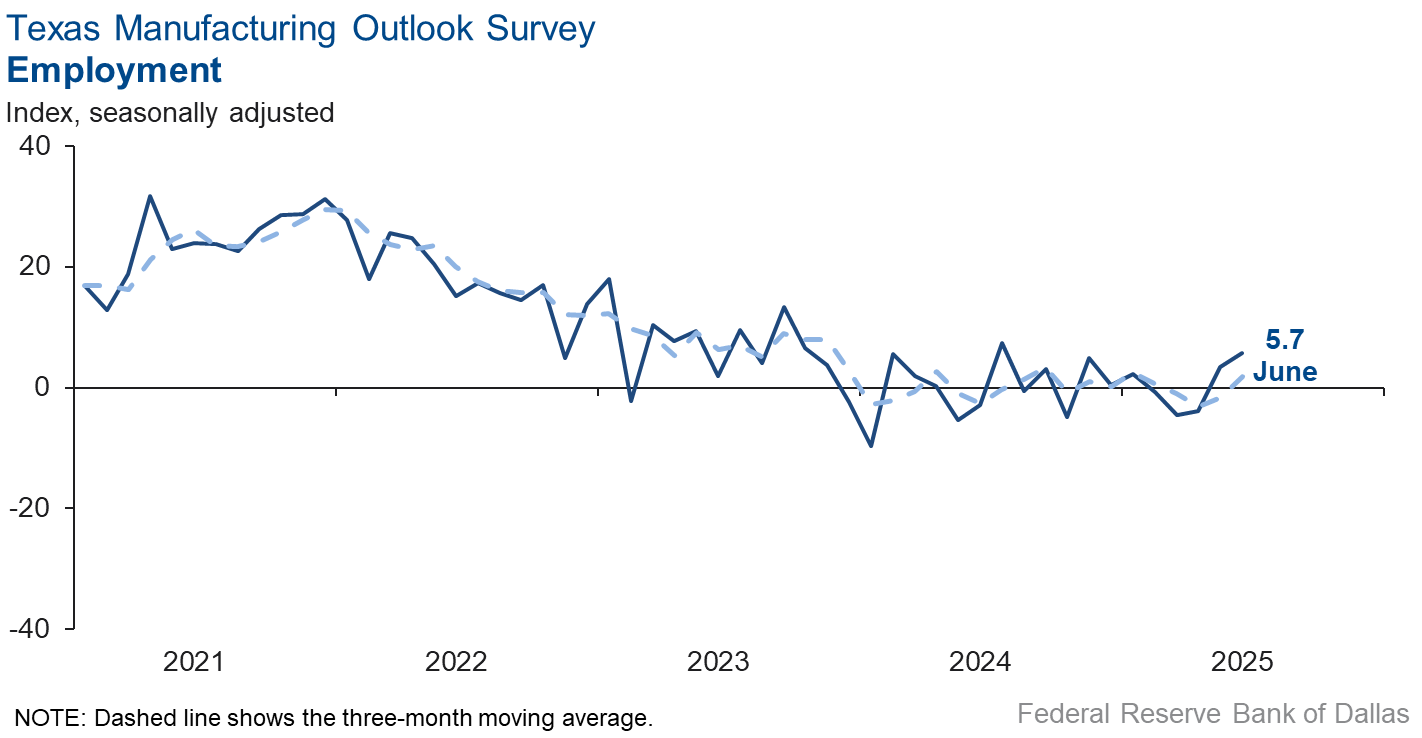
Labor market measures suggested an increase in head counts but shorter workweeks this month. The employment index moved up two points to 5.7, with 18 percent of firms noting net hiring and 12 percent noting net layoffs. The hours worked index remained negative and fell five points to -8.4.
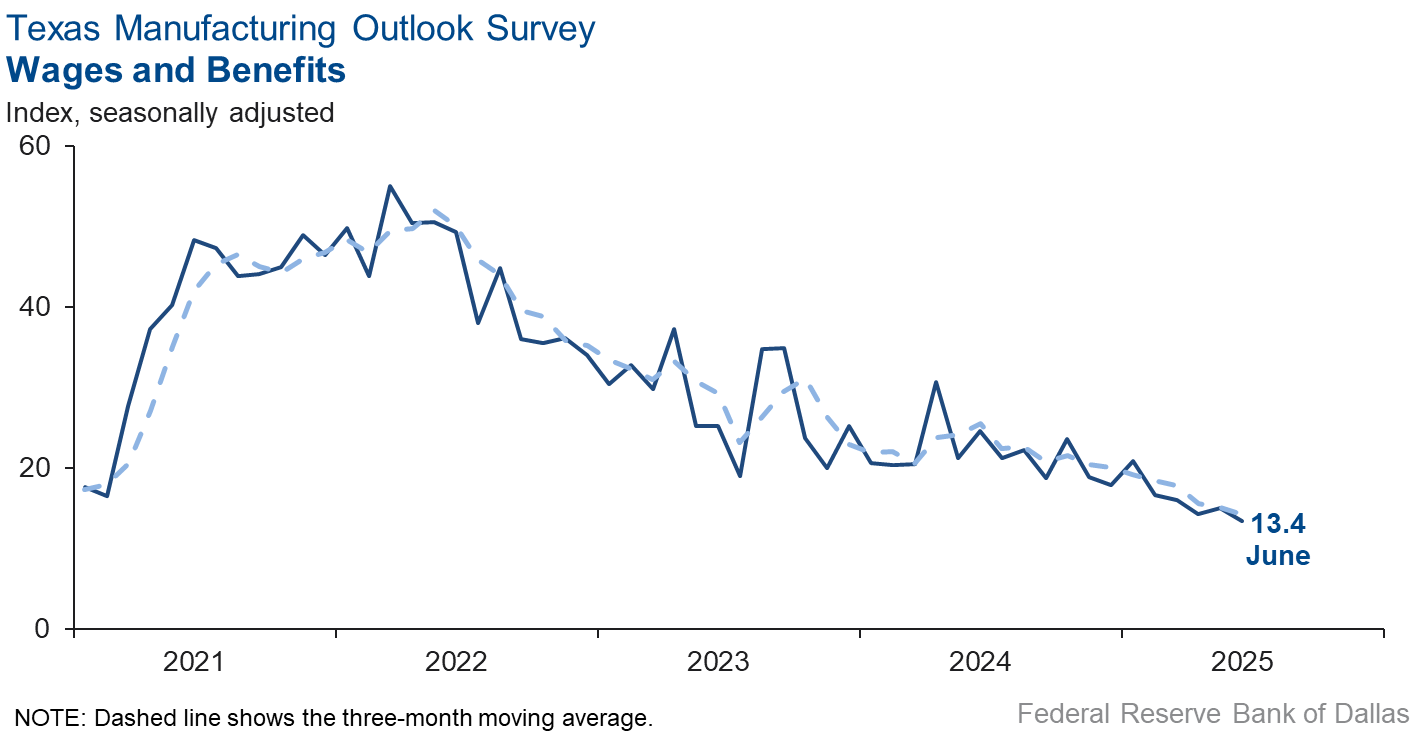
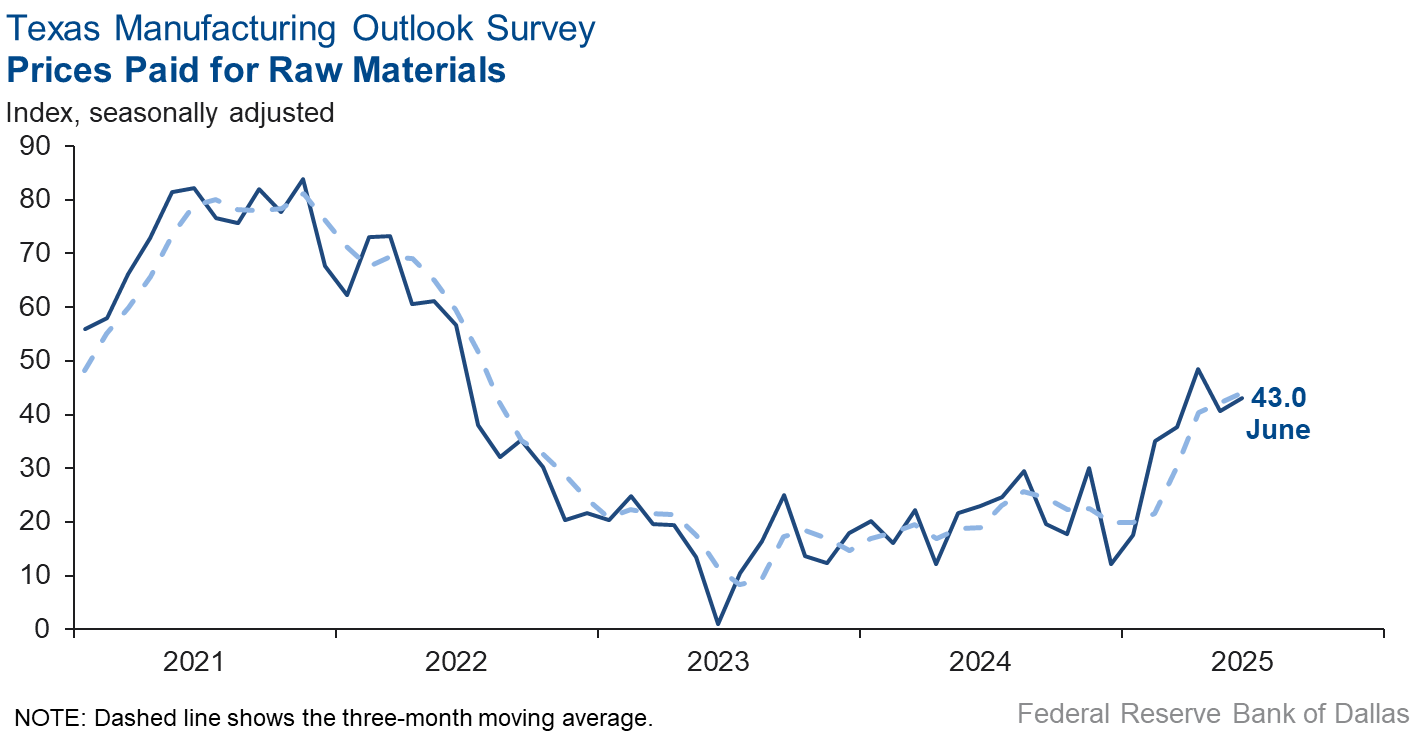
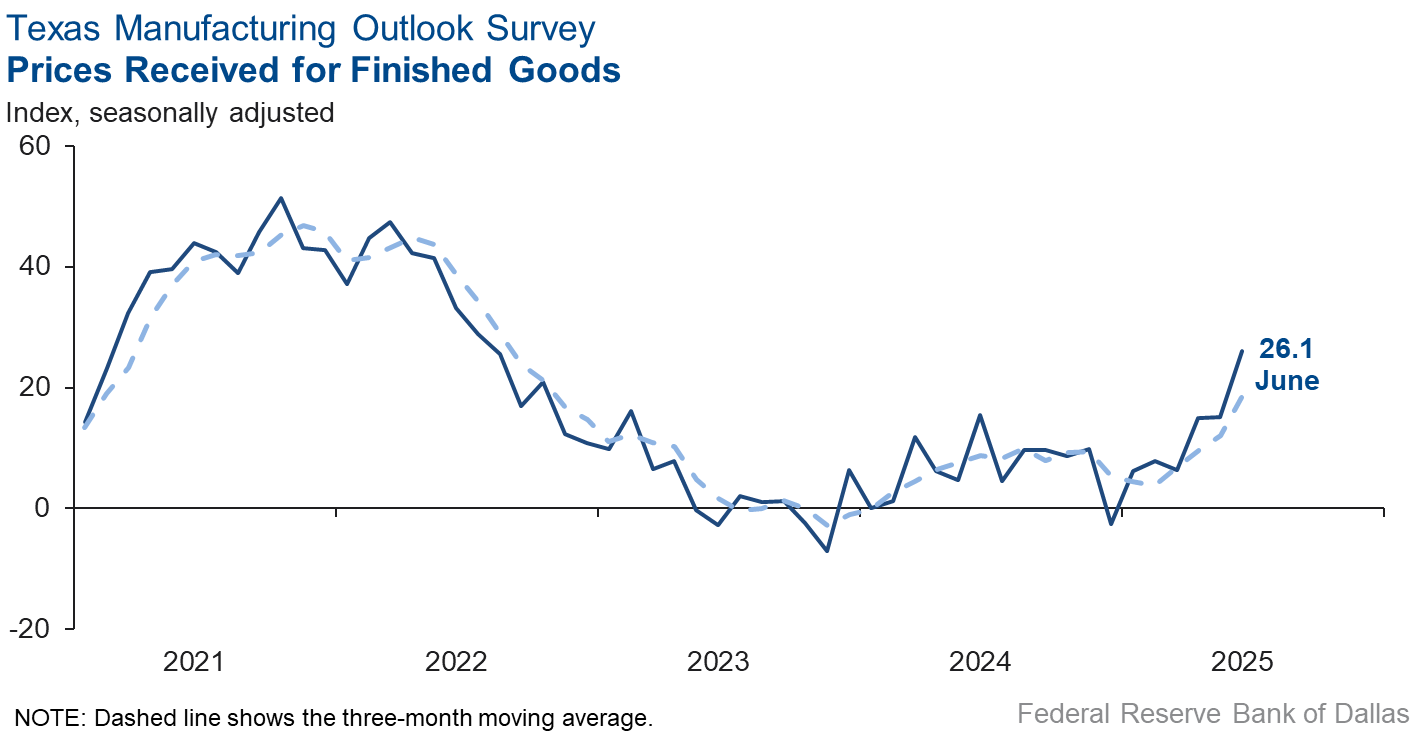
Elevated price pressures continued in June, while wage growth remained rather subdued. The raw materials prices index inched up to 43.0. The finished goods prices index rose 11 points to 26.1, its highest reading in nearly three years. Meanwhile, the wages and benefits index slipped further below average, to a reading of 13.4.
Expectations for manufacturing activity six months from now remained positive. The future production index dipped 9 points to 22.6, while the future general business activity index rose 13 points, pushing just above its average reading. Other indexes of future manufacturing activity showed mixed movements but remained positive, albeit below average.
Next release: Monday, July 28
Data were collected June 17–25, and 80 of the 118 Texas manufacturers surveyed submitted responses. The Dallas Fed conducts the Texas Manufacturing Outlook Survey monthly to obtain a timely assessment of the state’s factory activity. Firms are asked whether output, employment, orders, prices and other indicators increased, decreased or remained unchanged over the previous month.
Survey responses are used to calculate an index for each indicator. Each index is calculated by subtracting the percentage of respondents reporting a decrease from the percentage reporting an increase. When the share of firms reporting an increase exceeds the share reporting a decrease, the index will be greater than zero, suggesting the indicator has increased over the prior month. If the share of firms reporting a decrease exceeds the share reporting an increase, the index will be below zero, suggesting the indicator has decreased over the prior month. An index will be zero when the number of firms reporting an increase is equal to the number of firms reporting a decrease. Data have been seasonally adjusted as necessary.
Results summary
Historical data are available from June 2004 to the most current release month.
| Business Indicators Relating to Facilities and Products in Texas Current (versus previous month) | ||||||||
| Indicator | Jun Index | May Index | Change | Series Average | Trend* | % Reporting Increase | % Reporting No Change | % Reporting Decrease |
Production | 1.3 | 0.9 | +0.4 | 9.5 | 4(+) | 31.7 | 37.8 | 30.4 |
Capacity Utilization | –1.0 | –1.5 | +0.5 | 7.4 | 5(–) | 26.9 | 45.1 | 27.9 |
New Orders | –7.3 | –8.7 | +1.4 | 4.7 | 5(–) | 26.7 | 39.2 | 34.0 |
Growth Rate of Orders | –17.2 | –16.4 | –0.8 | –1.1 | 5(–) | 18.7 | 45.4 | 35.9 |
Unfilled Orders | –12.1 | –9.3 | –2.8 | –2.5 | 10(–) | 8.8 | 70.3 | 20.9 |
Shipments | –7.3 | 0.5 | –7.8 | 7.9 | 1(–) | 26.9 | 39.0 | 34.2 |
Delivery Time | –7.9 | –2.2 | –5.7 | 0.6 | 3(–) | 8.1 | 75.9 | 16.0 |
Finished Goods Inventories | –11.3 | –1.3 | –10.0 | –3.1 | 2(–) | 15.0 | 58.8 | 26.3 |
Prices Paid for Raw Materials | 43.0 | 40.7 | +2.3 | 27.3 | 62(+) | 43.2 | 56.6 | 0.2 |
Prices Received for Finished Goods | 26.1 | 15.1 | +11.0 | 8.7 | 6(+) | 29.8 | 66.5 | 3.7 |
Wages and Benefits | 13.4 | 15.0 | –1.6 | 21.1 | 62(+) | 14.8 | 83.8 | 1.4 |
Employment | 5.7 | 3.5 | +2.2 | 7.2 | 2(+) | 17.8 | 70.1 | 12.1 |
Hours Worked | –8.4 | –3.6 | –4.8 | 3.0 | 5(–) | 15.5 | 60.6 | 23.9 |
Capital Expenditures | 10.9 | 2.1 | +8.8 | 6.6 | 2(+) | 24.9 | 61.1 | 14.0 |
| General Business Conditions Current (versus previous month) | ||||||||
| Indicator | Jun Index | May Index | Change | Series Average | Trend** | % Reporting Improved | % Reporting No Change | % Reporting Worsened |
Company Outlook | –8.9 | –11.3 | +2.4 | 4.3 | 5(–) | 17.4 | 56.3 | 26.3 |
General Business Activity | –12.7 | –15.3 | +2.6 | 0.4 | 5(–) | 17.9 | 51.5 | 30.6 |
| Indicator | Jun Index | May Index | Change | Series Average | Trend* | % Reporting Increase | % Reporting No Change | % Reporting Decrease |
Outlook Uncertainty | 15.2 | 12.7 | +2.5 | 17.2 | 50(+) | 30.4 | 54.4 | 15.2 |
| Business Indicators Relating to Facilities and Products in Texas Future (six months ahead) | ||||||||
| Indicator | Jun Index | May Index | Change | Series Average | Trend* | % Reporting Increase | % Reporting No Change | % Reporting Decrease |
Production | 22.6 | 31.1 | –8.5 | 36.1 | 62(+) | 42.7 | 37.1 | 20.1 |
Capacity Utilization | 20.8 | 22.1 | –1.3 | 33.0 | 62(+) | 40.9 | 39.0 | 20.1 |
New Orders | 22.8 | 21.3 | +1.5 | 33.6 | 32(+) | 42.6 | 37.6 | 19.8 |
Growth Rate of Orders | 15.3 | 10.9 | +4.4 | 24.8 | 25(+) | 35.3 | 44.7 | 20.0 |
Unfilled Orders | –6.9 | –1.4 | –5.5 | 2.8 | 5(–) | 8.3 | 76.5 | 15.2 |
Shipments | 27.3 | 21.3 | +6.0 | 34.5 | 62(+) | 47.2 | 32.9 | 19.9 |
Delivery Time | –0.5 | –1.6 | +1.1 | –1.4 | 4(–) | 11.0 | 77.5 | 11.5 |
Finished Goods Inventories | –2.6 | –8.2 | +5.6 | –0.2 | 4(–) | 13.0 | 71.4 | 15.6 |
Prices Paid for Raw Materials | 39.9 | 39.8 | +0.1 | 33.6 | 63(+) | 48.5 | 43.0 | 8.6 |
Prices Received for Finished Goods | 27.3 | 28.2 | –0.9 | 21.1 | 62(+) | 32.5 | 62.3 | 5.2 |
Wages and Benefits | 32.1 | 16.0 | +16.1 | 39.1 | 62(+) | 35.0 | 62.1 | 2.9 |
Employment | 15.4 | 13.6 | +1.8 | 22.8 | 61(+) | 27.4 | 60.6 | 12.0 |
Hours Worked | –4.5 | –0.8 | –3.7 | 8.7 | 2(–) | 13.4 | 68.7 | 17.9 |
Capital Expenditures | 16.9 | 24.0 | –7.1 | 19.4 | 61(+) | 28.4 | 60.1 | 11.5 |
| General Business Conditions Future (six months ahead) | ||||||||
| Indicator | Jun Index | May Index | Change | Series Average | Trend** | % Reporting Increase | % Reporting No Change | % Reporting Worsened |
Company Outlook | 16.4 | 5.6 | +10.8 | 18.3 | 2(+) | 29.8 | 56.8 | 13.4 |
General Business Activity | 14.4 | 1.3 | +13.1 | 12.3 | 2(+) | 29.6 | 55.2 | 15.2 |
*Shown is the number of consecutive months of expansion or contraction in the underlying indicator. Expansion is indicated by a positive index reading and denoted by a (+) in the table. Contraction is indicated by a negative index reading and denoted by a (–) in the table.
**Shown is the number of consecutive months of improvement or worsening in the underlying indicator. Improvement is indicated by a positive index reading and denoted by a (+) in the table. Worsening is indicated by a negative index reading and denoted by a (–) in the table.
Data have been seasonally adjusted as necessary.

Comments from survey respondents
Survey participants are given the opportunity to submit comments on current issues that may be affecting their businesses. Some comments have been edited for grammar and clarity.
- The world is responding in an unprecedented destocking. The tariff-driven dumping by China to other countries is preventing competitiveness on a global scale. End consumer demand is down, causing finished product inventories to fall significantly as companies attempt to manage through this unprecedented period. The entire supply chain is backed up by as much as two months, even if the global economic outlook improves. We believe destocking may cease, but orders will be slow to increase due to this two-month backlog in the supply chain.
- General activity in the chemical industry seems to have decreased substantially.
- Uncertainty revolving around tariffs still exists, and reduced tariffs expiring may impact us in the near future. But the level of uncertainty remains constant until a more permanent resolution takes place.
- The only way to improve U.S. capital equipment manufacturing is to lower interest rates so that end users start to invest in American infrastructure. Lowering interest rates should also improve economic conditions, ease uncertainty and combat the tariffs' effects on manufacturing and consumer confidence. Here we are, delaying and being late with the inevitable. Lower interest rates, please.
- Federal Reserve rate hike and inflation comments will decrease demand for our goods and services.
- We expect an uptick in demand and production over the next two months but then expect it to drop off by the fourth quarter.
- It seems there is a slowdown in starting new projects.
- There is too much uncertainty with the Middle East and how it might impact the economy here.
- DOGE [Department of Government Efficiency] killed our primary customer. Other customers have seen their sales and profitability decrease or are in a state of stagflation.
- There is no way to predict the future until tariffs are settled. We just have to wait and see. We believe the administration’s moves are based on the moves of their opponents.
- Customers indicate weakening consumer demand and concern about July tariff implementation preventing investment.
- We are seeing increased business activity that we think will expand after the tariff situations are settled.
- Things are about to bust loose. At least that’s what we are praying for, telling ourselves, and thinking about. Let’s hope we’re right.
- [Business] seems to be slowing down a bit.
- Tariffs [are an issue of concern].
- The largest issue is the tariff impact. There are a lot of unknowns about how long they last and exactly what the impact is per item.
- There are still lots of unknowns due to tariff questions. Uncertainty is difficult.
- We are watching the effects of tariff policies on input costs and raw materials.
- Our customers are retailers. Some stronger retailers are investing during this uncertain period. Some of these investments are very challenging. Just what will happen with the tariffs, and how will we respond?
- We are hopeful that the administration maintains or strengthens the Section 232 aluminum tariffs and adds hard quota limits to control the flow of heavily subsidized or dumped aluminum extrusions into our country. Even more importantly, if exemptions to these Section 232 duties are granted to other countries, especially Mexico, our industry will be severely impacted. We would certainly cancel a planned major capital project, as those exempted countries would gain a significant pricing advantage over domestic producers. On top of that, China would continue expanding aluminum manufacturing facilities in Mexico and other exempted countries to capitalize on this imbalance.
- We are fortunate to be busy with some large projects we do at this time of year; otherwise, we would be stupid slow. It's ridiculous how little activity there is, and I have to believe it's because of all the chaos in Washington, D.C. and craziness of tariff uncertainties that is contributing to this. We are now starting to see vendors increasing prices due to a variety of reasons, one of which is tariff recovery.
- Tariff policy may benefit our business, as it is raising costs for those who buy imported product. That will benefit our business. Uncertainty has caused and continues to cause concerns as component costs in our manufacturing process are also subject to drastic price changes.
- June has been a better month with the temporary tariff relief/pause (sales are up, etc). However, no one is sure what to expect in the second half of the year with inflation, input price increases and consumer demand.
- Tariffs are affecting the pricing of domestic steel. As volume increases domestically, the prices are increasing.
- High interest rates stifle our demand.
Historical Data
Historical data can be downloaded dating back to June 2004.
Indexes
Download indexes for all indicators. For the definitions of all variables, see Data Definitions.
| Unadjusted |
| Seasonally adjusted |
All Data
Download indexes and components of the indexes (percentage of respondents reporting increase, decrease, or no change). For the definitions of all variables, see Data Definitions.
| Unadjusted |
| Seasonally adjusted |
Questions regarding the Texas Business Outlook Surveys can be addressed to Emily Kerr at emily.kerr@dal.frb.org.
Sign up for our email alert to be automatically notified as soon as the latest Texas Manufacturing Outlook Survey is released on the web.