Texas Manufacturing Outlook Survey

January 28, 2019
Growth in Texas Manufacturing Activity Accelerates
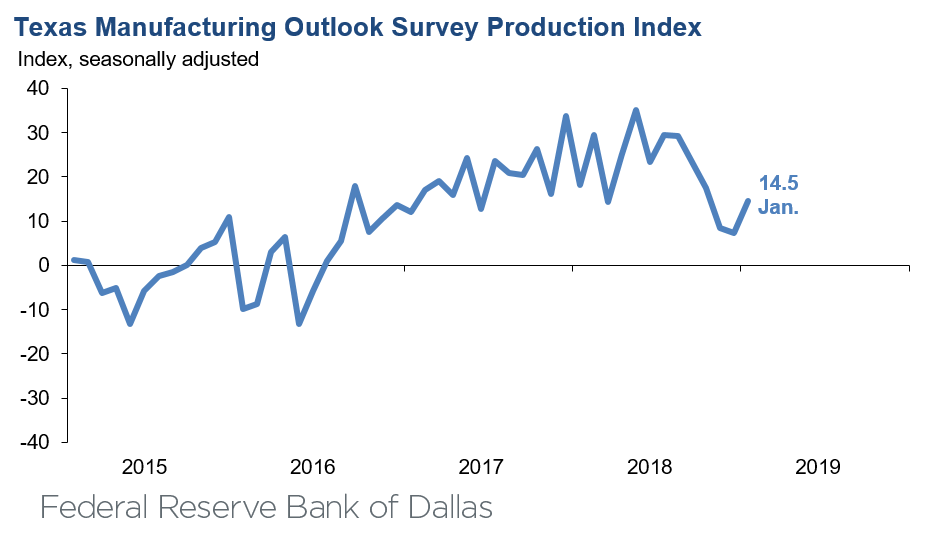
Texas factory activity continued to expand in January, according to business executives responding to the Texas Manufacturing Outlook Survey. The production index, a key measure of state manufacturing conditions, rose from 7.3 to 14.5, indicating an acceleration in output growth.
Other measures of manufacturing activity also suggested continued expansion in January, although the pace of demand growth slowed a bit. The capacity utilization index rose seven points to 14.8, and the shipments index rose five points to 11.4. Meanwhile, the new orders index edged down to 11.6 and the growth rate of new orders index fell from 5.8 to 1.2.
Perceptions of broader business conditions improved in January. The general business activity index rebounded from a multiyear low of -5.1 in December to 1.0 in January. This near-zero reading suggests manufacturers were fairly balanced in their assessment of whether activity had improved or worsened from last month. The company outlook index also rebounded from negative territory this month, rising more than 10 points to 7.1.
Labor market measures suggested slower growth in employment and workweek length in January. The employment index retreated four points to 6.6, a two-year low. Sixteen percent of firms noted net hiring, compared with 10 percent noting net layoffs. The hours worked index edged down to 3.6.
Upward pressure on input prices and wages eased further in January, while pressure on selling prices held steady. The raw materials price index slipped eight points to 21.2, and the wages and benefits index ticked down two points to 27.4. Meanwhile, the finished goods price index held steady at 6.4.
Expectations regarding future business conditions pushed further positive in January. The indexes of future general business activity and future company outlook rose to 11.7 and 22.3, respectively. Other indexes of future manufacturing activity also posted increases this month.
Next release: Monday, February 25
|
Data were collected Jan. 15–23, and 111 Texas manufacturers responded to the survey. The Dallas Fed conducts the Texas Manufacturing Outlook Survey monthly to obtain a timely assessment of the state’s factory activity. Firms are asked whether output, employment, orders, prices and other indicators increased, decreased or remained unchanged over the previous month Survey responses are used to calculate an index for each indicator. Each index is calculated by subtracting the percentage of respondents reporting a decrease from the percentage reporting an increase. When the share of firms reporting an increase exceeds the share reporting a decrease, the index will be greater than zero, suggesting the indicator has increased over the prior month. If the share of firms reporting a decrease exceeds the share reporting an increase, the index will be below zero, suggesting the indicator has decreased over the prior month. An index will be zero when the number of firms reporting an increase is equal to the number of firms reporting a decrease. Data have been seasonally adjusted as necessary. |
January 28, 2019
Results Summary
Historical data are available from June 2004 to the most current release month.
| Business Indicators Relating to Facilities and Products in Texas Current (versus previous month) | ||||||||
| Indicator | Jan Index | Dec Index | Change | Indicator Direction* | Trend** (Months) | % Reporting Increase | % Reporting No Change | % Reporting Decrease |
Production | 14.5 | 7.3 | +7.2 | Increasing | 31 | 33.4 | 47.7 | 18.9 |
Capacity Utilization | 14.8 | 7.6 | +7.2 | Increasing | 31 | 31.9 | 51.0 | 17.1 |
New Orders | 11.6 | 14.4 | –2.8 | Increasing | 27 | 33.2 | 45.1 | 21.6 |
Growth Rate of Orders | 1.2 | 5.8 | –4.6 | Increasing | 25 | 24.9 | 51.4 | 23.7 |
Unfilled Orders | 0.2 | –2.3 | +2.5 | Increasing | 1 | 13.6 | 73.0 | 13.4 |
Shipments | 11.4 | 6.1 | +5.3 | Increasing | 26 | 31.0 | 49.4 | 19.6 |
Delivery Time | –2.3 | –3.2 | +0.9 | Decreasing | 2 | 9.5 | 78.7 | 11.8 |
Finished Goods Inventories | 5.4 | 1.9 | +3.5 | Increasing | 6 | 19.8 | 65.8 | 14.4 |
Prices Paid for Raw Materials | 21.2 | 28.8 | –7.6 | Increasing | 35 | 32.1 | 57.0 | 10.9 |
Prices Received for Finished Goods | 6.4 | 6.6 | –0.2 | Increasing | 30 | 14.9 | 76.6 | 8.5 |
Wages and Benefits | 27.4 | 29.2 | –1.8 | Increasing | 114 | 28.9 | 69.6 | 1.5 |
Employment | 6.6 | 11.0 | –4.4 | Increasing | 25 | 16.1 | 74.4 | 9.5 |
Hours Worked | 3.6 | 5.0 | –1.4 | Increasing | 27 | 17.1 | 69.4 | 13.5 |
Capital Expenditures | 16.0 | 14.2 | +1.8 | Increasing | 29 | 23.3 | 69.4 | 7.3 |
| General Business Conditions Current (versus previous month) | ||||||||
| Indicator | Jan Index | Dec Index | Change | Indicator Direction* | Trend** (Months) | % Reporting Improved | % Reporting No Change | % Reporting Worsened |
Company Outlook | 7.1 | –3.4 | +10.5 | Improving | 1 | 23.1 | 60.9 | 16.0 |
General Business Activity | 1.0 | –5.1 | +6.1 | Improving | 1 | 17.3 | 66.4 | 16.3 |
| Indicator | Jan Index | Dec Index | Change | Indicator Direction* | Trend** (Months) | % Reporting Increase | % Reporting No Change | % Reporting Decrease |
Outlook Uncertainty† | 15.6 | 9.2 | +6.4 | Increasing | 8 | 27.5 | 60.6 | 11.9 |
| Business Indicators Relating to Facilities and Products in Texas Future (six months ahead) | ||||||||
| Indicator | Jan Index | Dec Index | Change | Indicator Direction | Trend* (Months) | % Reporting Increase | % Reporting No Change | % Reporting Decrease |
Production | 53.4 | 32.7 | +20.7 | Increasing | 119 | 58.3 | 36.8 | 4.9 |
Capacity Utilization | 48.2 | 30.5 | +17.7 | Increasing | 119 | 53.1 | 42.0 | 4.9 |
New Orders | 44.7 | 32.4 | +12.3 | Increasing | 119 | 52.3 | 40.1 | 7.6 |
Growth Rate of Orders | 38.5 | 23.1 | +15.4 | Increasing | 119 | 46.0 | 46.5 | 7.5 |
Unfilled Orders | 5.5 | 1.4 | +4.1 | Increasing | 40 | 19.1 | 67.3 | 13.6 |
Shipments | 43.7 | 32.4 | +11.3 | Increasing | 119 | 51.4 | 40.9 | 7.7 |
Delivery Time | 4.0 | 8.9 | –4.9 | Increasing | 26 | 13.1 | 77.8 | 9.1 |
Finished Goods Inventories | 8.6 | 2.0 | +6.6 | Increasing | 15 | 19.2 | 70.2 | 10.6 |
Prices Paid for Raw Materials | 31.8 | 34.3 | –2.5 | Increasing | 118 | 38.5 | 54.8 | 6.7 |
Prices Received for Finished Goods | 26.7 | 26.7 | 0.0 | Increasing | 36 | 35.6 | 55.4 | 8.9 |
Wages and Benefits | 47.7 | 45.0 | +2.7 | Increasing | 176 | 47.7 | 52.3 | 0.0 |
Employment | 39.4 | 28.2 | +11.2 | Increasing | 74 | 45.4 | 48.6 | 6.0 |
Hours Worked | 15.6 | 10.8 | +4.8 | Increasing | 32 | 23.0 | 69.6 | 7.4 |
Capital Expenditures | 34.2 | 24.7 | +9.5 | Increasing | 110 | 40.9 | 52.4 | 6.7 |
| General Business Conditions Future (six months ahead) | ||||||||
| Indicator | Jan Index | Dec Index | Change | Indicator Direction* | Trend** (Months) | % Reporting Increase | % Reporting No Change | % Reporting Worsened |
Company Outlook | 22.3 | 8.8 | +13.5 | Improving | 36 | 32.9 | 56.5 | 10.6 |
General Business Activity | 11.7 | 3.2 | +8.5 | Improving | 32 | 26.8 | 58.1 | 15.1 |
*Indicator direction refers to this month's index. If index is positive (negative), indicator is increasing (decreasing) or improving (worsening). If zero, indicator is unchanged.
**Number of months moving in current direction.
†Added to survey in January 2019.
Data have been seasonally adjusted as necessary, with the exception of the outlook uncertainty index, which does not yet have a sufficiently long time series to test for seasonality.
January 28, 2019
Production Index
January 28, 2019
Comments from Survey Respondents
These comments are from respondents' completed surveys and have been edited for publication.
Primary Metal Manufacturing
- Production and shipments have decreased due to weather. Our backlog remains good.
Fabricated Metal Product Manufacturing
- Steel and oil price softness is of concern. I hope the talking heads aren't talking us into a recession.
- We've recently lost a large contract (15 percent of our 2018 business) to a U.S. company operating in Mexico. The new supplier was able to offer much better pricing. However, we feel that the strength of other current and prospective customers will allow us to hit our 2019 revenue targets.
- There has been an increase in foreign-made steel structures for the transmission industry. This is compounded by an increase in domestic steel prices causing an increase in cost for domestic fabricated products.
- Our backlog is expanding more at this time of the year than it has in several years. Our challenges to take advantage of our order increase are: (1) securing additional financing from our bank, and (2) hiring additional skilled shop personnel—fitters, welders and helpers.
Machinery Manufacturing
- So far, the government shutdown has not caused any issues.
- We remain cautiously optimistic about current business conditions.
- Overall company profits are suffering. We are still quoting many jobs against more competitors, which will cause lower profits in the future. We have decided to cut our current inventories down substantially to reduce purchasing anything new. Cash is once again valued highly, and we are very happy that we paid off debt last year when business was much stronger and the outlook was clearer.
- This has been the worst start to the new year in the 44 years I have worked.
Computer and Electronic Product Manufacturing
- Uncertainty has increased in the near term. Clearly, business is decelerating due to cyclicality. What is unknown is if the macro will make the trough deeper, wider or both.
Electrical Equipment, Appliance and Component Manufacturing
- We are going through a shakeup in our production area in management, tactics and processes. We had a great 2018, but the board, CEO and CFO (me) are certain it could have been better. Sales were constrained by manufacturing capacity. Manufacturing capacity was constrained by a shortage of skilled labor, which caused other issues to blossom. We are addressing all of these as soon as possible, including a wage survey we had done which showed we were below market on starting pay. We raised our starting pay for hourly workers 5 to 20 percent based on position, experience, etc. We had not done a survey in several years.
- The general economy has not seemed to help our business at all in 2018. The tariff war with China impacted our business. Currently, we are pending a General Services Administration schedule and HUBZone [Small Business Administration] certification, both submitted for approval mid-December. The government shutdown will impact negatively in this area. In addition, the shutdown has delayed contracts that we have either already been awarded or are pending award. I think the daily drama of this administration is negatively impacting business activity in general. People are too focused on the drama and not on getting business done. I have many friends who have seen a general downturn in 2018 compared with 2017. It is puzzling as to why the economy is doing well but we are not seeing it. Our 2018 revenue was down about 20 percent from 2017.
Transportation Equipment Manufacturing
- Our primary customer is the U.S. government. The ongoing government shutdown is negatively impacting our business due to the uncertainty of the method of resolving the shutdown.
- January 2019 business will double that of January 2018.
Printing and Related Support Activities
- January has been very slow for incoming orders, and while the plant is busy, we are quickly eating into the backlog of work we normally have on hand. There has been increased quote activity as of late, but we’re ridiculously slow on incoming orders. We are optimistic that six months from now will be better, and some of that is seasonal as we can be very slow in the winter and early spring months.
Food Manufacturing
- The current government shutdown has yet to impact our business, but I would expect that to change 30 days from now if the shutdown remains. We will deal with it either way. Our “rainy day” account is fully funded.
Paper Manufacturing
- December is seasonally slow, but January has continued the slow pace. At the present time, “hope” has kept our six-month outlook unchanged.
Miscellaneous Manufacturing
- China and the European Union are both a factor over the coming year. Our largest-volume product comes from China, now with a large duty.
Historical Data
Historical data can be downloaded dating back to June 2004.
Indexes
Download indexes for all indicators. For the definitions of all variables, see Data Definitions.
| Unadjusted |
| Seasonally adjusted |
All Data
Download indexes and components of the indexes (percentage of respondents reporting increase, decrease, or no change). For the definitions of all variables, see Data Definitions.
| Unadjusted |
| Seasonally adjusted |
Questions regarding the Texas Manufacturing Outlook Survey can be addressed to Emily Kerr at emily.kerr@dal.frb.org.
Sign up for our email alert to be automatically notified as soon as the latest Texas Manufacturing Outlook Survey is released on the web.