Texas Manufacturing Outlook Survey

Growth resumes in the Texas manufacturing sector
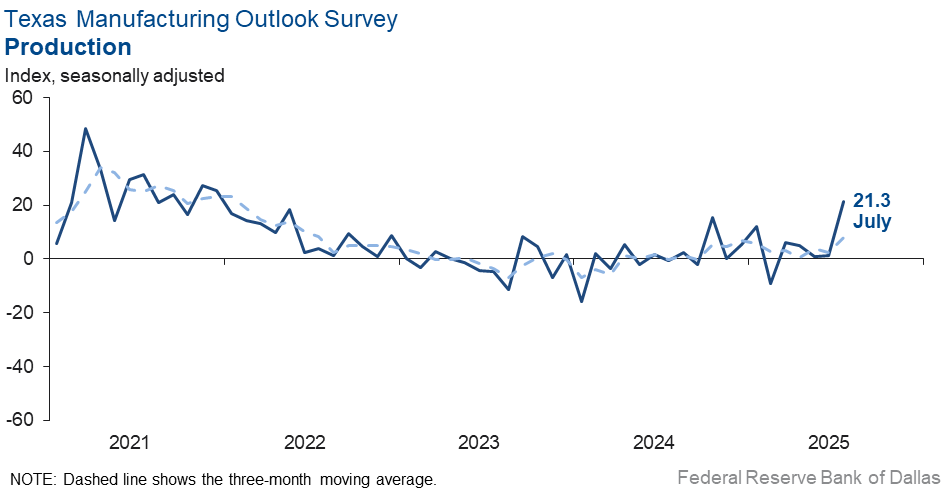
Texas factory activity picked up notably in July, according to business executives responding to the Texas Manufacturing Outlook Survey. The production index, a key measure of state manufacturing conditions, jumped 20 points to 21.3, its highest reading in more than three years.
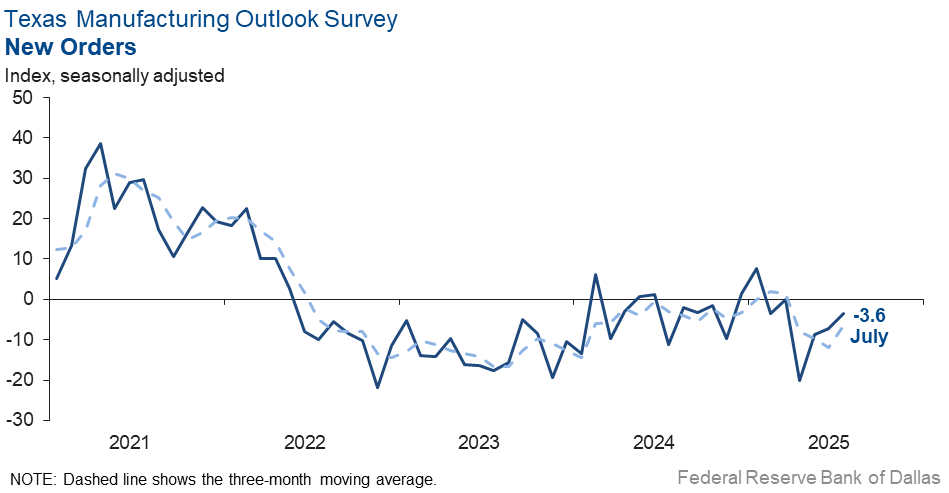
Other measures of manufacturing activity were mixed. The new orders index remained negative but moved up to -3.6 from -7.3. Meanwhile the capacity utilization and shipments indexes pushed up into positive territory, coming in at 17.3 and 2.7, respectively.
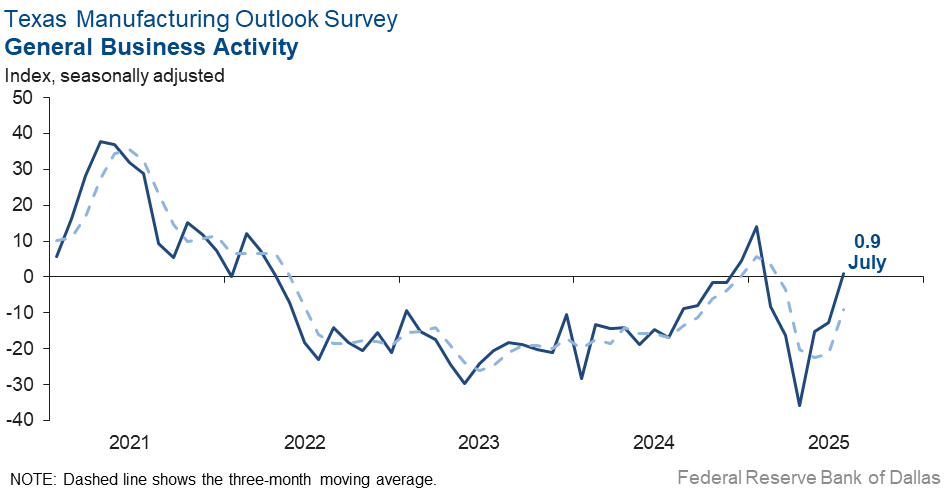
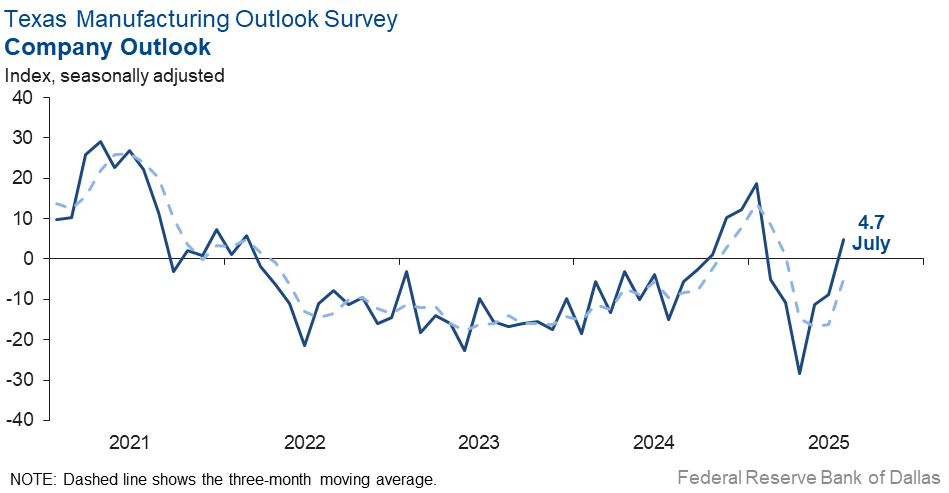
Perceptions of broader business conditions stabilized, and outlooks improved. The general business activity index shot up 14 points to a near-zero reading, indicating no change in activity in July after five months of worsening. The company outlook index also jumped 14 points to 4.7, posting its first positive reading in six months. The outlook uncertainty index retreated four points to 11.2.
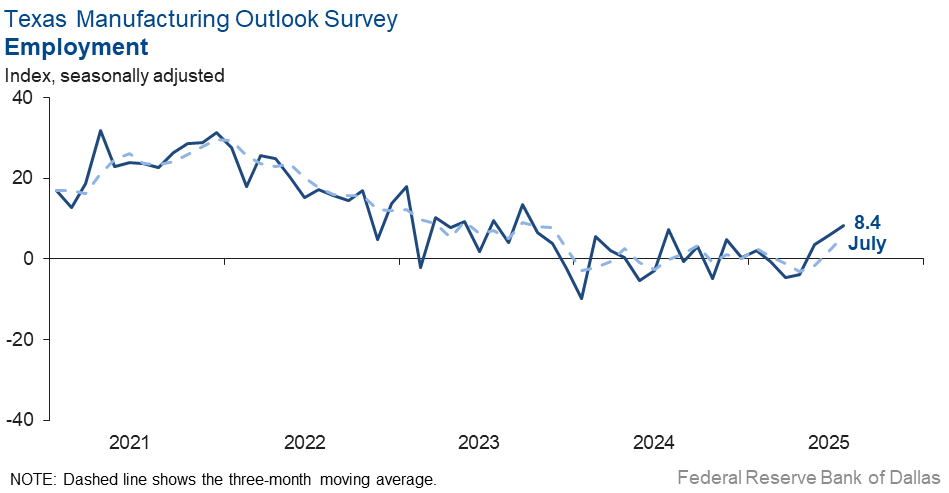
Labor market measures suggested an increase in employment and work hours. The employment index moved up three points to 8.4, with 17 percent of firms noting net hiring and 9 percent noting net layoffs. The hours worked index climbed 16 points to 7.7, its highest reading in nearly three years.
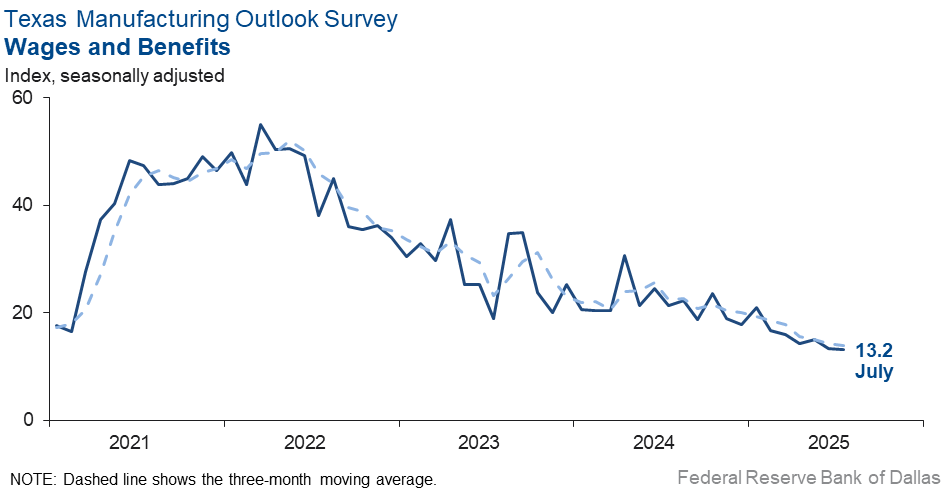
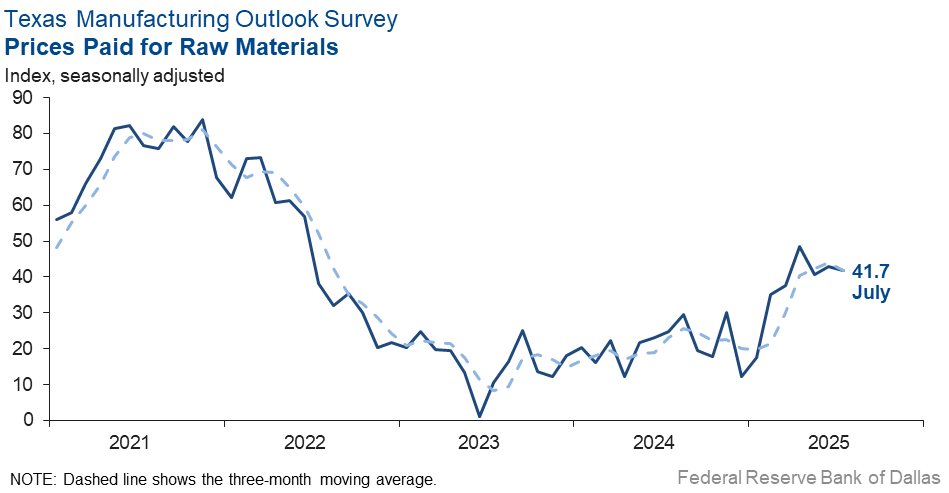
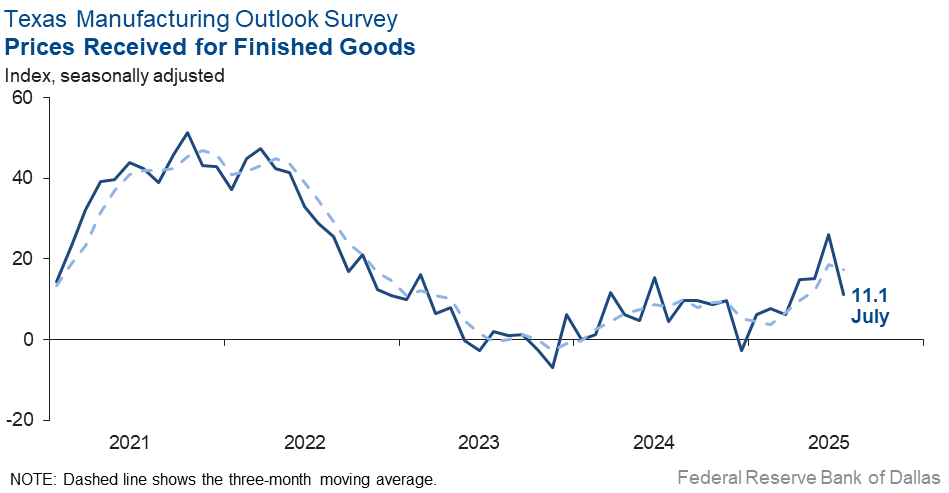
Elevated input price pressures continued in July, while selling price growth eased. The raw materials prices index held fairly steady at 41.7, well above its average reading of 27.4. The finished goods prices index retreated 15 points to 11.1. Meanwhile, the wages and benefits index was unchanged at 13.2.
Expectations for manufacturing activity six months from now improved. The future production index rose eight points to 30.3, while the future general business activity index rose five points to 19.0. Most other indexes of future manufacturing activity also increased, though some remain below their average readings.
Next release: Monday, August 25
Data were collected July 15–23, and 81 of the 117 Texas manufacturers surveyed submitted responses. The Dallas Fed conducts the Texas Manufacturing Outlook Survey monthly to obtain a timely assessment of the state’s factory activity. Firms are asked whether output, employment, orders, prices and other indicators increased, decreased or remained unchanged over the previous month.
Survey responses are used to calculate an index for each indicator. Each index is calculated by subtracting the percentage of respondents reporting a decrease from the percentage reporting an increase. When the share of firms reporting an increase exceeds the share reporting a decrease, the index will be greater than zero, suggesting the indicator has increased over the prior month. If the share of firms reporting a decrease exceeds the share reporting an increase, the index will be below zero, suggesting the indicator has decreased over the prior month. An index will be zero when the number of firms reporting an increase is equal to the number of firms reporting a decrease. Data have been seasonally adjusted as necessary.
Results summary
Historical data are available from June 2004 to the most current release month.
| Business Indicators Relating to Facilities and Products in Texas Current (versus previous month) | ||||||||
| Indicator | Jul Index | Jun Index | Change | Series Average | Trend* | % Reporting Increase | % Reporting No Change | % Reporting Decrease |
Production | 21.3 | 1.3 | +20.0 | 9.6 | 5(+) | 35.2 | 50.9 | 13.9 |
Capacity Utilization | 17.3 | –1.0 | +18.3 | 7.4 | 1(+) | 30.8 | 55.7 | 13.5 |
New Orders | –3.6 | –7.3 | +3.7 | 4.7 | 6(–) | 24.3 | 47.7 | 27.9 |
Growth Rate of Orders | –9.1 | –17.2 | +8.1 | –1.1 | 6(–) | 16.3 | 58.3 | 25.4 |
Unfilled Orders | –12.0 | –12.1 | +0.1 | –2.6 | 11(–) | 7.0 | 74.0 | 19.0 |
Shipments | 2.7 | –7.3 | +10.0 | 7.8 | 1(+) | 28.4 | 46.0 | 25.7 |
Delivery Time | –7.8 | –7.9 | +0.1 | 0.6 | 4(–) | 7.6 | 77.0 | 15.4 |
Finished Goods Inventories | –11.2 | –11.3 | +0.1 | –3.2 | 3(–) | 8.6 | 71.6 | 19.8 |
Prices Paid for Raw Materials | 41.7 | 43.0 | –1.3 | 27.4 | 63(+) | 42.3 | 57.1 | 0.6 |
Prices Received for Finished Goods | 11.1 | 26.1 | –15.0 | 8.7 | 7(+) | 15.8 | 79.5 | 4.7 |
Wages and Benefits | 13.2 | 13.4 | –0.2 | 21.1 | 63(+) | 16.0 | 81.2 | 2.8 |
Employment | 8.4 | 5.7 | +2.7 | 7.3 | 3(+) | 17.4 | 73.6 | 9.0 |
Hours Worked | 7.7 | –8.4 | +16.1 | 3.0 | 1(+) | 15.9 | 75.9 | 8.2 |
Capital Expenditures | 6.8 | 10.9 | –4.1 | 6.6 | 3(+) | 19.9 | 67.0 | 13.1 |
| General Business Conditions Current (versus previous month) | ||||||||
| Indicator | Jul Index | Jun Index | Change | Series Average | Trend** | % Reporting Improved | % Reporting No Change | % Reporting Worsened |
Company Outlook | 4.7 | –8.9 | +13.6 | 4.3 | 1(+) | 25.5 | 53.7 | 20.8 |
General Business Activity | 0.9 | –12.7 | +13.6 | 0.4 | 1(+) | 22.1 | 56.7 | 21.2 |
| Indicator | Jul Index | Jun Index | Change | Series Average | Trend* | % Reporting Increase | % Reporting No Change | % Reporting Decrease |
Outlook Uncertainty | 11.2 | 15.2 | –4.0 | 17.2 | 51(+) | 27.5 | 56.3 | 16.3 |
| Business Indicators Relating to Facilities and Products in Texas Future (six months ahead) | ||||||||
| Indicator | Jul Index | Jun Index | Change | Series Average | Trend* | % Reporting Increase | % Reporting No Change | % Reporting Decrease |
Production | 30.3 | 22.6 | +7.7 | 36.1 | 63(+) | 45.0 | 40.2 | 14.7 |
Capacity Utilization | 27.8 | 20.8 | +7.0 | 33.0 | 63(+) | 42.5 | 42.8 | 14.7 |
New Orders | 23.7 | 22.8 | +0.9 | 33.5 | 33(+) | 40.8 | 42.1 | 17.1 |
Growth Rate of Orders | 18.8 | 15.3 | +3.5 | 24.8 | 26(+) | 33.7 | 51.4 | 14.9 |
Unfilled Orders | –4.2 | –6.9 | +2.7 | 2.7 | 6(–) | 7.0 | 81.8 | 11.2 |
Shipments | 21.0 | 27.3 | –6.3 | 34.5 | 63(+) | 39.6 | 41.8 | 18.6 |
Delivery Time | –5.6 | –0.5 | –5.1 | –1.4 | 5(–) | 9.2 | 76.0 | 14.8 |
Finished Goods Inventories | –5.4 | –2.6 | –2.8 | –0.2 | 5(–) | 10.8 | 73.0 | 16.2 |
Prices Paid for Raw Materials | 47.7 | 39.9 | +7.8 | 33.6 | 64(+) | 51.8 | 44.1 | 4.1 |
Prices Received for Finished Goods | 43.2 | 27.3 | +15.9 | 21.2 | 63(+) | 45.9 | 51.4 | 2.7 |
Wages and Benefits | 37.2 | 32.1 | +5.1 | 39.1 | 63(+) | 38.3 | 60.6 | 1.1 |
Employment | 27.3 | 15.4 | +11.9 | 22.8 | 62(+) | 34.8 | 57.7 | 7.5 |
Hours Worked | 8.5 | –4.5 | +13.0 | 8.7 | 1(+) | 17.0 | 74.5 | 8.5 |
Capital Expenditures | 15.5 | 16.9 | –1.4 | 19.4 | 62(+) | 27.4 | 60.7 | 11.9 |
| General Business Conditions Future (six months ahead) | ||||||||
| Indicator | Jul Index | Jun Index | Change | Series Average | Trend** | % Reporting Increase | % Reporting No Change | % Reporting Worsened |
Company Outlook | 21.6 | 16.4 | +5.2 | 18.3 | 3(+) | 34.1 | 53.4 | 12.5 |
General Business Activity | 19.0 | 14.4 | +4.6 | 12.3 | 3(+) | 35.1 | 48.8 | 16.1 |
*Shown is the number of consecutive months of expansion or contraction in the underlying indicator. Expansion is indicated by a positive index reading and denoted by a (+) in the table. Contraction is indicated by a negative index reading and denoted by a (–) in the table.
**Shown is the number of consecutive months of improvement or worsening in the underlying indicator. Improvement is indicated by a positive index reading and denoted by a (+) in the table. Worsening is indicated by a negative index reading and denoted by a (–) in the table.
Data have been seasonally adjusted as necessary.
Comments from survey respondents
Survey participants are given the opportunity to submit comments on current issues that may be affecting their businesses. Some comments have been edited for grammar and clarity.
- Construction and automotive continue to have severe declines, leading to major impacts on the basic materials markets.
- Please lower interest rates now, like other countries are doing.
- The impact of DOGE [Department of Government Efficiency], early retirements and tariff uncertainty have caused consumers to be cautious and delay purchasing.
- There is a significant slowdown in the progression status of new projects. Pricing competition has seemed to decrease.
- We expect steady demand and production through September, then declining in the fourth quarter. Tariff costs are expected to continue increasing production material costs.
- Recent tariff announcements to countries where we purchase raw materials and packaging supplies will strain our operations and result in price increases, potentially leading to decreased demand.
- Demand has been soft all summer. Our outlook has dimmed recently, with the volume of new orders declining. New business has been tougher to convert.
- I feel a little better now regarding geopolitical issues than in June. I am still a little concerned and worried but not as much as in June.
- DOGE, opaque government policy and stagflation [are issues of concern].
- Tariff changes require a sit back and watch attitude. There is no way to forecast.
- We are starting to see orders roll in at a much higher rate than we have in previous months.
- In many respects, we seem to be kicking the same can down the same proverbial road, but I, personally, feel like I see the light at the end of the tunnel. My team disagrees with me in some respects, but we're all hopeful that the fourth quarter and into 2026 will bring to fruition what we had expected to occur already by now.
- We build machines (capital equipment) in five segments: oil and gas, defense, marine, hydropower and nuclear power. All of these segments are spending money, and the vibe is positive.
- Tariffs [are an issue of concern].
- Tariff impacts continue to hurt our overall business and profitability.
- Tariffs. Tariffs. Tariffs. Did I mention Tariffs?
- Business is maintained at a reduced level that has our outlook somewhat negative.
- Our industry is closely tied to the building and construction market, which remains softer than in previous years. The transportation industry, particularly for trailer manufacturing, is down significantly. Building and construction and transportation are the two largest markets for our products. However, that downturn is being partially offset by the ongoing trend of onshoring manufactured goods, driven largely by tariffs. One major challenge in recent years has been Mexico’s exemption from Section 232 tariffs, which created a significant disadvantage for U.S. manufacturers in our markets. With that exemption now lifted, we’re seeing a more level playing field. This change should benefit our industry, particularly as China had been setting up operations in Mexico to bypass tariffs and enter the U.S. market tariff-free. Fair trade is critical, and the enforcement of tariffs like Section 232 is a step in the right direction for protecting and strengthening U.S. manufacturing.
- Capital is being spent to add product offerings to increase business activity
- The tariff matters continue to cause major uncertainty. It is impossible to plan. It is causing uncertainty throughout the supply chain.
- If not for a few large jobs, we would be very slow and laying off workers. Things, however, have picked up the last few weeks with lots more quote activity and orders being entered. I still feel all the chaos and uncertainty over tariffs are having a very negative effect on demand in our market. I am hopeful it will improve six months from now.
- We are starting to see vendors and suppliers pass on more price increases, with "tariffs" being the explanation. We are weighing our options for passing this price increase on to our buyers, eating the additional cost/reducing our margin, or a combination of the two.
- We are implementing layoffs and reduced working hours in August.
Historical Data
Historical data can be downloaded dating back to June 2004.
Indexes
Download indexes for all indicators. For the definitions of all variables, see Data Definitions.
| Unadjusted |
| Seasonally adjusted |
All Data
Download indexes and components of the indexes (percentage of respondents reporting increase, decrease, or no change). For the definitions of all variables, see Data Definitions.
| Unadjusted |
| Seasonally adjusted |
Special questions
For this month’s survey, Texas business executives were asked supplemental questions on labor market conditions. Results below include responses from participants of all three surveys: Texas Manufacturing Outlook Survey, Texas Service Sector Outlook Survey and Texas Retail Outlook Survey. View individual survey results.
Questions regarding the Texas Business Outlook Surveys can be addressed to Jesus Cañas at jesus.canas@dal.frb.org.
Sign up for our email alert to be automatically notified as soon as the latest Texas Manufacturing Outlook Survey is released on the web.