Texas Manufacturing Outlook Survey

Texas Manufacturing Expansion Continues, Though Outlooks Weaken Slightly
For this month’s survey, Texas business executives were asked supplemental questions on labor market conditions and remote work. Results for these questions from the Texas Manufacturing Outlook Survey, Texas Service Sector Outlook Survey and Texas Retail Outlook Survey have been released together. Read the special questions results.
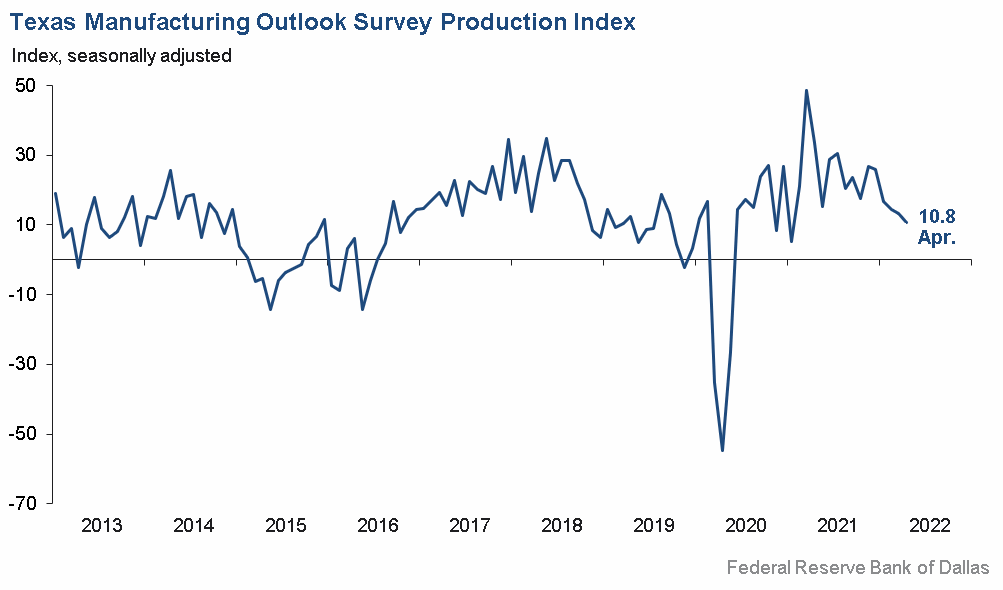
Texas factory activity expanded at a moderate pace in April, according to business executives responding to the Texas Manufacturing Outlook Survey. The production index, a key measure of state manufacturing conditions, ticked down two points to 10.8, a reading in line with the index’s average.
Other measures of manufacturing activity continued to signal solid expansion. The new orders index inched up to 12.1, while the growth rate of orders index held steady at 13.0. The capacity utilization index was unchanged at 14.3, and the shipments index pushed up five points to 11.8.
Perceptions of broader business conditions were a bit mixed in April. The general business activity index retreated eight points to a still-positive reading of 1.1 this month. The company outlook index slipped to -5.5, its lowest reading in two years. The outlook uncertainty index pushed up from 20.5 to 29.8.
Labor market measures indicated robust employment growth and longer workweeks. The employment index held at its highly elevated reading of 24.6. Thirty-four percent of firms noted net hiring, while 10 percent noted net layoffs. The hours worked index edged down to 11.3.
Prices and wages continued to increase strongly in April, though the indexes eased off their historical highs. The raw materials prices index fell 13 points to 61.5—its lowest reading in more than a year, though still well above its average of 27.7. The finished goods prices index moved down from 47.8 to 43.5. The wages and benefits index came in at 50.9, down slightly from its high last month of 55.2 but still markedly elevated from its average reading of 20.1.
Expectations regarding future manufacturing activity generally eased but remained positive. The future production index fell from 40.1 to 34.7, and the future general business activity index retreated six points to 1.8. Other measures of future manufacturing activity such as capital expenditures and employment showed mixed movements but remained solidly in positive territory.
Next release: Tuesday, May 31
Data were collected April 12–20, and 94 Texas manufacturers responded to the survey. The Dallas Fed conducts the Texas Manufacturing Outlook Survey monthly to obtain a timely assessment of the state’s factory activity. Firms are asked whether output, employment, orders, prices and other indicators increased, decreased or remained unchanged over the previous month.
Survey responses are used to calculate an index for each indicator. Each index is calculated by subtracting the percentage of respondents reporting a decrease from the percentage reporting an increase. When the share of firms reporting an increase exceeds the share reporting a decrease, the index will be greater than zero, suggesting the indicator has increased over the prior month. If the share of firms reporting a decrease exceeds the share reporting an increase, the index will be below zero, suggesting the indicator has decreased over the prior month. An index will be zero when the number of firms reporting an increase is equal to the number of firms reporting a decrease. Data have been seasonally adjusted as necessary.
Results Summary
Historical data are available from June 2004 to the most current release month.
| Business Indicators Relating to Facilities and Products in Texas Current (versus previous month) | ||||||||
| Indicator | Apr Index | Mar Index | Change | Series Average | Trend* | % Reporting Increase | % Reporting No Change | % Reporting Decrease |
Production | 10.8 | 13.2 | –2.4 | 10.9 | 23(+) | 29.9 | 51.0 | 19.1 |
Capacity Utilization | 14.3 | 15.1 | –0.8 | 8.7 | 23(+) | 33.4 | 47.5 | 19.1 |
New Orders | 12.1 | 10.5 | +1.6 | 7.0 | 23(+) | 29.6 | 52.9 | 17.5 |
Growth Rate of Orders | 13.0 | 13.7 | –0.7 | 0.9 | 22(+) | 25.0 | 63.0 | 12.0 |
Unfilled Orders | 10.5 | 12.4 | –1.9 | –1.4 | 22(+) | 25.6 | 59.3 | 15.1 |
Shipments | 11.8 | 7.0 | +4.8 | 9.7 | 23(+) | 32.3 | 47.3 | 20.5 |
Delivery Time | 21.2 | 23.2 | –2.0 | 1.3 | 22(+) | 30.8 | 59.6 | 9.6 |
Finished Goods Inventories | –3.3 | 2.3 | –5.6 | –3.4 | 1(–) | 16.1 | 64.5 | 19.4 |
Prices Paid for Raw Materials | 61.5 | 74.0 | –12.5 | 27.7 | 24(+) | 67.2 | 27.1 | 5.7 |
Prices Received for Finished Goods | 43.5 | 47.8 | –4.3 | 8.4 | 21(+) | 46.9 | 49.7 | 3.4 |
Wages and Benefits | 50.9 | 55.2 | –4.3 | 20.1 | 24(+) | 50.9 | 49.1 | 0.0 |
Employment | 24.6 | 25.5 | –0.9 | 7.6 | 22(+) | 34.3 | 56.0 | 9.7 |
Hours Worked | 11.3 | 15.4 | –4.1 | 3.7 | 22(+) | 22.1 | 67.1 | 10.8 |
Capital Expenditures | 19.0 | 19.5 | –0.5 | 6.9 | 21(+) | 27.7 | 63.6 | 8.7 |
| General Business Conditions Current (versus previous month) | ||||||||
| Indicator | Apr Index | Mar Index | Change | Series Average | Trend** | % Reporting Improved | % Reporting No Change | % Reporting Worsened |
Company Outlook | –5.5 | –0.7 | –4.8 | 6.8 | 2(–) | 15.8 | 62.9 | 21.3 |
General Business Activity | 1.1 | 8.7 | –7.6 | 3.1 | 21(+) | 19.5 | 62.1 | 18.4 |
| Indicator | Apr Index | Mar Index | Change | Series Average | Trend* | % Reporting Increase | % Reporting No Change | % Reporting Decrease |
Outlook Uncertainty† | 29.8 | 20.5 | +9.3 | 14.7 | 12(+) | 39.4 | 51.1 | 9.6 |
| Business Indicators Relating to Facilities and Products in Texas Future (six months ahead) | ||||||||
| Indicator | Apr Index | Mar Index | Change | Series Average | Trend* | % Reporting Increase | % Reporting No Change | % Reporting Decrease |
Production | 34.7 | 40.1 | –5.4 | 38.7 | 24(+) | 44.5 | 45.8 | 9.8 |
Capacity Utilization | 33.0 | 35.6 | –2.6 | 35.5 | 24(+) | 40.5 | 52.0 | 7.5 |
New Orders | 16.2 | 39.6 | –23.4 | 36.2 | 24(+) | 30.3 | 55.6 | 14.1 |
Growth Rate of Orders | 12.1 | 30.1 | –18.0 | 26.9 | 24(+) | 28.4 | 55.3 | 16.3 |
Unfilled Orders | 4.3 | 4.2 | +0.1 | 3.8 | 2(+) | 18.1 | 68.1 | 13.8 |
Shipments | 28.2 | 38.2 | –10.0 | 37.1 | 24(+) | 40.5 | 47.2 | 12.3 |
Delivery Time | 1.5 | 8.5 | –7.0 | –1.1 | 8(+) | 21.1 | 59.2 | 19.6 |
Finished Goods Inventories | 9.1 | 7.5 | +1.6 | 0.5 | 18(+) | 20.5 | 68.2 | 11.4 |
Prices Paid for Raw Materials | 51.1 | 58.0 | –6.9 | 34.8 | 25(+) | 59.1 | 33.0 | 8.0 |
Prices Received for Finished Goods | 46.5 | 59.2 | –12.7 | 21.0 | 24(+) | 53.5 | 39.5 | 7.0 |
Wages and Benefits | 58.5 | 64.8 | –6.3 | 39.0 | 24(+) | 58.5 | 41.5 | 0.0 |
Employment | 38.7 | 38.0 | +0.7 | 23.3 | 23(+) | 43.7 | 51.3 | 5.0 |
Hours Worked | 13.8 | 16.1 | –2.3 | 9.5 | 24(+) | 19.1 | 75.6 | 5.3 |
Capital Expenditures | 21.8 | 35.8 | –14.0 | 20.1 | 23(+) | 33.0 | 55.8 | 11.2 |
| General Business Conditions Future (six months ahead) | ||||||||
| Indicator | Apr Index | Mar Index | Change | Series Average | Trend** | % Reporting Increase | % Reporting No Change | % Reporting Worsened |
Company Outlook | 7.6 | 10.4 | –2.8 | 20.5 | 23(+) | 25.2 | 57.2 | 17.6 |
General Business Activity | 1.8 | 8.2 | –6.4 | 14.7 | 23(+) | 21.5 | 58.8 | 19.7 |
*Shown is the number of consecutive months of expansion or contraction in the underlying indicator. Expansion is indicated by a positive index reading and denoted by a (+) in the table. Contraction is indicated by a negative index reading and denoted by a (–) in the table.
**Shown is the number of consecutive months of improvement or worsening in the underlying indicator. Improvement is indicated by a positive index reading and denoted by a (+) in the table. Worsening is indicated by a negative index reading and denoted by a (–) in the table.
†Added to survey in January 2018.
Data have been seasonally adjusted as necessary, with the exception of the outlook uncertainty index, which does not yet have a sufficiently long time series to test for seasonality.
Production Index
Comments from Survey Respondents
These comments are from respondents’ completed surveys and have been edited for publication.
- Continued increases in costs are still being passed on, but we are encountering resistance.
- The Russia–Ukraine war is impacting raw material pricing and availability and further creating supply-chain issues throughout the industry. Logistics in the U.S. are backed up, creating longer lead times for receipt and shipment of materials. Prices continue to increase on feedstocks, and the labor market remains very constrained for resources with inflation hitting us at every key financial indicator.
- Our industry continues to have more demand than current supply levels. Some of the shortfall is now being filled by Mexico, who has a distinct pricing advantage over U.S. producers due to Section 232 tariffs. Our industry needs Section 232 tariffs on aluminum to be eliminated.
- The supply chain is in chaos right now. Everything is continually increasing. Suppliers struggle to get material from their suppliers. They struggle to get the personnel necessary to run production. Something has to give. These continual increases, which are almost monthly, are not sustainable.
- Requests for quotations have remained constant, but projects on hold have increased.
- Competition has decreased overall, but we see it increasing over the next six months. Political leaders are confusing the oil industry from day to day. They’re not willing to commit to the oil industry that they are an important part of our economy and will be for decades ahead without beating them up at the same time. Our country needs oil now and for the long run because we are an economy that runs on many types of energy, and the sooner this political group understands this, the better off our country will be.
- Our main challenge is finding 316 stainless steel and affording the price, along with electronic components.
- We are currently running near capacity; however, we are anticipating a downturn for the second half of the year.
- Out-of-control material costs and the inability to hire are causing inflationary price increases and extended production time, respectively.
- Supply chain, supply chain, supply chain.
- We continue to have issues sourcing parts for printed circuit boards and have extended lead times, sometimes stopping our production altogether.
- Demand continues to outstrip our ability to supply.
- We build vehicles for first responders, and in spite of having a record order backlog, we have frozen hiring and slashed spending and future investments to conserve cash because we cannot get the truck chassis we need due to supply-chain constraints. This is leading to increased prices and unacceptably long order lead times for our customers, with no clear visibility to when the situation will improve.
- Our plans and trend line have been favorable, but with much uncertainty in the economy we have adopted a position of caution and cut back capital spending.
- Inflation and the supply chain [are issues affecting our business].
- We are fortunate that our products do not contain either wheat or corn. Semi-skilled labor is hard to find.
- Labor shortage! Need a job?
- It seems the supply-chain issues have eased a little, but hiring, training and retaining qualified employees continue to be a challenge.
- There is an expected pullback in economic activity ahead; we do not believe it will be a “soft landing.”
- In the manufacturing business, we continue to struggle with high absenteeism and an inability to get talent of virtually any skill level in the door. Wages we pay are $15 per hour for no skills and up to $35 per hour for skilled levels. Our average paid rate is over $27 per hour. We run 24/7, and our biggest problem is finding people to fill night-shift positions. Order volumes are very strong, but our backlog continues to grow due to an inability to man the equipment. Demand for flexible packaging is very strong, and raw material prices are surging due to oil/gas price surges. This is also fed by increases from offshore and Mexican/South American suppliers who are dealing with higher transportation costs. Times are tough, as we are constantly having to scramble to meet an unending series of roadblocks. Capital purchases have lead times that are unheard of, and I have been in the business over 50 years.
- The Finnish paper workers’ strike continues, and with it comes the increased threat that there will be insufficient packaging with which we can transport food.
- We are so much busier six months into our fiscal than the prior year. We do not know what to attribute it to other than our customers need us more, and that is because it seems overall business activity is very much improved. Our incoming orders are almost double compared to the prior year, and we are now in our seventh month of this fiscal year.
Historical Data
Historical data can be downloaded dating back to June 2004.
Indexes
Download indexes for all indicators. For the definitions of all variables, see Data Definitions.
| Unadjusted |
| Seasonally adjusted |
All Data
Download indexes and components of the indexes (percentage of respondents reporting increase, decrease, or no change). For the definitions of all variables, see Data Definitions.
| Unadjusted |
| Seasonally adjusted |
Questions regarding the Texas Manufacturing Outlook Survey can be addressed to Emily Kerr at emily.kerr@dal.frb.org.
Sign up for our email alert to be automatically notified as soon as the latest Texas Manufacturing Outlook Survey is released on the web.