Texas Manufacturing Outlook Survey

Texas Manufacturing Growth Picks Up, but Some Weaknesses Emerge
For this month’s survey, Texas business executives were asked supplemental questions on supply-chain disruptions and costs. Results for these questions from the Texas Manufacturing Outlook Survey, Texas Service Sector Outlook Survey and Texas Retail Outlook Survey have been released together. Read the special questions results.
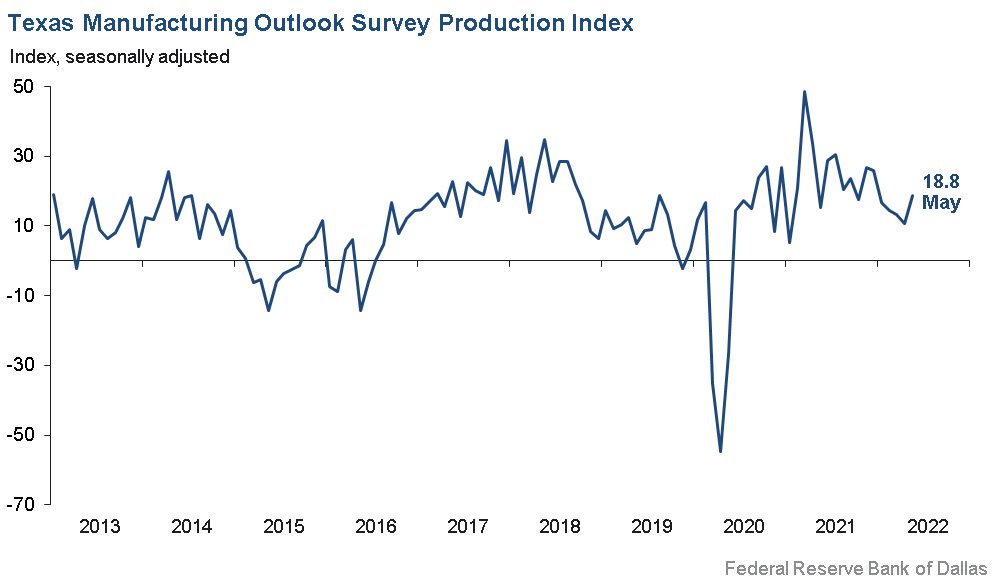
Texas factory activity expanded at a fairly robust pace in May, according to business executives responding to the Texas Manufacturing Outlook Survey. The production index, a key measure of state manufacturing conditions, rose from 10.8 to 18.8, signaling an acceleration in growth from April.
Other measures of manufacturing activity showed mixed movements. While the capacity utilization and shipments indexes moved up—to 19.8 and 13.1, respectively—the survey’s demand indicators retreated. The new orders index fell nine points to 3.2, and the growth rate of orders index plummeted 18 points and turned negative at -5.3. Both readings mark their lowest levels in about two years.
Perceptions of broader business conditions worsened in May. The general business activity index retreated eight points to -7.3, entering negative territory for the first time since July 2020 in the wake of the pandemic’s initial onset. The company outlook index pushed further negative from -5.5 to -10.0. The outlook uncertainty index remained elevated at 26.5.
Labor market measures indicated robust employment growth and longer workweeks. The employment index edged down four points to 20.9 but remained highly elevated. Thirty-one percent of firms noted net hiring, while 11 percent noted net layoffs. The hours worked index also remained elevated but edged down to 7.4.
Prices and wages continued to increase strongly in May. The raw materials prices index held steady at 61.8—more than twice its average of 27.8. The finished goods prices index was also largely unchanged at a highly elevated reading of 41.8. The wages and benefits index came in at 50.5, similar to April and markedly higher than its 20.2 average.
Expectations regarding future manufacturing were mixed but generally less optimistic than in April. The future production index remained positive but fell from 34.7 to 19.9, a reading now well below average. The future general business activity index fell eight points to -6.5, entering negative territory for the first time in two years. Other measures of future manufacturing activity showed mixed movements but remained solidly in positive territory.
Next release: Monday, June 27
Data were collected May 17–25, and 87 Texas manufacturers responded to the survey. The Dallas Fed conducts the Texas Manufacturing Outlook Survey monthly to obtain a timely assessment of the state’s factory activity. Firms are asked whether output, employment, orders, prices and other indicators increased, decreased or remained unchanged over the previous month.
Survey responses are used to calculate an index for each indicator. Each index is calculated by subtracting the percentage of respondents reporting a decrease from the percentage reporting an increase. When the share of firms reporting an increase exceeds the share reporting a decrease, the index will be greater than zero, suggesting the indicator has increased over the prior month. If the share of firms reporting a decrease exceeds the share reporting an increase, the index will be below zero, suggesting the indicator has decreased over the prior month. An index will be zero when the number of firms reporting an increase is equal to the number of firms reporting a decrease. Data have been seasonally adjusted as necessary.
Results Summary
Historical data are available from June 2004 to the most current release month.
| Business Indicators Relating to Facilities and Products in Texas Current (versus previous month) | ||||||||
| Indicator | May Index | Apr Index | Change | Series Average | Trend* | % Reporting Increase | % Reporting No Change | % Reporting Decrease |
Production | 18.8 | 10.8 | +8.0 | 11.0 | 24(+) | 33.8 | 51.2 | 15.0 |
Capacity Utilization | 19.8 | 14.3 | +5.5 | 8.8 | 24(+) | 32.1 | 55.6 | 12.3 |
New Orders | 3.2 | 12.1 | –8.9 | 7.0 | 24(+) | 27.8 | 47.6 | 24.6 |
Growth Rate of Orders | –5.3 | 13.0 | –18.3 | 0.9 | 1(–) | 23.2 | 48.3 | 28.5 |
Unfilled Orders | 4.1 | 10.5 | –6.4 | –1.4 | 23(+) | 18.4 | 67.3 | 14.3 |
Shipments | 13.1 | 11.8 | +1.3 | 9.7 | 24(+) | 29.0 | 55.1 | 15.9 |
Delivery Time | 4.3 | 21.2 | –16.9 | 1.3 | 23(+) | 18.6 | 67.1 | 14.3 |
Finished Goods Inventories | 9.2 | –3.3 | +12.5 | –3.4 | 1(+) | 23.0 | 63.2 | 13.8 |
Prices Paid for Raw Materials | 61.8 | 61.5 | +0.3 | 27.8 | 25(+) | 69.2 | 23.4 | 7.4 |
Prices Received for Finished Goods | 41.8 | 43.5 | –1.7 | 8.6 | 22(+) | 48.6 | 44.6 | 6.8 |
Wages and Benefits | 50.5 | 50.9 | –0.4 | 20.2 | 25(+) | 50.5 | 49.5 | 0.0 |
Employment | 20.9 | 24.6 | –3.7 | 7.7 | 23(+) | 31.4 | 58.1 | 10.5 |
Hours Worked | 7.4 | 11.3 | –3.9 | 3.7 | 23(+) | 17.8 | 71.8 | 10.4 |
Capital Expenditures | 9.2 | 19.0 | –9.8 | 6.9 | 22(+) | 18.5 | 72.2 | 9.3 |
| General Business Conditions Current (versus previous month) | ||||||||
| Indicator | May Index | Apr Index | Change | Series Average | Trend** | % Reporting Improved | % Reporting No Change | % Reporting Worsened |
Company Outlook | –10.0 | –5.5 | –4.5 | 6.7 | 3(–) | 11.0 | 68.0 | 21.0 |
General Business Activity | –7.3 | 1.1 | –8.4 | 3.1 | 1(–) | 14.5 | 63.7 | 21.8 |
| Indicator | May Index | Apr Index | Change | Series Average | Trend* | % Reporting Increase | % Reporting No Change | % Reporting Decrease |
Outlook Uncertainty† | 26.5 | 29.8 | –3.3 | 14.9 | 13(+) | 34.5 | 57.5 | 8.0 |
| Business Indicators Relating to Facilities and Products in Texas Future (six months ahead) | ||||||||
| Indicator | May Index | Apr Index | Change | Series Average | Trend* | % Reporting Increase | % Reporting No Change | % Reporting Decrease |
Production | 19.9 | 34.7 | –14.8 | 38.6 | 25(+) | 33.5 | 52.9 | 13.6 |
Capacity Utilization | 22.7 | 33.0 | –10.3 | 35.4 | 25(+) | 33.0 | 56.7 | 10.3 |
New Orders | 16.6 | 16.2 | +0.4 | 36.1 | 25(+) | 27.5 | 61.6 | 10.9 |
Growth Rate of Orders | 13.3 | 12.1 | +1.2 | 26.9 | 25(+) | 24.5 | 64.2 | 11.2 |
Unfilled Orders | 1.6 | 4.3 | –2.7 | 3.8 | 3(+) | 14.8 | 72.0 | 13.2 |
Shipments | 20.3 | 28.2 | –7.9 | 37.0 | 25(+) | 35.4 | 49.6 | 15.1 |
Delivery Time | 1.8 | 1.5 | +0.3 | –1.1 | 9(+) | 19.9 | 62.0 | 18.1 |
Finished Goods Inventories | –1.2 | 9.1 | –10.3 | 0.5 | 1(–) | 18.1 | 62.7 | 19.3 |
Prices Paid for Raw Materials | 47.5 | 51.1 | –3.6 | 34.8 | 26(+) | 57.3 | 32.9 | 9.8 |
Prices Received for Finished Goods | 38.6 | 46.5 | –7.9 | 21.1 | 25(+) | 48.2 | 42.2 | 9.6 |
Wages and Benefits | 62.5 | 58.5 | +4.0 | 39.1 | 25(+) | 62.8 | 36.9 | 0.3 |
Employment | 32.3 | 38.7 | –6.4 | 23.4 | 24(+) | 36.3 | 59.7 | 4.0 |
Hours Worked | 9.0 | 13.8 | –4.8 | 9.5 | 25(+) | 17.3 | 74.4 | 8.3 |
Capital Expenditures | 21.1 | 21.8 | –0.7 | 20.1 | 24(+) | 32.9 | 55.3 | 11.8 |
| General Business Conditions Future (six months ahead) | ||||||||
| Indicator | May Index | Apr Index | Change | Series Average | Trend** | % Reporting Increase | % Reporting No Change | % Reporting Worsened |
Company Outlook | –4.9 | 7.6 | –12.5 | 20.4 | 1(–) | 16.0 | 63.1 | 20.9 |
General Business Activity | –6.5 | 1.8 | –8.3 | 14.6 | 1(–) | 18.5 | 56.5 | 25.0 |
*Shown is the number of consecutive months of expansion or contraction in the underlying indicator. Expansion is indicated by a positive index reading and denoted by a (+) in the table. Contraction is indicated by a negative index reading and denoted by a (–) in the table.
**Shown is the number of consecutive months of improvement or worsening in the underlying indicator. Improvement is indicated by a positive index reading and denoted by a (+) in the table. Worsening is indicated by a negative index reading and denoted by a (–) in the table.
†Added to survey in January 2018.
Data have been seasonally adjusted as necessary, with the exception of the outlook uncertainty index, which does not yet have a sufficiently long time series to test for seasonality.
Production Index
Comments from Survey Respondents
These comments are from respondents’ completed surveys and have been edited for publication.
- We are still concerned about supply-chain issues.
- Inflation hurts us in many ways. Our costs go up and our customer sales/revenues go down.
- Aluminum billet and ingot, our raw material, has become available and actually plentiful. Aluminum had been tight all year and last year. Our inventory is too large, so we called our competitors and tried to sell some excess. No one wanted to buy unless at a big discount. Things are slowing down.
- We are seeing more competition from Mexico. Section 232 tariffs give Mexican manufacturers of our [same] products a huge advantage since they do not have to pay the tariff. This will need to be addressed at some point in the future.
- The inflation impact on new building growth is a concern, and tight labor is secondary.
- High fuel prices hurt our business.
- Finally, with oil companies making money, we are benefiting also. Projects are increasing and so are the bids that we are quoting. We believe that after years of us decreasing our bids, the industry has turned around. We look forward to a good couple of years of growth and hopefully profitability.
- We are starting to see business slow down, with no clear indication on what we should expect going forward. This situation makes planning extremely difficult.
- Economy issues may present some future challenges. More vacations are on the horizon now that COVID fears have died down.
- Demand broadly continues to outstrip supply. We are seeing broad input costs going up. We are easily able to pass on higher costs to customers by increasing prices. We see evidence of broad inventory builds, yet customers continue to be short a few components, or “golden screws.” We know the inventory build will stop at some point, but demand continues to look strong into the foreseeable future.
- We are still seeing issues with components. And we do not know what the lead time will be from time to time.
- We have plenty of demand, but production is constrained by truck chassis availability. We anticipate being able to begin to increase production by October and, therefore, have a more positive outlook for fourth quarter 2022 and beyond.
- There are no positive fundamentals for the intermediate outlook. No confidence in the administration to make improvements in the economy and international relations. The Federal Reserve has no good options at this late date.
- Supply-chain issues may jeopardize our second-semester plans.
- We have seen a softening of demand as the consumer struggles with inflation and the reduction in government payments. We expect this softening to continue, and we will likely invest in additional promotional activities to maintain volume. Our input costs seem to be stabilizing, which will help us offset the higher promotional cost and hopefully maintain margins.
- Our products do not contain corn nor wheat. Our biggest challenge is the lack of a labor pool and a preponderance of administrative staff offerings who will only work remotely.
- We’ve been lucky to see continued sales growth; the growth rate slowed a bit in April but picked back up in May. We are seeing increased inventory and raw materials prices. We increased our pricing in January, so we’re stuck at current levels for a bit (don’t want to increase again within the next 12 months) and hope that things level out. Shipping times from overseas are still long but hopefully easing as port backups are getting worked through. We are going to institute one-time bonuses and potentially a 5 percent wage increase to account for inflation and help with current price shocks. Even though we’ve continued growing, my uncertainty about the future is at an all-time high.
- I don’t want to create a false impression with the “no change” response; we have more business than we can handle and are turning down orders every day.
- The softness has been apparent for three weeks. We are currently running on good orders from six weeks ago. That will run out in approximately two to three weeks. New orders are down from the pace seen earlier this year.
- We have quite a few temps [temporary workers] in now that we do not expect to have in six months. I do not see how business can stay as robust with all the inflationary pressures and global uncertainties that are currently going on, so this is why my feelings for six months from now are somewhat negative.
Historical Data
Historical data can be downloaded dating back to June 2004.
Indexes
Download indexes for all indicators. For the definitions of all variables, see Data Definitions.
| Unadjusted |
| Seasonally adjusted |
All Data
Download indexes and components of the indexes (percentage of respondents reporting increase, decrease, or no change). For the definitions of all variables, see Data Definitions.
| Unadjusted |
| Seasonally adjusted |
Questions regarding the Texas Manufacturing Outlook Survey can be addressed to Emily Kerr at emily.kerr@dal.frb.org.
Sign up for our email alert to be automatically notified as soon as the latest Texas Manufacturing Outlook Survey is released on the web.