Texas Manufacturing Outlook Survey

Modest Growth in Texas Manufacturing Activity Continues
For this month’s survey, Texas business executives were asked supplemental questions on labor market conditions. Results for these questions from the Texas Manufacturing Outlook Survey, Texas Service Sector Outlook Survey and Texas Retail Outlook Survey have been released together. Read the special questions results.
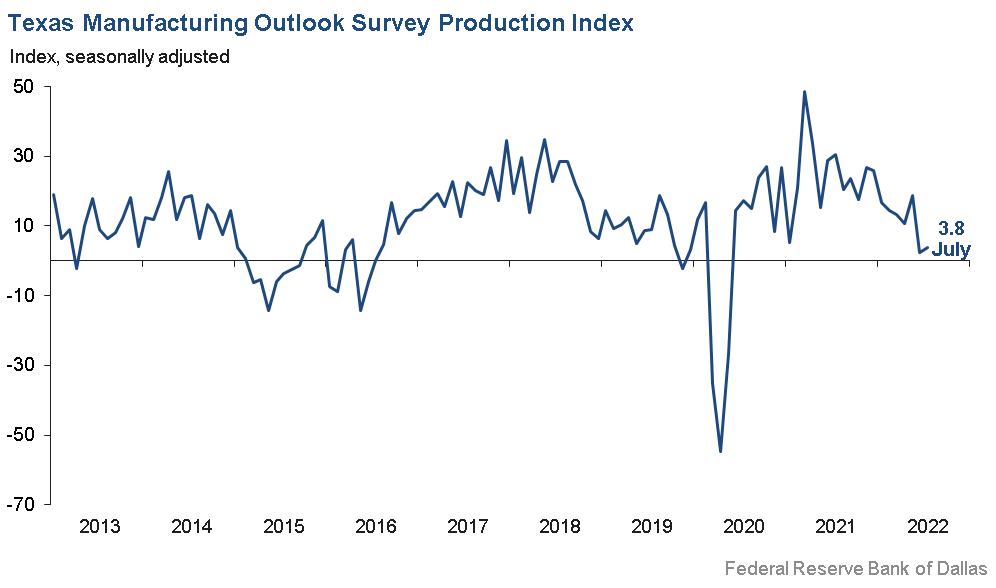
Growth in Texas factory activity continued at a modest pace in July, according to business executives responding to the Texas Manufacturing Outlook Survey. The production index, a key measure of state manufacturing conditions, was largely unchanged at 3.8, a reading well below average but still indicative of growth.
Other measures of manufacturing activity painted a mixed picture again this month. The new orders index remained negative at -9.2, down from -7.3 in June, suggesting a further decrease in demand. The growth rate of orders index also remained negative but edged up to -12.0. The capacity utilization index was unchanged at 3.5, and the shipments index ticked up to 4.3.
Perceptions of broader business conditions worsened in July. The general business activity index declined five points to -22.6. The company outlook index posted a fifth consecutive negative reading but moved up from -20.2 to -10.8. The outlook uncertainty index came off its two-year high of 43.7, falling to 33.7.
Labor market measures continued to indicate robust employment growth and longer workweeks. The employment index moved up three points to 17.9, a reading significantly above its series average of 7.7. Twenty-eight percent of firms noted net hiring, while 10 percent noted net layoffs. The hours worked index also remained above average but edged down from 11.8 to 9.5.
Prices and wages continued to increase but at a more moderate pace. The raw materials prices index fell 19 points to 38.4, a reading still above its average of 28.0 but far below its high of 83.3 last November. The finished goods prices index also moved down, from 33.8 to 29.3, remaining elevated but well below the highs seen last fall. The wages and benefits index came in at 38.1, down 12 points from June but still markedly higher than its 20.4 average.
Expectations regarding future manufacturing activity were mixed. The future production index climbed 10 points to 13.6. The future general business activity index rose eight points but remained negative at -17.7, suggesting that more manufacturers expect worsened activity six months from now than improved. Other measures of future manufacturing activity, like capacity utilization and new orders, pushed further positive in July.
Next release: Monday, August 29
|
Data were collected July 12–20, and 87 Texas manufacturers responded to the survey. The Dallas Fed conducts the Texas Manufacturing Outlook Survey monthly to obtain a timely assessment of the state’s factory activity. Firms are asked whether output, employment, orders, prices and other indicators increased, decreased or remained unchanged over the previous month. Survey responses are used to calculate an index for each indicator. Each index is calculated by subtracting the percentage of respondents reporting a decrease from the percentage reporting an increase. When the share of firms reporting an increase exceeds the share reporting a decrease, the index will be greater than zero, suggesting the indicator has increased over the prior month. If the share of firms reporting a decrease exceeds the share reporting an increase, the index will be below zero, suggesting the indicator has decreased over the prior month. An index will be zero when the number of firms reporting an increase is equal to the number of firms reporting a decrease. Data have been seasonally adjusted as necessary. |
Results Summary
Historical data are available from June 2004 to the most current release month.
| Business Indicators Relating to Facilities and Products in Texas Current (versus previous month) | ||||||||
| Indicator | Jul Index | Jun Index | Change | Series Average | Trend* | % Reporting Increase | % Reporting No Change | % Reporting Decrease |
Production | 3.8 | 2.3 | +1.5 | 10.9 | 26(+) | 23.7 | 56.4 | 19.9 |
Capacity Utilization | 3.5 | 3.3 | +0.2 | 8.7 | 26(+) | 20.9 | 61.7 | 17.4 |
New Orders | –9.2 | –7.3 | –1.9 | 6.8 | 2(–) | 18.7 | 53.4 | 27.9 |
Growth Rate of Orders | –12.0 | –16.2 | +4.2 | 0.7 | 3(–) | 16.4 | 55.2 | 28.4 |
Unfilled Orders | 6.1 | –8.8 | +14.9 | –1.4 | 1(+) | 20.2 | 65.7 | 14.1 |
Shipments | 4.3 | 1.2 | +3.1 | 9.6 | 26(+) | 25.5 | 53.3 | 21.2 |
Delivery Time | 2.3 | 19.9 | –17.6 | 1.4 | 25(+) | 19.1 | 64.1 | 16.8 |
Finished Goods Inventories | 4.7 | 11.2 | –6.5 | –3.2 | 3(+) | 20.0 | 64.7 | 15.3 |
Prices Paid for Raw Materials | 38.4 | 57.5 | –19.1 | 28.0 | 27(+) | 53.1 | 32.2 | 14.7 |
Prices Received for Finished Goods | 29.3 | 33.8 | –4.5 | 8.8 | 24(+) | 34.4 | 60.5 | 5.1 |
Wages and Benefits | 38.1 | 49.9 | –11.8 | 20.4 | 27(+) | 38.5 | 61.1 | 0.4 |
Employment | 17.9 | 15.2 | +2.7 | 7.7 | 25(+) | 27.9 | 62.1 | 10.0 |
Hours Worked | 9.5 | 11.8 | –2.3 | 3.8 | 25(+) | 18.0 | 73.5 | 8.5 |
Capital Expenditures | 4.2 | 5.1 | –0.9 | 6.9 | 24(+) | 20.0 | 64.2 | 15.8 |
| General Business Conditions Current (versus previous month) | ||||||||
| Indicator | Jul Index | Jun Index | Change | Series Average | Trend** | % Reporting Improved | % Reporting No Change | % Reporting Worsened |
Company Outlook | –10.8 | –20.2 | +9.4 | 6.5 | 5(–) | 11.0 | 67.2 | 21.8 |
General Business Activity | –22.6 | –17.7 | –4.9 | 2.9 | 3(–) | 9.0 | 59.4 | 31.6 |
| Indicator | Jul Index | Jun Index | Change | Series Average | Trend* | % Reporting Increase | % Reporting No Change | % Reporting Decrease |
Outlook Uncertainty† | 33.7 | 43.7 | –10.0 | 15.8 | 15(+) | 39.5 | 54.7 | 5.8 |
| Business Indicators Relating to Facilities and Products in Texas Future (six months ahead) | ||||||||
| Indicator | Jul Index | Jun Index | Change | Series Average | Trend* | % Reporting Increase | % Reporting No Change | % Reporting Decrease |
Production | 13.6 | 4.0 | +9.6 | 38.3 | 27(+) | 32.9 | 47.9 | 19.3 |
Capacity Utilization | 13.8 | 4.6 | +9.2 | 35.2 | 27(+) | 32.5 | 48.9 | 18.7 |
New Orders | 3.6 | 0.8 | +2.8 | 35.8 | 27(+) | 26.0 | 51.6 | 22.4 |
Growth Rate of Orders | 2.6 | –6.3 | +8.9 | 26.6 | 1(+) | 22.7 | 57.2 | 20.1 |
Unfilled Orders | –6.3 | –21.4 | +15.1 | 3.6 | 2(–) | 11.4 | 70.9 | 17.7 |
Shipments | 2.6 | 2.5 | +0.1 | 36.7 | 27(+) | 27.6 | 47.3 | 25.0 |
Delivery Time | 2.4 | –17.7 | +20.1 | –1.2 | 1(+) | 18.1 | 66.2 | 15.7 |
Finished Goods Inventories | –5.1 | –8.5 | +3.4 | 0.5 | 3(–) | 12.8 | 69.2 | 17.9 |
Prices Paid for Raw Materials | 20.5 | 33.0 | –12.5 | 34.7 | 28(+) | 39.7 | 41.0 | 19.2 |
Prices Received for Finished Goods | 26.2 | 33.3 | –7.1 | 21.2 | 27(+) | 40.0 | 46.3 | 13.8 |
Wages and Benefits | 48.3 | 60.3 | –12.0 | 39.3 | 27(+) | 51.5 | 45.3 | 3.2 |
Employment | 29.7 | 15.2 | +14.5 | 23.4 | 26(+) | 35.5 | 58.7 | 5.8 |
Hours Worked | 6.4 | 2.0 | +4.4 | 9.4 | 27(+) | 16.2 | 74.0 | 9.8 |
Capital Expenditures | 19.0 | 9.7 | +9.3 | 20.1 | 26(+) | 34.0 | 51.0 | 15.0 |
| General Business Conditions Future (six months ahead) | ||||||||
| Indicator | Jul Index | Jun Index | Change | Series Average | Trend** | % Reporting Increase | % Reporting No Change | % Reporting Worsened |
Company Outlook | –11.8 | –23.5 | +11.7 | 20.1 | 3(–) | 17.0 | 54.2 | 28.8 |
General Business Activity | –17.7 | –26.0 | +8.3 | 14.3 | 3(–) | 12.3 | 57.7 | 30.0 |
*Shown is the number of consecutive months of expansion or contraction in the underlying indicator. Expansion is indicated by a positive index reading and denoted by a (+) in the table. Contraction is indicated by a negative index reading and denoted by a (–) in the table.
**Shown is the number of consecutive months of improvement or worsening in the underlying indicator. Improvement is indicated by a positive index reading and denoted by a (+) in the table. Worsening is indicated by a negative index reading and denoted by a (–) in the table.
†Added to survey in January 2018.
Data have been seasonally adjusted as necessary, with the exception of the outlook uncertainty index, which does not yet have a sufficiently long time series to test for seasonality.
Production Index
Comments from Survey Respondents
These comments are from respondents’ completed surveys and have been edited for publication.
- The concerns of a looming recession have increased over the last month. With supply-chain issues continuing, the cost of raw materials remaining high and significant interest rate hikes, overall business activity has to slow. It is just a matter of when—which I believe is soon.
- Business activity and sales remain solid. Our focus is pushing prices to recover margin.
- We have not seen a reduction in inflation yet.
- The building and construction market customers we supply are seeing a slowdown in activity. We are being negatively affected by Section 232 tariffs. Mexican suppliers purchase their raw material without Section 232 tariffs and now sell in the U.S. under our prices, even with the additional freight cost.
- We are experiencing a temporary increase in business but have a pipeline that is beginning to decline due to inflation's impact on interest rates and slowing construction starts.
- We cannot find the qualified people to expand our output.
- November can't get here fast enough.
- Supply-chain reliability is an issue. We solve one issue, only to see another supplier give us bad news with delays/push outs.
- The volatility of oil prices has stopped the oil companies from spending money once again. Also, the political environment has added uncertainty to the business that did not exist a month ago. President Biden going overseas to beg for more oil supply instead of working with the domestic producers really adds uncertainty to the domestic producers and their budgets. This will affect our plans dramatically for expanding our business.
- We are starting to see weakness in incoming orders. We are preparing for a further slowdown but hoping for the best.
- We are having a hard time getting the electronic components we need to keep running even though demand for production remains high. The limited supply is constraining the business at a new level, resulting in daily shutdowns on various lines, reduced hours for employees and reduced revenue.
- About 20 percent of our backlog was not taken by customers as ordered, but we were able find homes for that product and, therefore, continued to sell almost everything we produced. With incremental capacity coming online, we were able to grow finished-goods inventories a bit. We did see weakness in handsets and personal computers consistent with general commentary with the broader industry. Other markets are mixed; industrial markets continue to have pockets of strength, while others are beginning to show signs of weakness. We are expecting that weakness to begin to spread as we move into the second half of the year. Customer inventories are at record levels, and the lists of “golden screws” continue to shrink. Automotive remains strong for now, but we expect [the auto industry] will be the last to roll over, as they are the worst at supply-chain management.
- Broad-based inflation, together with difficulties in recruiting while our customers’ activity is strong, creates a puzzling and uncertain environment.
- The economy is in shambles. There’s no way out that isn’t bad.
- We are forecasting a slight increase in volume over the next six months due to increased promotional activity with retailers carrying our brand. We recently completed our fiscal year in June and extended an average 10 percent wage/salary increase for our team due to strong results and to help our team members navigate inflation.
- We may benefit from the huge dump of funds into food aid and food destined for food banks. Our situation is unique.
- We can't find people. Period. The supply chain is getting better but is still broken. Freight has risen more than any time in our history.
- Consumer goods demand continues to drop dramatically. I have been forced to temporarily close one production site, permanently terminating the employment of 150 employees. The outlook is grim, and I do not think reopening that site will be possible in the next six months, as client forecasting is very low. Raw materials costs continue to rise, transportation costs continue to rise, and we are having to pass on to our customers consistent price increases week after week. Labor costs are rising on the U.S. side of the border due to employment competition and high turnover rates, with very few labor candidates available for replacement.
- Sales were down last month and have plateaued in July (not decreasing, but not improving). We are hoping to see a pickup as summer travel ends and inflation steadies, but we aren't factoring that into our forecasts. Product costs are steady, and we don't expect to raise prices.
- Inflation, recession and uncertainty over what is going to happen [are issues affecting our business].
- We expect the second half of the year to be a slight reduction from the first half. Employees have been hard to find but, at this point, may not be needed.
- We have gotten stupid busy and will stay this way through July and August. We have some really large jobs coming up, making for hectic times on the plant floor. Additional supply-chain disruptions and longer lead times on materials and supplies are adding to the stress level. We feel some of this is just luck of getting some large jobs that are hitting at same time. Besides these jobs, our normal month-in-and-month-out work seems to have declined in both frequency and volume. We are not sure what this means for the future after these large jobs get processed.
- The labor problem persists. The problem is defined as both inability to find qualified personnel and absenteeism. We are using all available resources to find qualified (trainable and ability to come to work every day) workers.
Historical Data
Historical data can be downloaded dating back to June 2004.
Indexes
Download indexes for all indicators. For the definitions of all variables, see Data Definitions.
| Unadjusted |
| Seasonally adjusted |
All Data
Download indexes and components of the indexes (percentage of respondents reporting increase, decrease, or no change). For the definitions of all variables, see Data Definitions.
| Unadjusted |
| Seasonally adjusted |
Questions regarding the Texas Manufacturing Outlook Survey can be addressed to Emily Kerr at emily.kerr@dal.frb.org.
Sign up for our email alert to be automatically notified as soon as the latest Texas Manufacturing Outlook Survey is released on the web.