Texas Manufacturing Outlook Survey

Texas Manufacturing Activity Flat, Outlooks Continue to Worsen
For this month’s survey, Texas business executives were asked supplemental questions on costs and operating margins. Results for these questions from the Texas Manufacturing Outlook Survey, Texas Service Sector Outlook Survey and Texas Retail Outlook Survey have been released together. Read the special questions results.
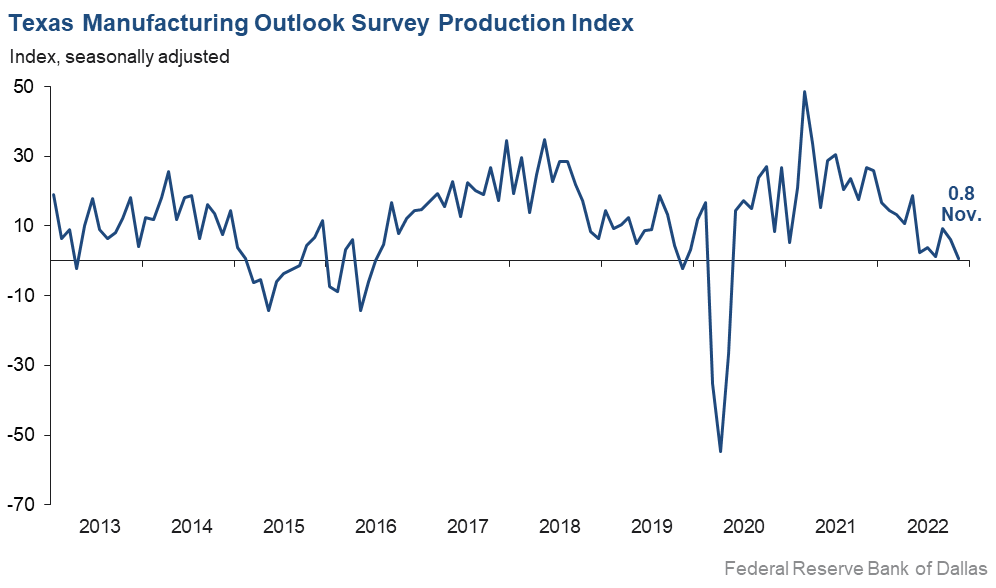
Growth in Texas factory activity abated in November, according to business executives responding to the Texas Manufacturing Outlook Survey. The production index, a key measure of state manufacturing conditions, fell five points to near zero, suggesting little change in output from October.
Other measures of manufacturing activity indicated contraction this month. The new orders index plummeted to -20.9―its sixth month in a row in negative territory and lowest reading since May 2020. The growth rate of orders index dropped seven points to -19.9. The capacity utilization index turned negative, falling from 9.1 to -3.4, and the shipments index posted a second consecutive negative reading at -7.5, down from -1.6 in October.
Perceptions of broader business conditions continued to worsen in November. The general business activity index posted a seventh consecutive negative reading but moved up five points to -14.4. The company outlook index pushed down further, from -9.1 to -15.2. The outlook uncertainty index retreated 18 points to 20.4, still slightly elevated relative to its average reading of 16.6.
Labor market measures pointed to slower employment growth and stable hours worked. The employment index slipped 11 points to 5.9, its lowest reading since mid-2020. Twenty-two percent of firms noted net hiring, while 16 percent noted net layoffs—a notable increase from the 9 percent share noting layoffs the prior two months. The hours worked index remained near zero, suggesting no change.
Price growth eased, while wage growth remained elevated. The raw materials prices index moved down nine points to 22.6, falling below its series average of 28.1 for the first time in more than two years. The finished goods prices index fell eight points to 13.9, still slightly above its series average of 9.0. The wages and benefits index was unchanged at 36.5.
Expectations regarding future manufacturing activity were mixed in November. The future production index remained positive, pushing up six points to 8.9. The future general business activity index remained negative, though it ticked up to -17.5. Most other measures of future manufacturing activity were positive and saw increases in index values this month.
Next release: Tuesday, December 27
Data were collected Nov. 14–22, and 95 Texas manufacturers responded to the survey. The Dallas Fed conducts the Texas Manufacturing Outlook Survey monthly to obtain a timely assessment of the state’s factory activity. Firms are asked whether output, employment, orders, prices and other indicators increased, decreased or remained unchanged over the previous month.
Survey responses are used to calculate an index for each indicator. Each index is calculated by subtracting the percentage of respondents reporting a decrease from the percentage reporting an increase. When the share of firms reporting an increase exceeds the share reporting a decrease, the index will be greater than zero, suggesting the indicator has increased over the prior month. If the share of firms reporting a decrease exceeds the share reporting an increase, the index will be below zero, suggesting the indicator has decreased over the prior month. An index will be zero when the number of firms reporting an increase is equal to the number of firms reporting a decrease. Data have been seasonally adjusted as necessary.
Results Summary
Historical data are available from June 2004 to the most current release month.
| Business Indicators Relating to Facilities and Products in Texas Current (versus previous month) | ||||||||
| Indicator | Nov Index | Oct Index | Change | Series Average | Trend* | % Reporting Increase | % Reporting No Change | % Reporting Decrease |
Production | 0.8 | 6.0 | –5.2 | 10.8 | 30(+) | 20.7 | 59.4 | 19.9 |
Capacity Utilization | –3.4 | 9.1 | –12.5 | 8.7 | 1(–) | 17.8 | 61.0 | 21.2 |
New Orders | –20.9 | –8.8 | –12.1 | 6.5 | 6(–) | 16.1 | 46.8 | 37.0 |
Growth Rate of Orders | –19.9 | –13.2 | –6.7 | 0.5 | 7(–) | 15.7 | 48.7 | 35.6 |
Unfilled Orders | –4.6 | –0.4 | –4.2 | –1.4 | 4(–) | 14.5 | 66.4 | 19.1 |
Shipments | –7.5 | –1.6 | –5.9 | 9.5 | 2(–) | 20.2 | 52.1 | 27.7 |
Delivery Time | –2.8 | 1.5 | –4.3 | 1.4 | 1(–) | 15.4 | 66.4 | 18.2 |
Finished Goods Inventories | 2.2 | –12.6 | +14.8 | –3.2 | 1(+) | 21.3 | 59.6 | 19.1 |
Prices Paid for Raw Materials | 22.6 | 32.0 | –9.4 | 28.1 | 31(+) | 39.9 | 42.9 | 17.3 |
Prices Received for Finished Goods | 13.9 | 22.2 | –8.3 | 9.0 | 28(+) | 25.0 | 63.9 | 11.1 |
Wages and Benefits | 36.5 | 36.7 | –0.2 | 20.8 | 31(+) | 37.5 | 61.5 | 1.0 |
Employment | 5.9 | 17.1 | –11.2 | 7.8 | 29(+) | 21.5 | 62.9 | 15.6 |
Hours Worked | –1.0 | –0.1 | –0.9 | 3.8 | 2(–) | 15.1 | 68.8 | 16.1 |
Capital Expenditures | 9.3 | 7.1 | +2.2 | 7.0 | 28(+) | 20.1 | 69.1 | 10.8 |
| General Business Conditions Current (versus previous month) | ||||||||
| Indicator | Nov Index | Oct Index | Change | Series Average | Trend** | % Reporting Improved | % Reporting No Change | % Reporting Worsened |
Company Outlook | –15.2 | –9.1 | –6.1 | 6.2 | 9(–) | 11.0 | 62.8 | 26.2 |
General Business Activity | –14.4 | –19.4 | +5.0 | 2.5 | 7(–) | 17.3 | 51.0 | 31.7 |
| Indicator | Nov Index | Oct Index | Change | Series Average | Trend* | % Reporting Increase | % Reporting No Change | % Reporting Decrease |
Outlook Uncertainty† | 20.4 | 38.3 | –17.9 | 16.6 | 19(+) | 31.2 | 58.1 | 10.8 |
| Business Indicators Relating to Facilities and Products in Texas Future (six months ahead) | ||||||||
| Indicator | Nov Index | Oct Index | Change | Series Average | Trend* | % Reporting Increase | % Reporting No Change | % Reporting Decrease |
Production | 8.9 | 3.1 | +5.8 | 37.9 | 31(+) | 23.3 | 62.3 | 14.4 |
Capacity Utilization | 14.9 | 3.4 | +11.5 | 34.8 | 31(+) | 25.1 | 64.7 | 10.2 |
New Orders | 4.5 | –4.5 | +9.0 | 35.3 | 1(+) | 22.0 | 60.5 | 17.5 |
Growth Rate of Orders | 1.1 | 1.5 | –0.4 | 26.2 | 5(+) | 21.3 | 58.5 | 20.2 |
Unfilled Orders | –10.9 | –6.2 | –4.7 | 3.4 | 6(–) | 6.3 | 76.5 | 17.2 |
Shipments | 5.3 | 1.0 | +4.3 | 36.2 | 31(+) | 25.4 | 54.5 | 20.1 |
Delivery Time | –11.8 | 2.3 | –14.1 | –1.3 | 1(–) | 6.6 | 75.0 | 18.4 |
Finished Goods Inventories | –10.3 | –2.3 | –8.0 | 0.4 | 2(–) | 9.2 | 71.3 | 19.5 |
Prices Paid for Raw Materials | 21.8 | 25.8 | –4.0 | 34.5 | 32(+) | 40.2 | 41.4 | 18.4 |
Prices Received for Finished Goods | 16.1 | 26.4 | –10.3 | 21.2 | 31(+) | 31.0 | 54.0 | 14.9 |
Wages and Benefits | 52.4 | 43.4 | +9.0 | 39.5 | 31(+) | 52.8 | 46.8 | 0.4 |
Employment | 22.9 | 11.7 | +11.2 | 23.4 | 30(+) | 31.2 | 60.5 | 8.3 |
Hours Worked | 10.3 | 3.0 | +7.3 | 9.4 | 3(+) | 16.5 | 77.3 | 6.2 |
Capital Expenditures | 7.7 | 9.8 | –2.1 | 19.9 | 30(+) | 23.6 | 60.5 | 15.9 |
| General Business Conditions Future (six months ahead) | ||||||||
| Indicator | Nov Index | Oct Index | Change | Series Average | Trend** | % Reporting Increase | % Reporting No Change | % Reporting Worsened |
Company Outlook | –9.2 | –14.1 | +4.9 | 19.6 | 7(–) | 13.4 | 64.0 | 22.6 |
General Business Activity | –17.5 | –21.2 | +3.7 | 13.7 | 7(–) | 13.0 | 56.5 | 30.5 |
*Shown is the number of consecutive months of expansion or contraction in the underlying indicator. Expansion is indicated by a positive index reading and denoted by a (+) in the table. Contraction is indicated by a negative index reading and denoted by a (–) in the table.
**Shown is the number of consecutive months of improvement or worsening in the underlying indicator. Improvement is indicated by a positive index reading and denoted by a (+) in the table. Worsening is indicated by a negative index reading and denoted by a (–) in the table.
†Added to survey in January 2018.
Data have been seasonally adjusted as necessary, with the exception of the outlook uncertainty index, which does not yet have a sufficiently long time series to test for seasonality.
Production Index
Comments from Survey Respondents
These comments are from respondents’ completed surveys and have been edited for publication.
- We’re seeing order volume slow down as we approach the end of the year. Customers are pushing purchase orders out until the new year.
- Customers are illiquid. Demand is there; there is just no cash to buy food. There is increased tension in terms of demand for skilled workers and retaining them.
- Business is slow and slowing. Our outlook for January is hopeful.
- This is a manufacturing business making packaging. I believe we are a very good indicator of economic trends. Having said that, order volumes are down versus prior quarters. There is less panic buying going on. Inventories are beginning to go down. Lead times we are able to give to our customers are beginning to decrease as input of new orders slows. The slowdown is consistent with normal seasonal factors but way below last year’s very high fourth-quarter order level. We are beginning to see the end of the dislocations caused by the pandemic.
- We seem to be as busy this month as last month and are still having to work overtime in certain departments every week.
- Supply-chain problems have decreased.
- While we expect the building materials market to worsen in six months, we also expect our sales/shipments will improve due to steps being taken now to ameliorate this anticipated downturn.
- A downturn in residential building and construction, coupled with an increase in imports from Mexico, Malaysia, Vietnam, Ecuador, Colombia, Turkey and the Dominican Republic, is critically hurting the U.S. aluminum extrusion industry. Manufacturing jobs are being lost in our industry as a result. In a similar cycle a few years ago, with an onslaught of subsidized imports from China, 50 aluminum extrusion manufacturing plants—over 10 percent of our industry—closed.
- Recession is coming! We are just waiting for the backlog to evaporate. Then layoffs start.
- Supply-chain disruptions and delayed project schedules are negatively impacting our output and utilization. Inflation is decreasing demand.
- While we do see a softening in economic activity, we do not think it is a significant downturn at this time. Profitability will come under strain as steel prices decline, while labor and overhead costs remain elevated due to inflation.
- We are very concerned about the volume of future business activity. We see our customers pulling back their plans for expansion but still planning for the future. This has put us in a position to be very competitive to win every order possible to ensure our cash flow and ability to pay our employees and bills.
- We are still running strong; however, we believe that it is inevitable that the economy will contract within the next six months.
- Our shipments are delayed by supply delays.
- Inflation pressure continues to increase our cost of goods sold. Staffing is still tight in Dallas–Fort Worth, but we are seeing more stability. The cost of capital is unbearable for small businesses and will delay or reduce expenditures or hiring unless business drives change.
- Opportunities have been a little slower over the past two months, but it’s nothing dramatic.
- Business is generally sluggish, and some European customers have put off new orders because of uncertainty in their market.
- We are seeing weakness that began in personal electronics broaden into most markets except automotive.
- [The Federal Reserve] is going too crazy—that is really affecting the industrial equipment industry and stalling infrastructure spending as I have never seen before. Millions of jobs are at risk in manufacturing.
- We are seeing some stabilization in raw material prices, but stock availability of some items (plumbing parts, metal sheets) is still lower than normal. Market-wide labor costs are still increasing; we anticipate increasing pay faster than inflation again in December, as we have the two previous years. The good news is that we think that labor availability is slightly better than it was six to 12 months ago. We are starting to see resistance from customers to price increases that went unquestioned six to 12 months ago. This, combined with labor cost increases, will reduce our operating profit margin. The strong dollar is definitely impacting our pricing power. Our primary competitor prices in GBP [British pounds], so they have been cutting their U.S.-dollar wholesale price by 20 percent, forcing us to match them. In export markets, we are forced to offer a similar discount to be competitive.
- The outlook is troubling and unsettling. Caution is the strategy. The Federal Reserve is too aggressive. Let what’s been done materialize in the economy before piling on.
- Our order backlog is growing because we cannot buy electronic components at any price. Quoted delivery is six to 12 months.
Historical Data
Historical data can be downloaded dating back to June 2004.
Indexes
Download indexes for all indicators. For the definitions of all variables, see Data Definitions.
| Unadjusted |
| Seasonally adjusted |
All Data
Download indexes and components of the indexes (percentage of respondents reporting increase, decrease, or no change). For the definitions of all variables, see Data Definitions.
| Unadjusted |
| Seasonally adjusted |
Questions regarding the Texas Manufacturing Outlook Survey can be addressed to Emily Kerr at emily.kerr@dal.frb.org.
Sign up for our email alert to be automatically notified as soon as the latest Texas Manufacturing Outlook Survey is released on the web.