Texas Manufacturing Outlook Survey

Growth abates in Texas manufacturing sector
For this month’s survey, Texas business executives were asked supplemental questions on labor market conditions. Results for these questions from the Texas Manufacturing Outlook Survey, Texas Service Sector Outlook Survey and Texas Retail Outlook Survey have been released together. Read the special questions results.
This month’s data release also includes annual seasonal factor revisions. Once per year, the Federal Reserve Bank of Dallas revises the historical data for the Texas Manufacturing Outlook Survey after calculating new seasonal adjustment factors. Annual seasonal revisions result in slight changes in the seasonally adjusted series. Read more information on seasonal adjustment.
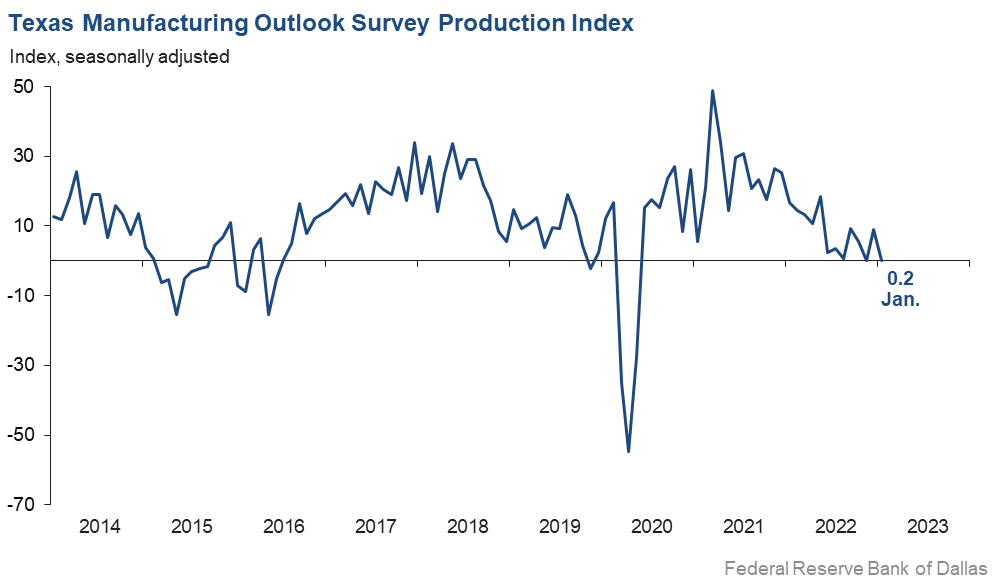
Growth in Texas factory activity slowed in January, according to business executives responding to the Texas Manufacturing Outlook Survey. The production index, a key measure of state manufacturing conditions, fell from 9.1 to 0.2, with the near-zero reading suggestive of flat output.
Other measures generally indicated weakened manufacturing activity this month. The new orders index was negative for an eighth month in a row—suggesting a continued decrease in demand—though it moved up from -11.0 to -4.0. The growth rate of orders index inched down to -12.3. The capacity utilization index was positive but dipped from 7.9 to 6.0, while the shipments index returned to negative territory at a reading of -6.3.
Perceptions of broader business conditions continued to worsen in January, though pessimism waned. The general business activity index remained negative but shot up 12 points to -8.4. Similarly, the company outlook index posted its 11th straight negative reading but moved up 11 points to -2.5. The outlook uncertainty index was largely unchanged at 16.8.
Labor market measures pointed to stronger employment growth and longer workweeks. The employment index climbed four points to 17.6, a reading significantly above its series average of 7.9. Thirty-one percent of firms noted net hiring, while 13 percent noted net layoffs. The hours worked index held fairly steady at 3.8.
Price pressures were generally steady and wage growth eased slightly in January. The raw materials prices index was largely stable at 20.5, remaining below its series average of 28.0 for the third month in a row. The finished goods prices index was little changed at 9.9, roughly in line with its series average of 9.0. The wages and benefits index ticked down from 34.2 to 30.5.
Expectations regarding future manufacturing activity were mixed in January. The future production index pushed further positive to 16.1, signaling that respondents expect output growth over the next six months. The future general business activity index remained negative, coming in at -9.1. Most other measures of future manufacturing activity were positive this month.
Next release: Monday, February 27
Data were collected Jan. 17–25, and 102 Texas manufacturers responded to the survey. The Dallas Fed conducts the Texas Manufacturing Outlook Survey monthly to obtain a timely assessment of the state’s factory activity. Firms are asked whether output, employment, orders, prices and other indicators increased, decreased or remained unchanged over the previous month.
Survey responses are used to calculate an index for each indicator. Each index is calculated by subtracting the percentage of respondents reporting a decrease from the percentage reporting an increase. When the share of firms reporting an increase exceeds the share reporting a decrease, the index will be greater than zero, suggesting the indicator has increased over the prior month. If the share of firms reporting a decrease exceeds the share reporting an increase, the index will be below zero, suggesting the indicator has decreased over the prior month. An index will be zero when the number of firms reporting an increase is equal to the number of firms reporting a decrease. Data have been seasonally adjusted as necessary.
Results summary
Historical data are available from June 2004 to the most current release month.
| Business indicators relating to facilities and products in Texas Current (versus previous month) | ||||||||
| Indicator | Jan Index | Dec Index | Change | Series Average | Trend* | % Reporting Increase | % Reporting No Change | % Reporting Decrease |
Production | 0.2 | 9.1 | –8.9 | 10.7 | 32(+) | 27.0 | 46.3 | 26.8 |
Capacity Utilization | 6.0 | 7.9 | –1.9 | 8.6 | 2(+) | 25.0 | 56.0 | 19.0 |
New Orders | –4.0 | –11.0 | +7.0 | 6.3 | 8(–) | 23.3 | 49.4 | 27.3 |
Growth Rate of Orders | –12.3 | –9.3 | –3.0 | 0.4 | 9(–) | 17.6 | 52.5 | 29.9 |
Unfilled Orders | –6.7 | –1.3 | –5.4 | –1.5 | 6(–) | 14.7 | 63.9 | 21.4 |
Shipments | –6.3 | 0.4 | –6.7 | 9.3 | 1(–) | 22.0 | 49.6 | 28.3 |
Delivery Time | –0.2 | –1.0 | +0.8 | 1.3 | 3(–) | 18.1 | 63.7 | 18.3 |
Finished Goods Inventories | –8.9 | –3.3 | –5.6 | –3.2 | 2(–) | 18.6 | 53.9 | 27.5 |
Prices Paid for Raw Materials | 20.5 | 21.9 | –1.4 | 28.0 | 33(+) | 32.7 | 55.1 | 12.2 |
Prices Received for Finished Goods | 9.9 | 10.9 | –1.0 | 9.0 | 30(+) | 18.2 | 73.5 | 8.3 |
Wages and Benefits | 30.5 | 34.2 | –3.7 | 20.9 | 33(+) | 33.4 | 63.8 | 2.9 |
Employment | 17.6 | 13.6 | +4.0 | 7.9 | 31(+) | 31.0 | 55.6 | 13.4 |
Hours Worked | 3.8 | 5.6 | –1.8 | 3.8 | 2(+) | 19.9 | 64.0 | 16.1 |
Capital Expenditures | 11.6 | –2.5 | +14.1 | 6.9 | 1(+) | 22.8 | 66.0 | 11.2 |
| General business conditions Current (versus previous month) | ||||||||
| Indicator | Jan Index | Dec Index | Change | Series Average | Trend** | % Reporting Improved | % Reporting No Change | % Reporting Worsened |
Company Outlook | –2.5 | –13.7 | +11.2 | 6.0 | 11(–) | 16.9 | 63.7 | 19.4 |
General Business Activity | –8.4 | –20.0 | +11.6 | 2.3 | 9(–) | 17.2 | 57.2 | 25.6 |
| Indicator | Jan Index | Dec Index | Change | Series Average | Trend* | % Reporting Increase | % Reporting No Change | % Reporting Decrease |
Outlook Uncertainty† | 16.8 | 15.6 | +1.2 | 16.6 | 21(+) | 29.7 | 57.4 | 12.9 |
| Business indicators relating to facilities and products in Texas Future (six months ahead) | ||||||||
| Indicator | Jan Index | Dec Index | Change | Series Average | Trend* | % Reporting Increase | % Reporting No Change | % Reporting Decrease |
Production | 16.1 | 10.5 | +5.6 | 37.7 | 33(+) | 36.0 | 44.1 | 19.9 |
Capacity Utilization | 19.2 | 9.1 | +10.1 | 34.6 | 33(+) | 34.3 | 50.6 | 15.1 |
New Orders | 14.8 | 3.8 | +11.0 | 35.1 | 3(+) | 32.6 | 49.5 | 17.8 |
Growth Rate of Orders | 8.7 | 4.0 | +4.7 | 26.1 | 7(+) | 27.8 | 53.1 | 19.1 |
Unfilled Orders | –4.1 | –12.8 | +8.7 | 3.3 | 8(–) | 10.9 | 74.2 | 15.0 |
Shipments | 15.5 | 11.2 | +4.3 | 36.0 | 33(+) | 34.2 | 47.2 | 18.7 |
Delivery Time | –12.4 | –4.1 | –8.3 | –1.3 | 3(–) | 7.1 | 73.3 | 19.5 |
Finished Goods Inventories | –1.1 | –1.2 | +0.1 | 0.4 | 4(–) | 17.0 | 64.9 | 18.1 |
Prices Paid for Raw Materials | 14.2 | 19.4 | –5.2 | 34.4 | 34(+) | 30.7 | 52.7 | 16.5 |
Prices Received for Finished Goods | 11.3 | 18.8 | –7.5 | 21.1 | 33(+) | 27.8 | 55.7 | 16.5 |
Wages and Benefits | 43.7 | 41.0 | +2.7 | 39.4 | 33(+) | 46.7 | 50.2 | 3.0 |
Employment | 20.4 | 18.4 | +2.0 | 23.3 | 32(+) | 32.9 | 54.6 | 12.5 |
Hours Worked | 5.4 | 1.1 | +4.3 | 9.3 | 5(+) | 19.6 | 66.2 | 14.2 |
Capital Expenditures | 14.9 | 5.2 | +9.7 | 19.8 | 32(+) | 29.6 | 55.8 | 14.7 |
| General business conditions Future (six months ahead) | ||||||||
| Indicator | Jan Index | Dec Index | Change | Series Average | Trend** | % Reporting Increase | % Reporting No Change | % Reporting Worsened |
Company Outlook | 6.0 | –2.4 | +8.4 | 19.4 | 1(+) | 26.6 | 52.8 | 20.6 |
General Business Activity | –9.1 | –9.6 | +0.5 | 13.5 | 9(–) | 16.9 | 57.0 | 26.0 |
*Shown is the number of consecutive months of expansion or contraction in the underlying indicator. Expansion is indicated by a positive index reading and denoted by a (+) in the table. Contraction is indicated by a negative index reading and denoted by a (–) in the table.
**Shown is the number of consecutive months of improvement or worsening in the underlying indicator. Improvement is indicated by a positive index reading and denoted by a (+) in the table. Worsening is indicated by a negative index reading and denoted by a (–) in the table.
†Added to survey in January 2018.
Data have been seasonally adjusted as necessary, with the exception of the outlook uncertainty index, which does not yet have a sufficiently long time series to test for seasonality.
Production index
Comments from survey respondents
These comments are from respondents’ completed surveys and have been edited for publication.
- We had a customer in the pet food segment significantly decrease its orders due to an inventory backlog.
- Uncertainty from the overall economic downturn is affecting our long-term strategy.
- Business is sluggish. We’re seeing increased illiquidity in our customer base.
- We are still seeing input costs increase. We had let our gross margin erode over the last couple of years and are now playing catch-up. We are raising prices faster than our inputs increase in a bid to restore an acceptable gross margin. This is resulting in slightly increased dollar sales and increased gross margin, but decreased unit sales. We also had many of our older 3G-based [wireless] credit card readers that we mistakenly thought also had 4G capability stop working due to the phase-out of 3G. New 4G/5G radios are on a several-month back order. Some unknown share of our sales decline is due to lack of credit card readers at the point of sale.
- Uncertainty is high. Holiday sales were stronger than expected, but January is slow versus last year. Delivery times are down, but future demand and sales sentiment are low.
- Activity continues to slip, and selling prices are coming down. We still can’t find any workers and, with our six-month projection, we have quit looking.
-
We have definitely seen a slowdown in activity compared to prior months. It's as if the spigot got turned off. All our supply-chain constraints are pretty much gone, with delivery times much more like prepandemic times. We have work coming up but right now are very slow and struggling to get our hourly workers even 32 hours per week.
- Lost production due to Winter Storm Elliot caused tightening of our inventory levels.
- We are seeing a slowdown in orders and clients unwilling to hold additional inventory.
- Recession is on its way.
- The residential building and construction industry has seen a significant decrease in orders across the extrusion industry. Also, imports of aluminum extrusions from South America, Mexico, Malaysia, Vietnam, Turkey and India are at record highs. Mexico is gaining more and more business in the U.S. due to not having to pay Section 232 tariffs, whereas U.S. domestic extruders are paying the tariff via our raw aluminum or billet purchases. If action is not taken, the U.S. aluminum extrusion industry as we know it today will be shutting down capacity and plants.
- We are seeing improvement in the business climate. Our competitors are coming to us to supply their customers. Additionally, we are purchasing new machines to add capabilities in our business and further vertically integrate our manufacturing. This will improve our profitability and reduce lead time to produce our products.
- Order volume has been going down, and we expect the trend to continue. Raw material pricing seems to be stable at the present time.
- Current federal policies are killing small businesses. From diesel prices to shortages, everything costs so much more.
- We provided significant (10 percent or more) raises in December after a midyear raise in July 2022. We felt that this was essential in order to keep our employees, and we have successfully retained everyone we wanted to keep. We hope not to need to do another round of raises midyear. Since our employees are blue-collar workers, inflation hits them particularly hard, and they are more willing to look for another job for a 10–15 percent pay increase. We are investing in more automation and removing process bottlenecks to increase productivity and reduce lead time.
- We have a bleak outlook until the Federal Reserve stops interest hikes and the administration seeks energy independence.
- We are starting to see some customers pushing delivery out due to market uncertainty.
- Requests for bids continue at a steady rate; we have not yet seen a contraction. The only change is, when posting job openings, we actually have people responding—this is a big change and likely a sign of some layoffs after the holidays from other companies. The biggest issues facing our company are increased regulations and contact from federal, state and local entities regarding a variety of topics. Often it feels as a small business that the government does not want us to succeed.
- We continue to see large fluctuations in raw material pricing from order to order. Pricing has not corrected from the metals market shutdown in March 2022. Most lead times for raw material remain longer than in previous years.
- Order volumes remain flat across all markets we serve—automotive OEM [original equipment manufacturers], plumbing and ammunition. Raw material costs and lead times have declined since 2022.
Historical Data
Historical data can be downloaded dating back to June 2004.
Indexes
Download indexes for all indicators. For the definitions of all variables, see Data Definitions.
| Unadjusted |
| Seasonally adjusted |
All Data
Download indexes and components of the indexes (percentage of respondents reporting increase, decrease, or no change). For the definitions of all variables, see Data Definitions.
| Unadjusted |
| Seasonally adjusted |
Questions regarding the Texas Manufacturing Outlook Survey can be addressed to Emily Kerr at emily.kerr@dal.frb.org.
Sign up for our email alert to be automatically notified as soon as the latest Texas Manufacturing Outlook Survey is released on the web.