Texas Manufacturing Outlook Survey

Texas manufacturing output declines in June, selling prices edge down
For this month’s survey, Texas business executives were asked supplemental questions on outlook concerns, employment and capital expenditures. Results for these questions from the Texas Manufacturing Outlook Survey, Texas Service Sector Outlook Survey and Texas Retail Outlook Survey have been released together. Read the special questions results.
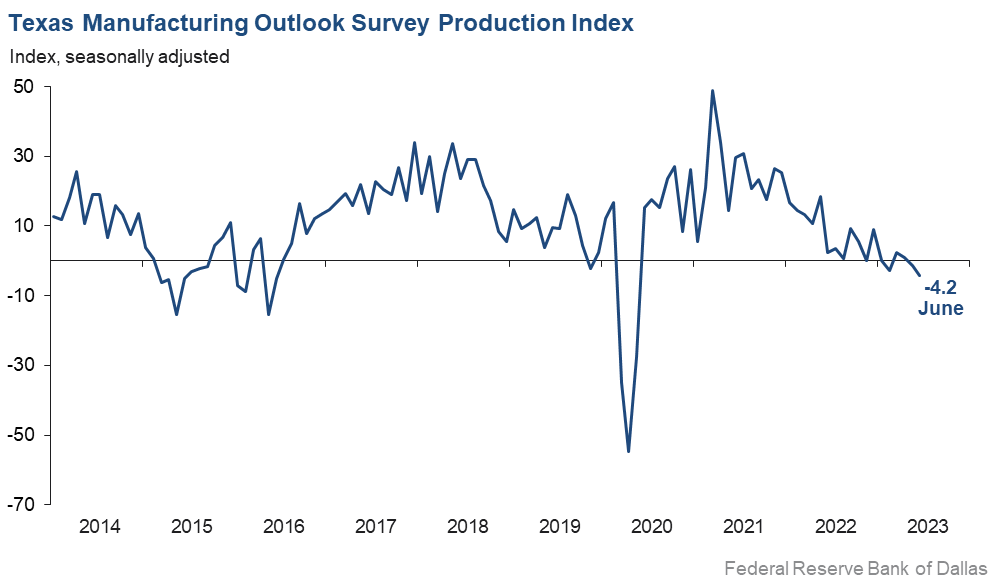
Texas factory activity declined in June, according to business executives responding to the Texas Manufacturing Outlook Survey. The production index, a key measure of state manufacturing conditions, fell three points to -4.2, a reading indicative of a slight contraction in output.
Other measures of manufacturing activity also indicated contraction in June. The new orders index has been in negative territory for more than a year and held steady this month at -16.6. The growth rate of orders index inched down to -23.7, its lowest value since mid-2020. The capacity utilization index edged down from -4.9 to -6.0, while the shipments index plunged 14 points to -17.0.
Perceptions of broader business conditions continued to worsen in June. The general business activity and company outlook indexes remained negative, though both moved up, coming in at -23.2 and -10.7, respectively. The outlook uncertainty index ticked up to 16.7, in line with its series average.
Labor market measures suggest weaker employment growth and declining work hours. The employment index retreated seven points to 2.2, falling below its average reading of 7.8. Seventeen percent of firms noted net hiring, while 15 percent noted net layoffs. The hours worked index moved down to -4.3.
Price pressures evaporated, while wage pressures remained elevated. The raw materials prices index dropped 12 points to 1.4, indicative of little change in input costs from May. The finished goods prices index slipped from 0.4 to -1.9, suggesting selling prices edged down in June. The wages and benefits index held at 25.3, still slightly above its average of 21.1.
Expectations regarding future manufacturing activity were mixed in June. The future production index moved up 12 points to 24.2. The future general business activity index remained negative, though it rose from -12.7 to -4.5. Most other measures of future manufacturing activity were positive and moved up this month.
Next release: Monday, July 31
Data were collected June 13–21, and 85 Texas manufacturers responded to the survey. The Dallas Fed conducts the Texas Manufacturing Outlook Survey monthly to obtain a timely assessment of the state’s factory activity. Firms are asked whether output, employment, orders, prices and other indicators increased, decreased or remained unchanged over the previous month.
Survey responses are used to calculate an index for each indicator. Each index is calculated by subtracting the percentage of respondents reporting a decrease from the percentage reporting an increase. When the share of firms reporting an increase exceeds the share reporting a decrease, the index will be greater than zero, suggesting the indicator has increased over the prior month. If the share of firms reporting a decrease exceeds the share reporting an increase, the index will be below zero, suggesting the indicator has decreased over the prior month. An index will be zero when the number of firms reporting an increase is equal to the number of firms reporting a decrease. Data have been seasonally adjusted as necessary.
Results summary
Historical data are available from June 2004 to the most current release month.
| Business Indicators Relating to Facilities and Products in Texas Current (versus previous month) | ||||||||
| Indicator | Jun Index | May Index | Change | Series Average | Trend* | % Reporting Increase | % Reporting No Change | % Reporting Decrease |
Production | –4.2 | –1.3 | –2.9 | 10.5 | 2(–) | 21.7 | 52.4 | 25.9 |
Capacity Utilization | –6.0 | –4.9 | –1.1 | 8.4 | 2(–) | 20.1 | 53.8 | 26.1 |
New Orders | –16.6 | –16.1 | –0.5 | 5.9 | 13(–) | 20.6 | 42.2 | 37.2 |
Growth Rate of Orders | –23.7 | –20.7 | –3.0 | 0.0 | 14(–) | 15.5 | 45.2 | 39.2 |
Unfilled Orders | –8.5 | –15.5 | +7.0 | –1.7 | 11(–) | 13.4 | 64.7 | 21.9 |
Shipments | –17.0 | –3.0 | –14.0 | 8.9 | 6(–) | 18.2 | 46.5 | 35.2 |
Delivery Time | –4.3 | –7.3 | +3.0 | 1.3 | 3(–) | 14.0 | 67.7 | 18.3 |
Finished Goods Inventories | –4.7 | 1.1 | –5.8 | –3.2 | 1(–) | 16.7 | 61.9 | 21.4 |
Prices Paid for Raw Materials | 1.4 | 13.8 | –12.4 | 27.7 | 38(+) | 18.5 | 64.4 | 17.1 |
Prices Received for Finished Goods | –1.9 | 0.4 | –2.3 | 8.9 | 1(–) | 10.6 | 76.9 | 12.5 |
Wages and Benefits | 25.3 | 25.0 | +0.3 | 21.1 | 38(+) | 25.3 | 74.7 | 0.0 |
Employment | 2.2 | 9.6 | –7.4 | 7.8 | 4(+) | 17.0 | 68.2 | 14.8 |
Hours Worked | –4.3 | –0.9 | –3.4 | 3.7 | 3(–) | 11.6 | 72.5 | 15.9 |
Capital Expenditures | 0.3 | –3.7 | +4.0 | 6.8 | 1(+) | 14.5 | 71.2 | 14.2 |
| General Business Conditions Current (versus previous month) | ||||||||
| Indicator | Jun Index | May Index | Change | Series Average | Trend** | % Reporting Improved | % Reporting No Change | % Reporting Worsened |
Company Outlook | –10.7 | –22.3 | +11.6 | 5.6 | 16(–) | 17.2 | 54.9 | 27.9 |
General Business Activity | –23.2 | –29.1 | +5.9 | 1.8 | 14(–) | 11.3 | 54.2 | 34.5 |
| Indicator | Jun Index | May Index | Change | Series Average | Trend* | % Reporting Increase | % Reporting No Change | % Reporting Decrease |
Outlook Uncertainty | 16.7 | 13.4 | +3.3 | 16.9 | 26(+) | 28.6 | 59.5 | 11.9 |
| Business Indicators Relating to Facilities and Products in Texas Future (six months ahead) | ||||||||
| Indicator | Jun Index | May Index | Change | Series Average | Trend* | % Reporting Increase | % Reporting No Change | % Reporting Decrease |
Production | 24.2 | 12.0 | +12.2 | 37.2 | 38(+) | 43.2 | 37.8 | 19.0 |
Capacity Utilization | 18.4 | 10.9 | +7.5 | 34.1 | 38(+) | 36.8 | 44.8 | 18.4 |
New Orders | 17.0 | 3.7 | +13.3 | 34.5 | 8(+) | 37.4 | 42.2 | 20.4 |
Growth Rate of Orders | 11.0 | –2.0 | +13.0 | 25.6 | 1(+) | 29.8 | 51.4 | 18.8 |
Unfilled Orders | –2.8 | –7.6 | +4.8 | 3.1 | 13(–) | 9.2 | 78.8 | 12.0 |
Shipments | 25.4 | 10.2 | +15.2 | 35.5 | 38(+) | 44.1 | 37.2 | 18.7 |
Delivery Time | –2.3 | –8.5 | +6.2 | –1.4 | 3(–) | 11.9 | 73.9 | 14.2 |
Finished Goods Inventories | –12.5 | –11.6 | –0.9 | 0.3 | 2(–) | 10.0 | 67.5 | 22.5 |
Prices Paid for Raw Materials | 4.4 | 4.3 | +0.1 | 33.9 | 39(+) | 22.8 | 58.8 | 18.4 |
Prices Received for Finished Goods | 2.5 | 4.7 | –2.2 | 20.9 | 38(+) | 17.7 | 67.1 | 15.2 |
Wages and Benefits | 34.9 | 36.1 | –1.2 | 39.4 | 38(+) | 37.8 | 59.3 | 2.9 |
Employment | 27.2 | 24.8 | +2.4 | 23.3 | 37(+) | 37.1 | 53.0 | 9.9 |
Hours Worked | 3.3 | –2.6 | +5.9 | 9.1 | 1(+) | 17.3 | 68.7 | 14.0 |
Capital Expenditures | 17.2 | 4.5 | +12.7 | 19.7 | 37(+) | 31.9 | 53.4 | 14.7 |
| General Business Conditions Future (six months ahead) | ||||||||
| Indicator | Jun Index | May Index | Change | Series Average | Trend** | % Reporting Increase | % Reporting No Change | % Reporting Worsened |
Company Outlook | 2.0 | –3.9 | +5.9 | 18.9 | 1(+) | 24.2 | 53.6 | 22.2 |
General Business Activity | –4.5 | –12.7 | +8.2 | 13.0 | 14(–) | 21.2 | 53.1 | 25.7 |
*Shown is the number of consecutive months of expansion or contraction in the underlying indicator. Expansion is indicated by a positive index reading and denoted by a (+) in the table. Contraction is indicated by a negative index reading and denoted by a (–) in the table.
**Shown is the number of consecutive months of improvement or worsening in the underlying indicator. Improvement is indicated by a positive index reading and denoted by a (+) in the table. Worsening is indicated by a negative index reading and denoted by a (–) in the table.
Data have been seasonally adjusted as necessary.
Production index
Comments from survey respondents
These comments are from respondents’ completed surveys and have been edited for publication.
- We expect slower activity in the coming months as customer destocking continues as their business slows. We expect to hold onto as many trained employees as we can, expecting a return to growth in 2024.
- Inflation continues to take a toll on employee salaries and benefits. Costs of materials, parts, external labor, and shipping continue to increase as suppliers mitigate the loss of volumes in price to sustain or increase profit levels. Customers continue to give mixed messages around supply and demand as consumer spending is not consistent. Customers are just now working off surplus inventories from 2022; as anticipated, purchases occurred due to supply/demand woes, war impact and high inflation costs.
- We continue to struggle to find qualified staff. We intend to hire more people and embark on a significant capital improvement project (including new building, new manufacturing equipment) so that we have capacity available as soon as the economy starts to recover after the recession that everyone is predicting.
- We are still seeing some long lead times, currently with the aluminum industry.
- We are starting to see a major shift in industrial production and a lack of confidence.
- Supply constraints improved versus the prior year, but there are still some ongoing challenges.
- We are definitely slower from a production perspective. We expect production to pick up a little later in the summer in preparation of fourth-quarter sales.
- Stagflation. Political incompetence is creating an unstable business environment.
- We’re investing now with new equipment that should increase our competitiveness even in a potentially shrinking market six months from now. The last 12 months have provided the wherewithal to be able to make such investment. We’ll see how it shakes out.
- We are living hand to mouth. The surge in orders could easily stop as quickly as it started. We’re month to month.
- Business has slowed down significantly over the last few months and is now holding steady at a relatively low level.
- The interest rate is too high and is eating away our profits.
- Orders are cooling off a little from and already-reduced level. Our industry cooled off a few quarters ago, and now we are feeling the same thing.
- We service retailers. They are tentative; we are wary.
- Section 142 tariffs raise our costs, rendering us uncompetitive with foreign competitors who don’t pay that cost.
- Incoming orders are off substantially, especially in the residential building and construction markets we produce raw material for. Also, the percentage of imports of aluminum extrusions is at its highest level in several years, going back to when China was subsidizing their aluminum extrusion industry for shipments to the U.S. We are also being affected severely by Mexico shipping extrusions to the U.S. without having to pay Section 232 tariffs. Our industry is at a critical state at this point.
- We have started to get very busy with a large job that we knew was coming and has now arrived. Because of this and a couple of other nice large jobs we have landed, we will be busy during the summer and into the fall. It’s a good thing because our regular business from regular customers is in the ditch right now. I'm hearing from many others in our industry that it’s slow times for them, so we are very fortunate to have the work we have.
- June has been much stronger than anticipated across all channels. We think our consumer (which tends to be high end and high income) is feeling more confident about inflation and the future economic outlook and is back to spending.
Historical Data
Historical data can be downloaded dating back to June 2004.
Indexes
Download indexes for all indicators. For the definitions of all variables, see Data Definitions.
| Unadjusted |
| Seasonally adjusted |
All Data
Download indexes and components of the indexes (percentage of respondents reporting increase, decrease, or no change). For the definitions of all variables, see Data Definitions.
| Unadjusted |
| Seasonally adjusted |
Questions regarding the Texas Manufacturing Outlook Survey can be addressed to Emily Kerr at emily.kerr@dal.frb.org.
Sign up for our email alert to be automatically notified as soon as the latest Texas Manufacturing Outlook Survey is released on the web.