Texas Manufacturing Outlook Survey

Texas manufacturing sector indicators mixed in April
For this month’s survey, Texas business executives were asked supplemental questions on artificial intelligence (AI). Results for these questions from the Texas Manufacturing Outlook Survey, Texas Service Sector Outlook Survey and Texas Retail Outlook Survey have been released together. Read the special questions results.
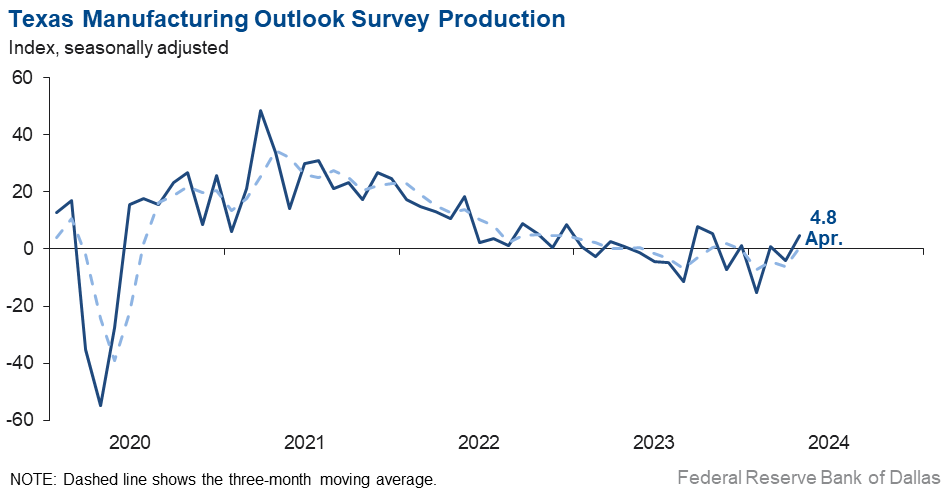
Texas factory output strengthened slightly in April, according to business executives responding to the Texas Manufacturing Outlook Survey. The production index, a key measure of state manufacturing conditions, rose from -4.1 to 4.8.
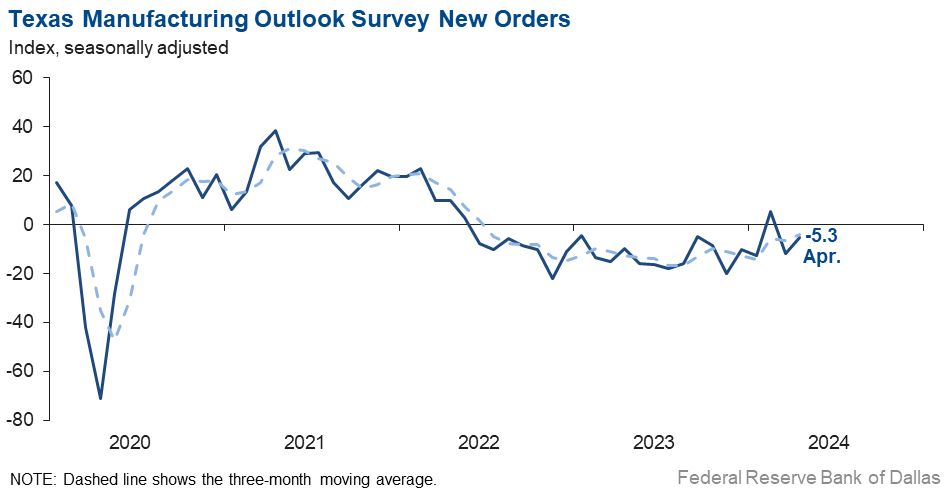
Other measures of manufacturing activity were mixed this month. The new orders index remained negative, though it pushed up seven points to -5.3. The capacity utilization and shipments indexes turned positive this month, coming in at 4.2 and 5.0, respectively.
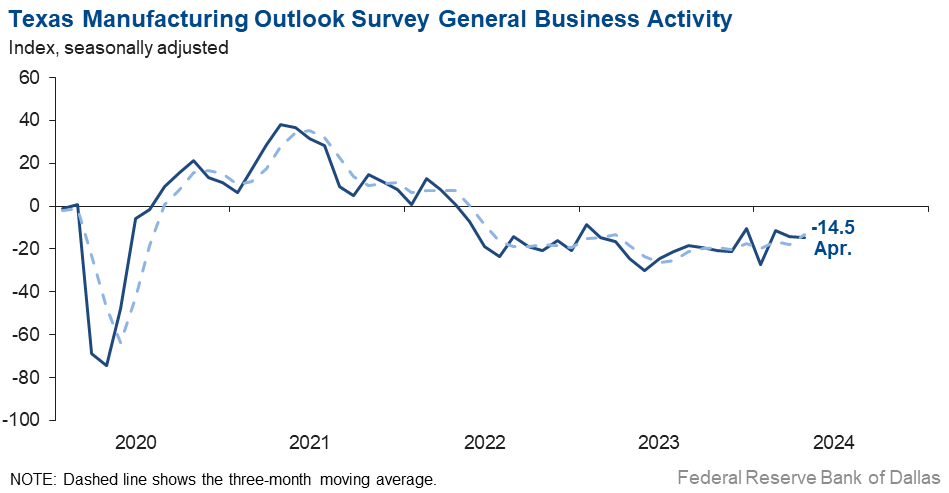
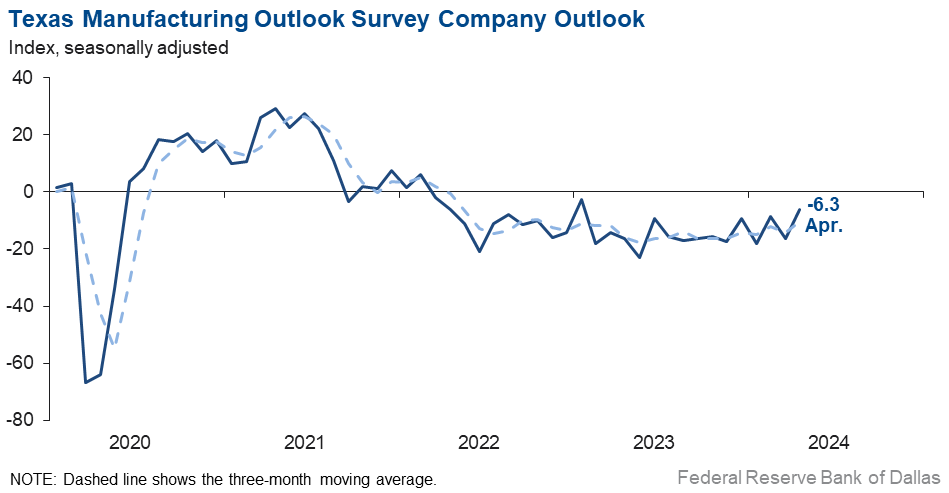
Perceptions of broader business conditions continued to worsen in April. The general business activity index held steady at -14.5—with the negative reading signaling worsening activity—and the company outlook index remained negative but moved up 10 points to -6.3. The outlook uncertainty index retreated six points to 17.3.
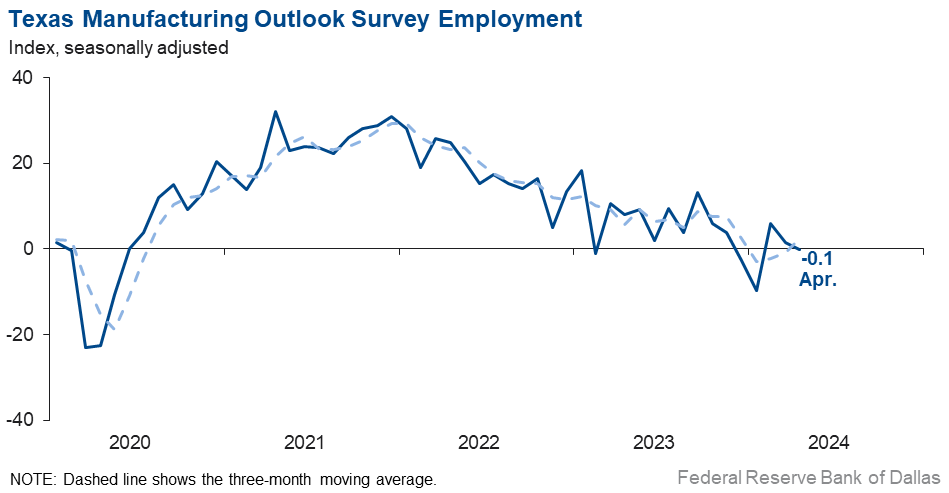
Labor market measures suggested flat employment and slightly shorter workweeks this month. The employment index edged down to a near-zero reading, suggesting no change in head counts. Fifteen percent of firms noted net hiring, the same as the share noting net layoffs. The hours worked index remained negative for a seventh month in a row but moved up six points to -2.3.
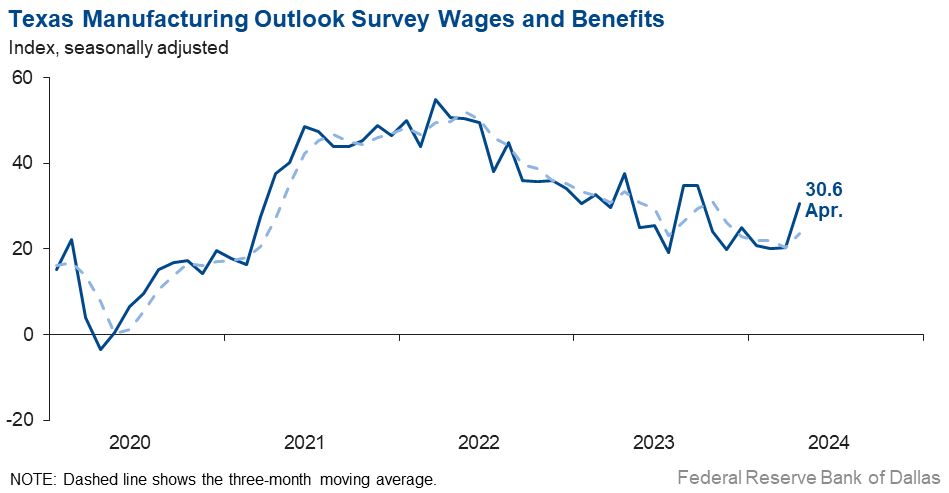
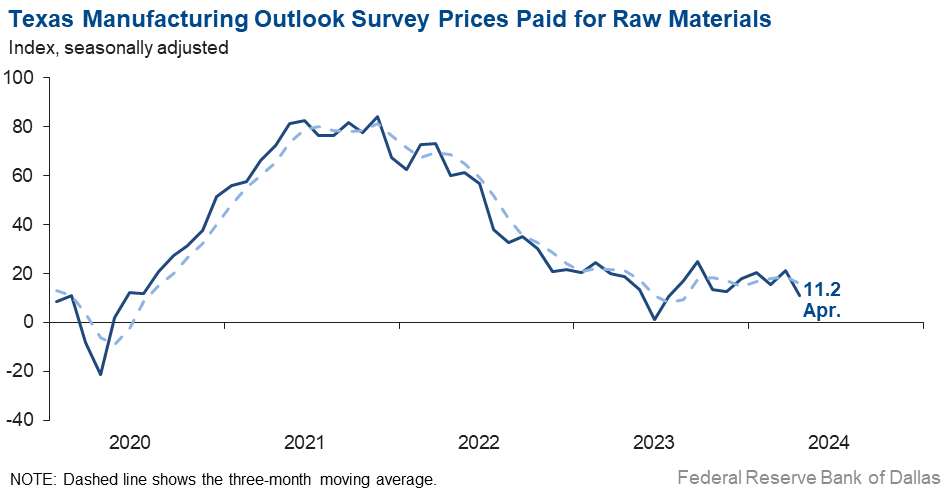
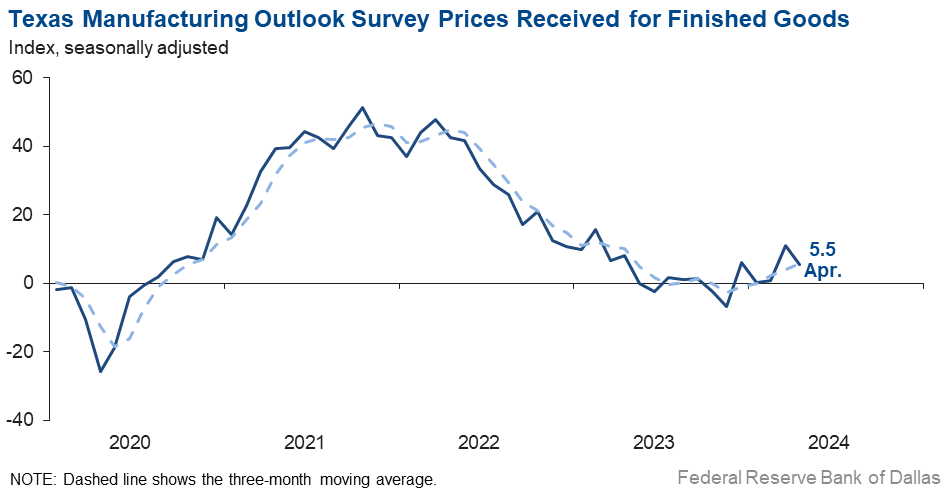
Wage pressures picked up this month, while price pressures retreated. The wages and benefits index pushed up 10 points to 30.6, a seven-month high and indicative of stronger-than-usual growth in compensation. The raw materials prices index retreated further below average, falling 10 points to 11.2. The finished goods prices index also fell, from 11.0 to 5.5.
Expectations regarding future manufacturing activity improved in April. The future production index inched up to 34.8, and the future general business activity index rose from 1.3 to 7.9. Other measures of future manufacturing activity also pushed further positive this month.
Next release: Tuesday, May 28
Data were collected April 16–24, and 87 out of the 127 Texas manufacturers surveyed submitted a response. The Dallas Fed conducts the Texas Manufacturing Outlook Survey monthly to obtain a timely assessment of the state’s factory activity. Firms are asked whether output, employment, orders, prices and other indicators increased, decreased or remained unchanged over the previous month.
Survey responses are used to calculate an index for each indicator. Each index is calculated by subtracting the percentage of respondents reporting a decrease from the percentage reporting an increase. When the share of firms reporting an increase exceeds the share reporting a decrease, the index will be greater than zero, suggesting the indicator has increased over the prior month. If the share of firms reporting a decrease exceeds the share reporting an increase, the index will be below zero, suggesting the indicator has decreased over the prior month. An index will be zero when the number of firms reporting an increase is equal to the number of firms reporting a decrease. Data have been seasonally adjusted as necessary.
Results summary
Historical data are available from June 2004 to the most current release month.
| Business Indicators Relating to Facilities and Products in Texas Current (versus previous month) | ||||||||
| Indicator | Apr Index | Mar Index | Change | Series Average | Trend* | % Reporting Increase | % Reporting No Change | % Reporting Decrease |
Production | 4.8 | –4.1 | +8.9 | 9.9 | 1(+) | 26.3 | 52.2 | 21.5 |
Capacity Utilization | 4.2 | –5.7 | +9.9 | 7.9 | 1(+) | 25.4 | 53.4 | 21.2 |
New Orders | –5.3 | –11.8 | +6.5 | 5.2 | 2(–) | 26.1 | 42.6 | 31.4 |
Growth Rate of Orders | 3.8 | –19.8 | +23.6 | –0.6 | 1(+) | 24.9 | 54.0 | 21.1 |
Unfilled Orders | –5.9 | –16.6 | +10.7 | –2.1 | 7(–) | 13.6 | 66.9 | 19.5 |
Shipments | 5.0 | –15.4 | +20.4 | 8.3 | 1(+) | 28.4 | 48.2 | 23.4 |
Delivery Time | –0.3 | –6.1 | +5.8 | 1.0 | 13(–) | 12.5 | 74.7 | 12.8 |
Finished Goods Inventories | –5.8 | 4.7 | –10.5 | –3.2 | 1(–) | 14.0 | 66.3 | 19.8 |
Prices Paid for Raw Materials | 11.2 | 21.1 | –9.9 | 27.2 | 48(+) | 22.9 | 65.4 | 11.7 |
Prices Received for Finished Goods | 5.5 | 11.0 | –5.5 | 8.6 | 5(+) | 14.2 | 77.1 | 8.7 |
Wages and Benefits | 30.6 | 20.4 | +10.2 | 21.2 | 48(+) | 31.7 | 67.2 | 1.1 |
Employment | –0.1 | 1.5 | –1.6 | 7.6 | 1(–) | 14.6 | 70.7 | 14.7 |
Hours Worked | –2.3 | –7.9 | +5.6 | 3.4 | 7(–) | 13.0 | 71.7 | 15.3 |
Capital Expenditures | 11.1 | 1.8 | +9.3 | 6.5 | 7(+) | 25.3 | 60.5 | 14.2 |
| General Business Conditions Current (versus previous month) | ||||||||
| Indicator | Apr Index | Mar Index | Change | Series Average | Trend** | % Reporting Improved | % Reporting No Change | % Reporting Worsened |
Company Outlook | –6.3 | –16.2 | +9.9 | 4.7 | 26(–) | 19.1 | 55.5 | 25.4 |
General Business Activity | –14.5 | –14.4 | –0.1 | 1.0 | 24(–) | 15.0 | 55.5 | 29.5 |
| Indicator | Apr Index | Mar Index | Change | Series Average | Trend* | % Reporting Increase | % Reporting No Change | % Reporting Decrease |
Outlook Uncertainty | 17.3 | 23.0 | –5.7 | 17.2 | 36(+) | 29.9 | 57.5 | 12.6 |
| Business Indicators Relating to Facilities and Products in Texas Future (six months ahead) | ||||||||
| Indicator | Apr Index | Mar Index | Change | Series Average | Trend* | % Reporting Increase | % Reporting No Change | % Reporting Decrease |
Production | 34.8 | 32.3 | +2.5 | 36.4 | 48(+) | 43.4 | 48.0 | 8.6 |
Capacity Utilization | 29.4 | 25.1 | +4.3 | 33.3 | 48(+) | 39.3 | 50.8 | 9.9 |
New Orders | 25.4 | 23.7 | +1.7 | 33.8 | 18(+) | 33.9 | 57.6 | 8.5 |
Growth Rate of Orders | 19.4 | 18.6 | +0.8 | 24.9 | 11(+) | 31.5 | 56.4 | 12.1 |
Unfilled Orders | –3.2 | –0.2 | –3.0 | 2.9 | 2(–) | 7.0 | 82.8 | 10.2 |
Shipments | 29.4 | 21.5 | +7.9 | 34.8 | 48(+) | 38.2 | 53.0 | 8.8 |
Delivery Time | –4.2 | 0.3 | –4.5 | –1.5 | 1(–) | 5.9 | 84.0 | 10.1 |
Finished Goods Inventories | 2.5 | –9.9 | +12.4 | 0.0 | 1(+) | 11.1 | 80.2 | 8.6 |
Prices Paid for Raw Materials | 23.2 | 27.2 | –4.0 | 33.5 | 49(+) | 30.9 | 61.4 | 7.7 |
Prices Received for Finished Goods | 17.3 | 17.3 | 0.0 | 20.8 | 48(+) | 21.0 | 75.3 | 3.7 |
Wages and Benefits | 40.1 | 41.6 | –1.5 | 39.3 | 239(+) | 41.2 | 57.7 | 1.1 |
Employment | 20.2 | 17.9 | +2.3 | 22.9 | 47(+) | 31.9 | 56.4 | 11.7 |
Hours Worked | 7.2 | –0.5 | +7.7 | 8.8 | 1(+) | 16.3 | 74.7 | 9.1 |
Capital Expenditures | 11.9 | 12.7 | –0.8 | 19.4 | 47(+) | 27.1 | 57.7 | 15.2 |
| General Business Conditions Future (six months ahead) | ||||||||
| Indicator | Apr Index | Mar Index | Change | Series Average | Trend** | % Reporting Increase | % Reporting No Change | % Reporting Worsened |
Company Outlook | 14.9 | 12.5 | +2.4 | 18.3 | 5(+) | 27.8 | 59.3 | 12.9 |
General Business Activity | 7.9 | 1.3 | +6.6 | 12.3 | 3(+) | 25.4 | 57.1 | 17.5 |
*Shown is the number of consecutive months of expansion or contraction in the underlying indicator. Expansion is indicated by a positive index reading and denoted by a (+) in the table. Contraction is indicated by a negative index reading and denoted by a (–) in the table.
**Shown is the number of consecutive months of improvement or worsening in the underlying indicator. Improvement is indicated by a positive index reading and denoted by a (+) in the table. Worsening is indicated by a negative index reading and denoted by a (–) in the table.
Data have been seasonally adjusted as necessary.
Comments from survey respondents
These comments are from respondents’ completed surveys and have been edited for publication.
- We continue to see a slight strengthening in demand for our products. This demand, combined with the cost-saving initiatives that we implemented when demand softened in 2022–23 alongside inflation pressures on our core customers, has improved our outlook for the remainder of 2024 and 2025.
- We're coming out of a seasonal low, and there seems to be a slight uptick in demand, despite prices for raw materials (and finished goods) increasing.
- The geopolitical environment is volatile. The economy remains stronger than anticipated, causing the Federal Reserve to delay interest rate cuts.
- Political instability and politicization have hampered growth. We are entering stagflation.
- We have had a very strong quarter, particularly with our direct-to-consumer business. Wholesale business (and overall sentiment/mood from other wholesale vendors/partners/friends) is less encouraging, and many are noting slow sales (our wholesale/business-to-business is flat to slightly up). We feel great about our short-term outlook but are still not sure about our long-term outlook. Input prices are flat, and there is little change throughout the business as it relates to costs, delivery times, etc.
- There has been a decrease in new orders for three weeks now. Currently, we think this will come around, but we get more concerned as time goes on.
- We continue to be very busy with incoming orders up hugely for the first six months of our fiscal year compared with last year. We can't really explain it, and while many in our industry are slow or just so, so busy, we are fortunate to have an abundance of work. We do hear about some serious general slowness in the market and because of that are very cautious about six months from now. We did just place an order for a very large capital expenditure machine that upgrades our existing line that was bought new in 1998. It will be installed in October 2024, probably when we are slow.
- Inflationary pressures on raw materials and construction costs are driving up the cost of public projects. This is causing states to delay or scramble for funding for projects that have long lead times.
- A large portion of our business is related to building and construction. Several of our customers build windows and doors for new houses, and this market remains off. Remodeling remains off as well, with both [areas of slowdown] tied to interest rates and the cost of new homes. Another negative factor is the significant increase in imports from 15 countries that are dumping product into the U.S. Countervailing duties and tariffs are pending, but if they are not high enough to stop imports, our industry will continue to lose jobs, and plants will be shut down.
- Legacy business has declined over the past year, and we do not see it returning anytime soon. Our company has taken a strategy to diversify our processes to allow new markets and products. This is possible through increased capital expenditure.
- Fewer governmental regulations would lower our cost of doing business. An example is the 332 report, which we must fill out for the U.S. government; it has no value for us, just expense.
- Annual merit-based pay increases for production employees take effect in April each year, which explains the wages increase. Demand is down versus the prior year but is holding steady. Several large capital projects are expected to be completed and invoices received in fourth quarter 2024.
- Business is in a state of flux. The elections I believe are affecting business decisions, and we expect this to continue for the foreseeable future.
- Business is extremely slow, and we see no signs of improvement. We think it will stay slow until after the presidential election, after which, we will either have four more years of slow business or an improving economy.
- I keep thinking we'll hit bottom and either level out or turn up, but we keep pushing those hopes out a month, and another month, and another. Forecasting and predicting have become rather challenging. We've got a few small jobs here and there, but nothing significant and nothing sustainable. It could wind up being a long, hot, slow summer for our operation.
- We are close to an inflection point of a cyclical bottom. Customers have been reducing inventory over the last several quarters, which looks to be coming to an end in most markets.
- Business has not been this slow since COVID, and I’m worried. A lot of competitors have been purchased by venture capitalists, and it is changing the way bids come out. We cannot compete in this changed industry. Being women-owned and a DBE [Disadvantaged Business Enterprise] is not helping.
- Industrial manufacturing is showing signs of positivity due to the possibility of an interest rate decrease. Please do it. Manufacturing is really hurting.
- Customer orders have dropped. The indication is the economy is hurting spending in our area specifically. Customer uncertainty is worsening.
- Business is generally good, but we're starting to see more customer resistance to prices. Our costs have increased dramatically over the last two years, and we have customers asking to hold prices to last year's level, which we just can't do. We continue to make capital investments to improve productivity and reduce unit labor cost.
- The business and political environment is terrible.
- Consumer confidence for consumer goods has noticeably worsened.
Historical Data
Historical data can be downloaded dating back to June 2004.
Indexes
Download indexes for all indicators. For the definitions of all variables, see Data Definitions.
| Unadjusted |
| Seasonally adjusted |
All Data
Download indexes and components of the indexes (percentage of respondents reporting increase, decrease, or no change). For the definitions of all variables, see Data Definitions.
| Unadjusted |
| Seasonally adjusted |
Questions regarding the Texas Business Outlook Surveys can be addressed to Emily Kerr at emily.kerr@dal.frb.org.
Sign up for our email alert to be automatically notified as soon as the latest Texas Manufacturing Outlook Survey is released on the web.