Texas Manufacturing Outlook Survey

Texas manufacturing activity weakens slightly in May
For this month’s survey, Texas business executives were asked supplemental questions on credit conditions. Results for these questions from the Texas Manufacturing Outlook Survey, Texas Service Sector Outlook Survey and Texas Retail Outlook Survey have been released together. Read the special questions results.
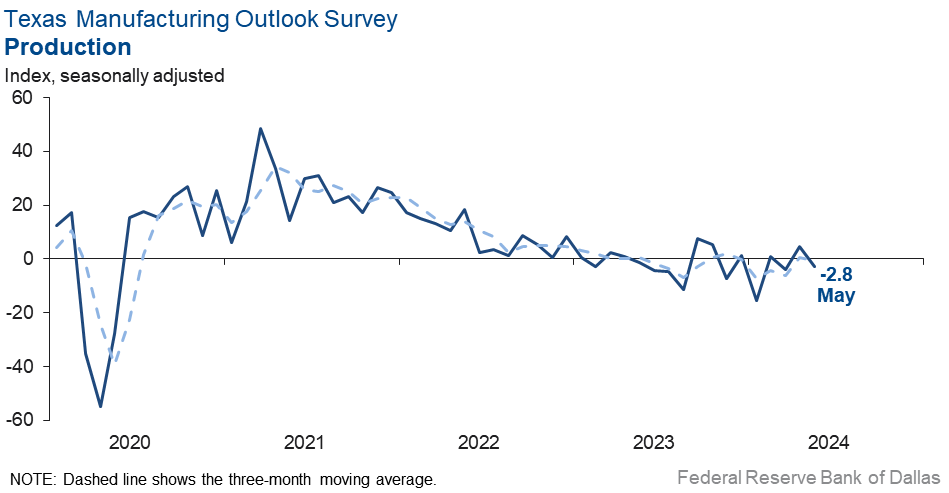
Texas factory activity edged down in May, according to business executives responding to the Texas Manufacturing Outlook Survey. The production index, a key measure of state manufacturing conditions, slipped from 4.8 to -2.8. The negative reading signals a slight decline in output from April.
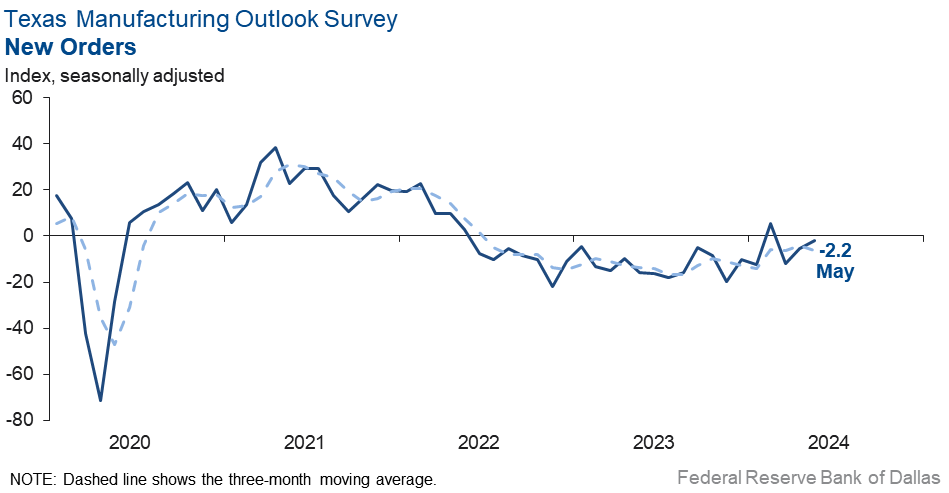
Other measures of manufacturing activity also suggested weaker activity this month. The new orders index remained negative, though it inched up to -2.2. The capacity utilization and shipments indexes slipped back into negative territory after turning positive last month, coming in at -2.0 and -3.0, respectively.
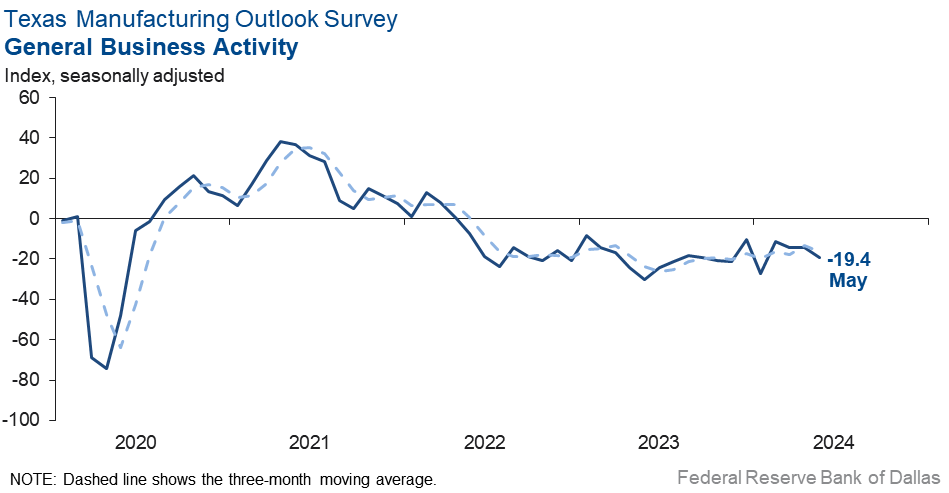
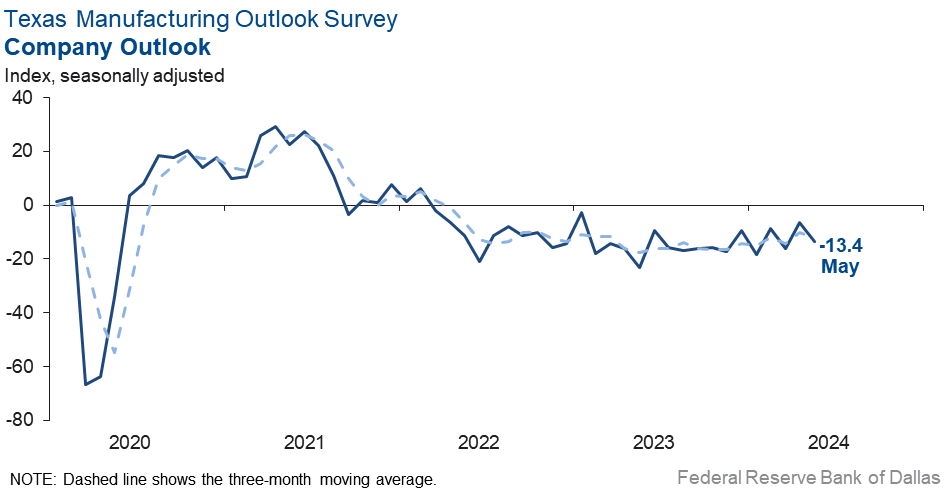
Perceptions of broader business conditions continued to worsen in May. The general business activity index moved down five points to -19.4, and the company outlook index fell seven points to -13.4. The outlook uncertainty index was largely unchanged at 16.4—near its historical average.
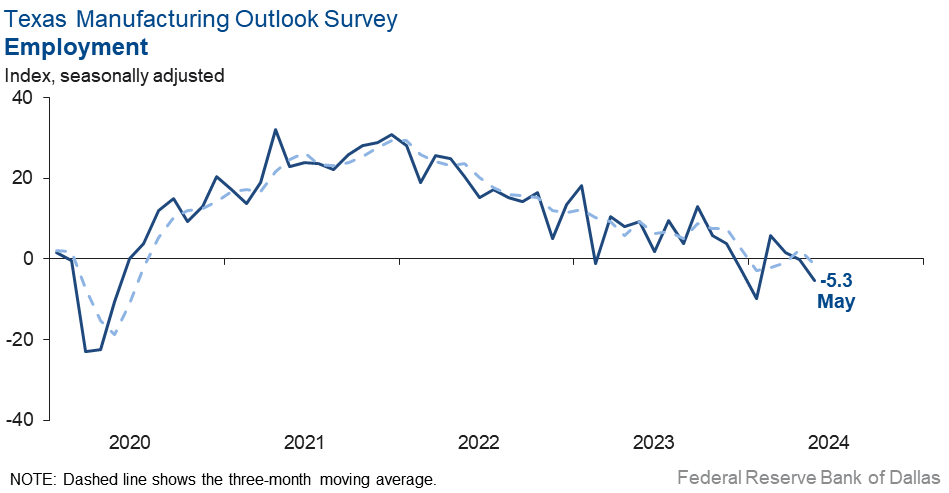
Labor market measures suggested modest employment declines and slightly shorter workweeks this month. The employment index slipped five points to -5.3. Nine percent of firms noted net hiring, while 14 percent noted net layoffs. The hours worked index held fairly steady at -3.7.
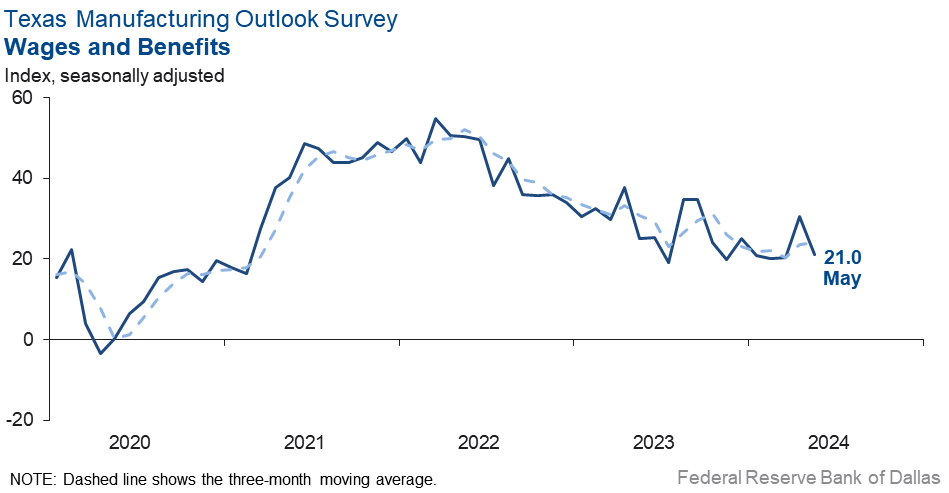
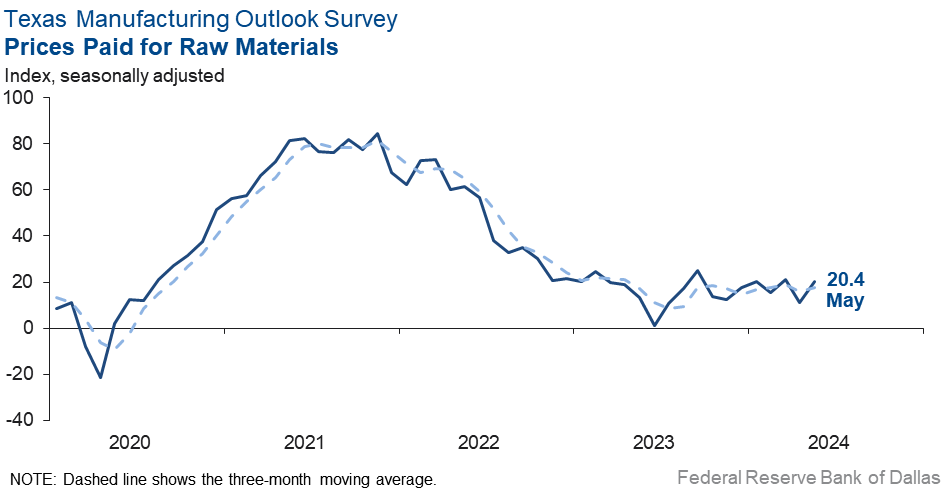
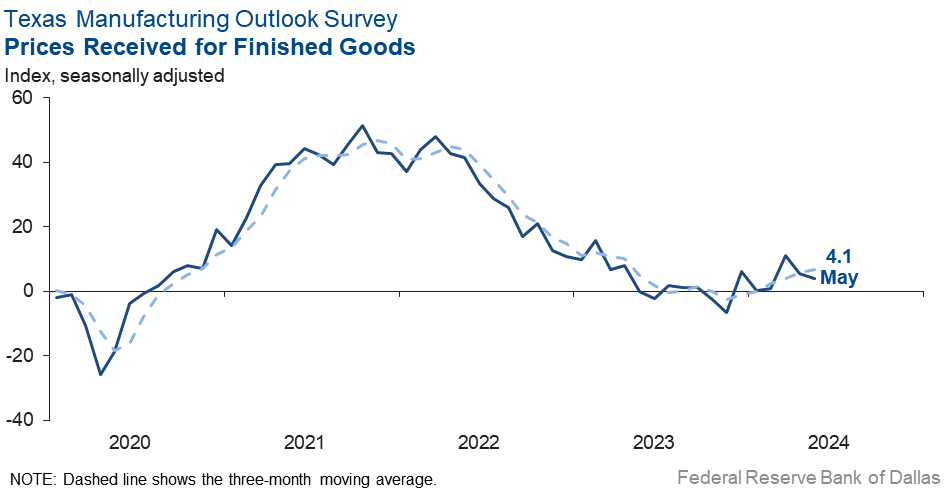
Upward pressure on prices and wages continued in May. The wages and benefits index retreated to an average level after spiking last month, coming in at 21.0. The raw materials prices index pushed up nine points to 20.4, still below its historical average. The finished goods prices index was largely unchanged at 4.1, also a below-average reading.
Expectations regarding future manufacturing activity were mixed in May. The future production index remained positive but retreated from 34.8 to 17.3. The future general business activity index slipped into negative territory, falling 11 points to -3.3. Most other measures of future manufacturing activity were slightly less positive this month.
Next release: Monday, June 24
Data were collected May 14–22, and 85 out of the 128 Texas manufacturers surveyed submitted a response. The Dallas Fed conducts the Texas Manufacturing Outlook Survey monthly to obtain a timely assessment of the state’s factory activity. Firms are asked whether output, employment, orders, prices and other indicators increased, decreased or remained unchanged over the previous month.
Survey responses are used to calculate an index for each indicator. Each index is calculated by subtracting the percentage of respondents reporting a decrease from the percentage reporting an increase. When the share of firms reporting an increase exceeds the share reporting a decrease, the index will be greater than zero, suggesting the indicator has increased over the prior month. If the share of firms reporting a decrease exceeds the share reporting an increase, the index will be below zero, suggesting the indicator has decreased over the prior month. An index will be zero when the number of firms reporting an increase is equal to the number of firms reporting a decrease. Data have been seasonally adjusted as necessary.
Results summary
Historical data are available from June 2004 to the most current release month.
| Business Indicators Relating to Facilities and Products in Texas Current (versus previous month) | ||||||||
| Indicator | May Index | Apr Index | Change | Series Average | Trend* | % Reporting Increase | % Reporting No Change | % Reporting Decrease |
Production | –2.8 | 4.8 | –7.6 | 9.9 | 1(–) | 21.6 | 54.0 | 24.4 |
Capacity Utilization | –2.0 | 4.2 | –6.2 | 7.9 | 1(–) | 19.7 | 58.5 | 21.7 |
New Orders | –2.2 | –5.3 | +3.1 | 5.2 | 3(–) | 24.9 | 48.1 | 27.1 |
Growth Rate of Orders | –10.1 | 3.8 | –13.9 | –0.6 | 1(–) | 20.1 | 49.7 | 30.2 |
Unfilled Orders | –3.1 | –5.9 | +2.8 | –2.1 | 8(–) | 12.6 | 71.7 | 15.7 |
Shipments | –3.0 | 5.0 | –8.0 | 8.3 | 1(–) | 22.6 | 51.8 | 25.6 |
Delivery Time | –9.2 | –0.3 | –8.9 | 0.9 | 14(–) | 6.9 | 77.0 | 16.1 |
Finished Goods Inventories | –2.4 | –5.8 | +3.4 | –3.2 | 2(–) | 13.1 | 71.4 | 15.5 |
Prices Paid for Raw Materials | 20.4 | 11.2 | +9.2 | 27.2 | 49(+) | 27.9 | 64.6 | 7.5 |
Prices Received for Finished Goods | 4.1 | 5.5 | –1.4 | 8.6 | 6(+) | 11.7 | 80.7 | 7.6 |
Wages and Benefits | 21.0 | 30.6 | –9.6 | 21.2 | 49(+) | 23.7 | 73.6 | 2.7 |
Employment | –5.3 | –0.1 | –5.2 | 7.6 | 2(–) | 9.0 | 76.7 | 14.3 |
Hours Worked | –3.7 | –2.3 | –1.4 | 3.4 | 8(–) | 9.9 | 76.5 | 13.6 |
Capital Expenditures | 16.8 | 11.1 | +5.7 | 6.6 | 8(+) | 27.6 | 61.6 | 10.8 |
| General Business Conditions Current (versus previous month) | ||||||||
| Indicator | May Index | Apr Index | Change | Series Average | Trend** | % Reporting Improved | % Reporting No Change | % Reporting Worsened |
Company Outlook | –13.4 | –6.3 | –7.1 | 4.6 | 27(–) | 11.9 | 62.8 | 25.3 |
General Business Activity | –19.4 | –14.5 | –4.9 | 0.9 | 25(–) | 9.8 | 61.0 | 29.2 |
| Indicator | May Index | Apr Index | Change | Series Average | Trend* | % Reporting Increase | % Reporting No Change | % Reporting Decrease |
Outlook Uncertainty | 16.4 | 17.3 | –0.9 | 17.2 | 37(+) | 28.2 | 60.0 | 11.8 |
| Business Indicators Relating to Facilities and Products in Texas Future (six months ahead) | ||||||||
| Indicator | May Index | Apr Index | Change | Series Average | Trend* | % Reporting Increase | % Reporting No Change | % Reporting Decrease |
Production | 17.3 | 34.8 | –17.5 | 36.3 | 49(+) | 33.4 | 50.5 | 16.1 |
Capacity Utilization | 17.4 | 29.4 | –12.0 | 33.2 | 49(+) | 31.9 | 53.6 | 14.5 |
New Orders | 13.2 | 25.4 | –12.2 | 33.7 | 19(+) | 29.2 | 54.8 | 16.0 |
Growth Rate of Orders | 7.0 | 19.4 | –12.4 | 24.8 | 12(+) | 26.2 | 54.6 | 19.2 |
Unfilled Orders | –0.2 | –3.2 | +3.0 | 2.8 | 3(–) | 12.1 | 75.6 | 12.3 |
Shipments | 15.2 | 29.4 | –14.2 | 34.7 | 49(+) | 33.1 | 49.0 | 17.9 |
Delivery Time | –1.2 | –4.2 | +3.0 | –1.5 | 2(–) | 9.4 | 80.0 | 10.6 |
Finished Goods Inventories | –3.8 | 2.5 | –6.3 | 0.0 | 1(–) | 12.7 | 70.9 | 16.5 |
Prices Paid for Raw Materials | 29.0 | 23.2 | +5.8 | 33.5 | 50(+) | 35.1 | 58.8 | 6.1 |
Prices Received for Finished Goods | 19.0 | 17.3 | +1.7 | 20.8 | 49(+) | 22.8 | 73.4 | 3.8 |
Wages and Benefits | 31.5 | 40.1 | –8.6 | 39.3 | 240(+) | 34.5 | 62.5 | 3.0 |
Employment | 13.4 | 20.2 | –6.8 | 22.9 | 48(+) | 24.4 | 64.6 | 11.0 |
Hours Worked | 10.2 | 7.2 | +3.0 | 8.8 | 2(+) | 16.6 | 77.0 | 6.4 |
Capital Expenditures | 14.9 | 11.9 | +3.0 | 19.4 | 48(+) | 24.9 | 65.1 | 10.0 |
| General Business Conditions Future (six months ahead) | ||||||||
| Indicator | May Index | Apr Index | Change | Series Average | Trend** | % Reporting Increase | % Reporting No Change | % Reporting Worsened |
Company Outlook | 4.9 | 14.9 | –10.0 | 18.2 | 6(+) | 25.7 | 53.5 | 20.8 |
General Business Activity | –3.3 | 7.9 | –11.2 | 12.2 | 1(–) | 21.6 | 53.5 | 24.9 |
*Shown is the number of consecutive months of expansion or contraction in the underlying indicator. Expansion is indicated by a positive index reading and denoted by a (+) in the table. Contraction is indicated by a negative index reading and denoted by a (–) in the table.
**Shown is the number of consecutive months of improvement or worsening in the underlying indicator. Improvement is indicated by a positive index reading and denoted by a (+) in the table. Worsening is indicated by a negative index reading and denoted by a (–) in the table.
Data have been seasonally adjusted as necessary.
Comments from survey respondents
These comments are from respondents’ completed surveys and have been edited for publication.
- Recent developments in the overall economy suggest consumers are resilient and still spending money. Though the Federal Reserve is unlikely to lower interest rates any time soon, the market seems to have adjusted to the delay. Inflation will continue to decline, slowly.
- Volume of new orders has picked up. Demand feels more robust right now than at the beginning of the year. We are still battling cost inflation on raw materials.
- We are still trying to find competent people who want to work. The biggest problem is turnover of new hires. Long-term employees are stable. Young people do not want to work.
- Orders are down approximately 10 percent.
- We have been very busy and having “hooray” billing months with very nice profits, but that is about to change as things seem to be slowing down, and we can tell that this may be a lean summer. We are fortunate to have some nice projects to carry us through the summer and help cover overhead, but we need additional work to make it be profitable. Our competitors have been really slow, so this does not bode well for our next few months.
- Our building and construction business remains off. Higher mortgage rates and higher home costs are the main factors. Fewer folks are buying first-time homes. More younger couples are moving into apartments.
- Things seem to be slowing down in our manufacturing sector.
- We have orders, but jobs are not being released due to financing holds and uncertainty.
- Business is flat at a relatively low level.
- It isn’t much fun to be in business right now, at least in our industry. Our sales team is putting forth a full-court press effort, and we've attempted to add services and product offerings to complement what we do, but it's just tough sledding and has been all year.
- We are reaching a cyclical bottom for most end markets after the post-COVID inventory build. We are expecting shipments to more closely follow end-market demand in the second half of 2024.
- Customer volumes are decreasing due to the economy. They are still bullish, but indicators based on outbound shipments show there will be fewer shipments in the future. Technology changes with AI [artificial intelligence] have increased technology deployment and are possibly going to increase production, but it's too early to be a contribution to growth in the next six to 12 months.
- Wage inflation continues to be our biggest issue. We are caught between a rock and a hard place; we have to increase wages to keep our best employees, but we also have to invest capital to improve productivity so we can eventually do more with fewer people. The combined result is substantially less free cash flow for this year and next. The tax increases that President Biden has announced as part of his reelection campaign will have a very significant negative impact on our ability to grow. We will be forced to slow down capital investment and reduce head count if he is reelected.
- Things are in a mess.
Historical Data
Historical data can be downloaded dating back to June 2004.
Indexes
Download indexes for all indicators. For the definitions of all variables, see Data Definitions.
| Unadjusted |
| Seasonally adjusted |
All Data
Download indexes and components of the indexes (percentage of respondents reporting increase, decrease, or no change). For the definitions of all variables, see Data Definitions.
| Unadjusted |
| Seasonally adjusted |
Questions regarding the Texas Business Outlook Surveys can be addressed to Emily Kerr at emily.kerr@dal.frb.org.
Sign up for our email alert to be automatically notified as soon as the latest Texas Manufacturing Outlook Survey is released on the web.