Texas Manufacturing Outlook Survey

Texas manufacturing activity stabilizes in June
For this month’s survey, Texas business executives were asked supplemental questions on wages, prices, capital expenditures, outlook concerns and supply-chain disruptions. Results for these questions from the Texas Manufacturing Outlook Survey, Texas Service Sector Outlook Survey and Texas Retail Outlook Survey have been released together. Read the special questions results.
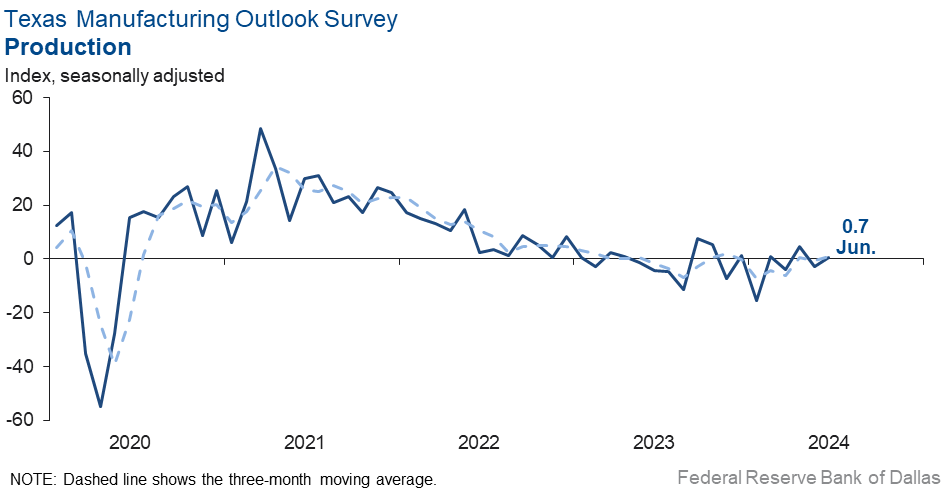
Texas factory activity was flat in June, according to business executives responding to the Texas Manufacturing Outlook Survey. The production index, a key measure of state manufacturing conditions, inched up to 0.7 from -2.8 in May. The near-zero reading signals little change in output after a slight decline over the prior period.
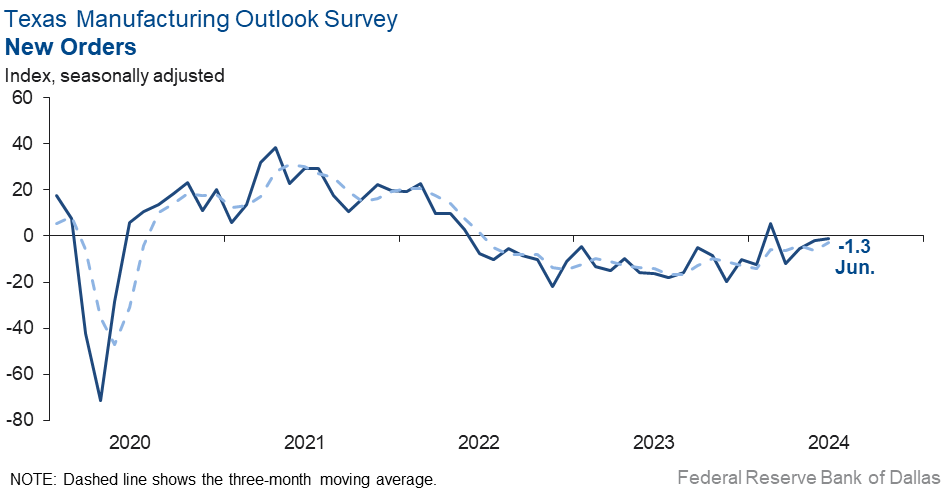
Other measures of manufacturing activity were mixed this month. The new orders index remained slightly negative, though it has moved up steadily over the past few months to -1.3 in June from -11.8 in March. The capacity utilization index slipped to -4.8 from -2.0, while the shipments index moved back into positive territory, climbing six points to 2.8.
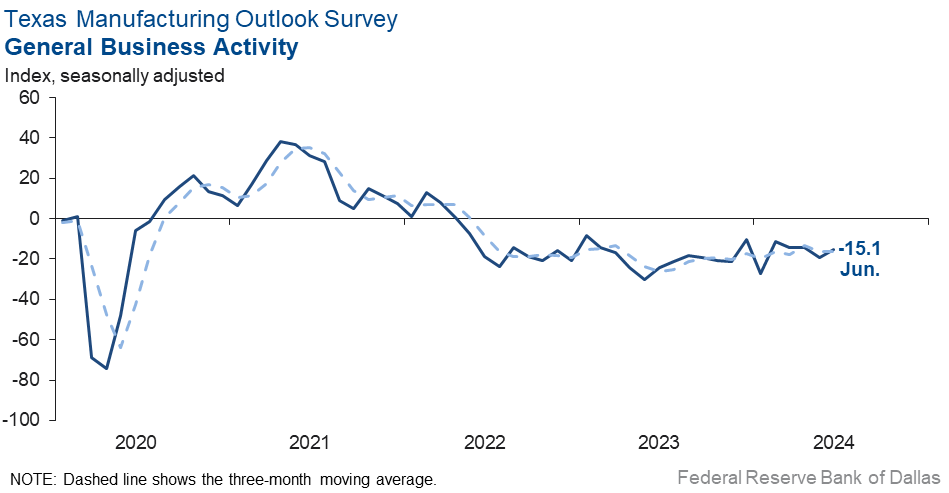
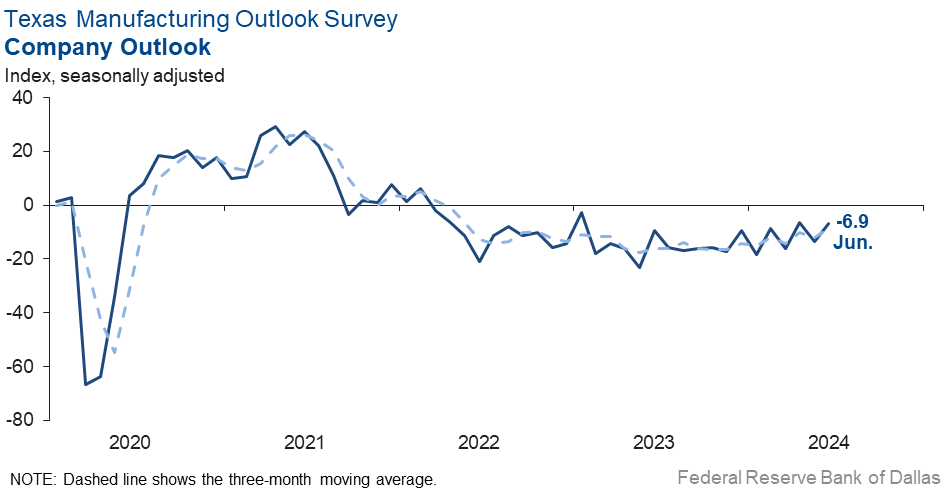
Perceptions of broader business conditions continued to worsen in June, though they were less negative than in May. The general business activity index pushed up to -15.1 from -19.4, and the company outlook index rose seven points to -6.9. The outlook uncertainty index retreated to 9.8, well below its historical average.
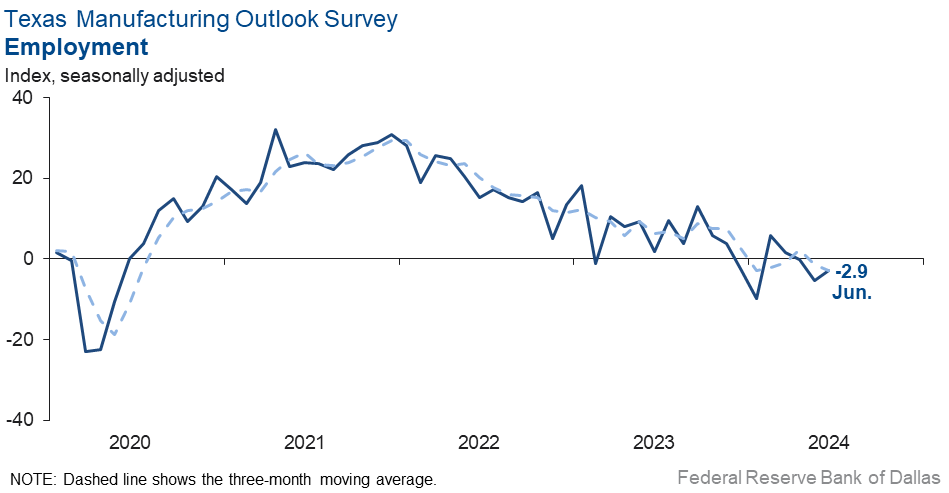
Labor market measures suggested slight employment declines and shorter workweeks this month. The employment index posted a second negative reading in a row but ticked up to -2.9. Seventeen percent of firms noted net hiring, while 20 percent noted net layoffs. The hours worked index held fairly steady at -5.0.
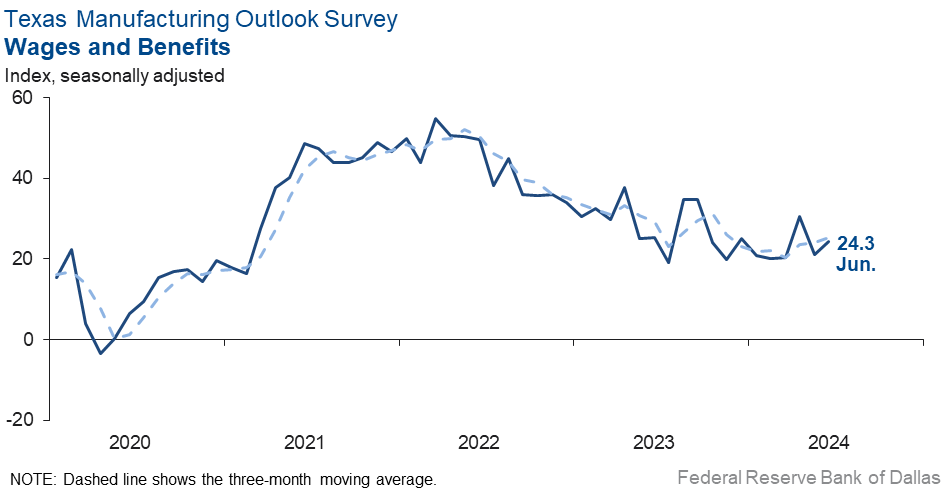
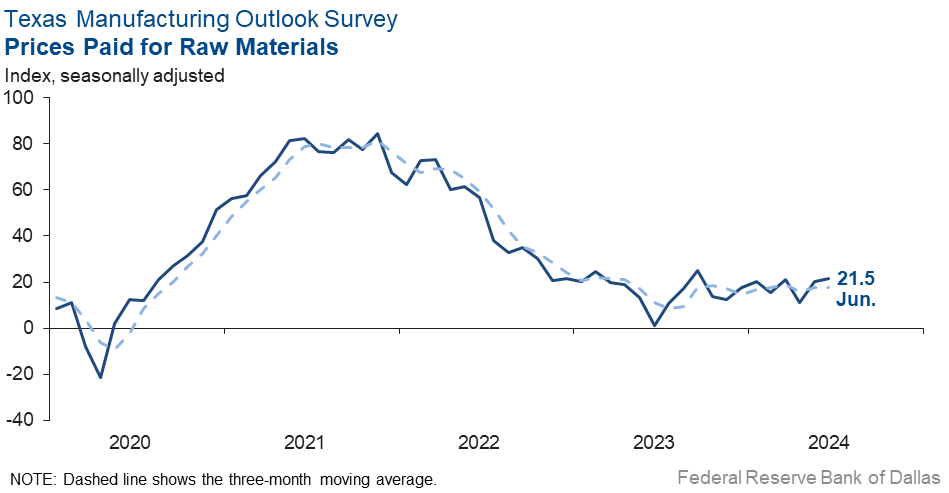
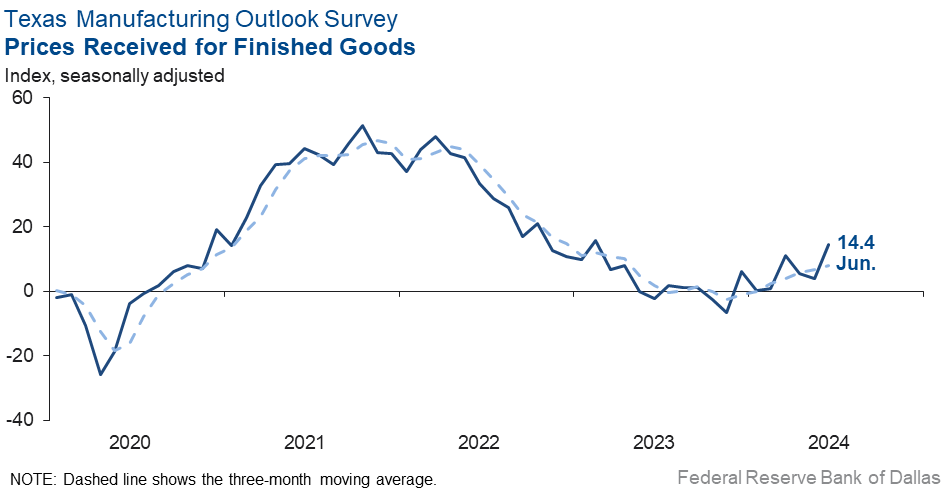
Upward pressure on prices and wages continued in June. The wages and benefits index edged up three points to 24.3, a reading slightly higher than average. The raw materials prices index was mostly unchanged at 21.5, still below its historical average, while the finished goods prices index shot up 10 points to 14.4.
Expectations regarding future manufacturing activity pushed up notably this month. The future production index jumped 10 points to 27.1, and the future general business activity index surged 16 points to 12.9, its highest reading since early 2022. Several other indexes of future manufacturing activity also rose this month, though expectations for employment and capital expenditures were slightly less positive than in May.
Next release: Monday, July 29
Data were collected June 10–18, and 83 out of the 125 Texas manufacturers surveyed submitted a response. The Dallas Fed conducts the Texas Manufacturing Outlook Survey monthly to obtain a timely assessment of the state’s factory activity. Firms are asked whether output, employment, orders, prices and other indicators increased, decreased or remained unchanged over the previous month.
Survey responses are used to calculate an index for each indicator. Each index is calculated by subtracting the percentage of respondents reporting a decrease from the percentage reporting an increase. When the share of firms reporting an increase exceeds the share reporting a decrease, the index will be greater than zero, suggesting the indicator has increased over the prior month. If the share of firms reporting a decrease exceeds the share reporting an increase, the index will be below zero, suggesting the indicator has decreased over the prior month. An index will be zero when the number of firms reporting an increase is equal to the number of firms reporting a decrease. Data have been seasonally adjusted as necessary.
Results summary
Historical data are available from June 2004 to the most current release month.
| Business Indicators Relating to Facilities and Products in Texas Current (versus previous month) | ||||||||
| Indicator | Jun Index | May Index | Change | Series Average | Trend* | % Reporting Increase | % Reporting No Change | % Reporting Decrease |
Production | 0.7 | –2.8 | +3.5 | 9.8 | 1(+) | 23.3 | 54.1 | 22.6 |
Capacity Utilization | –4.8 | –2.0 | –2.8 | 7.8 | 2(–) | 17.3 | 60.6 | 22.1 |
New Orders | –1.3 | –2.2 | +0.9 | 5.2 | 4(–) | 26.0 | 46.8 | 27.3 |
Growth Rate of Orders | –4.3 | –10.1 | +5.8 | –0.6 | 2(–) | 21.1 | 53.5 | 25.4 |
Unfilled Orders | –4.7 | –3.1 | –1.6 | –2.1 | 9(–) | 9.6 | 76.1 | 14.3 |
Shipments | 2.8 | –3.0 | +5.8 | 8.2 | 1(+) | 24.4 | 54.0 | 21.6 |
Delivery Time | –3.2 | –9.2 | +6.0 | 0.9 | 15(–) | 5.0 | 86.8 | 8.2 |
Finished Goods Inventories | –2.5 | –2.4 | –0.1 | –3.2 | 3(–) | 14.6 | 68.3 | 17.1 |
Prices Paid for Raw Materials | 21.5 | 20.4 | +1.1 | 27.2 | 50(+) | 28.8 | 63.9 | 7.3 |
Prices Received for Finished Goods | 14.4 | 4.1 | +10.3 | 8.6 | 7(+) | 17.1 | 80.2 | 2.7 |
Wages and Benefits | 24.3 | 21.0 | +3.3 | 21.2 | 50(+) | 25.8 | 72.7 | 1.5 |
Employment | –2.9 | –5.3 | +2.4 | 7.5 | 3(–) | 16.7 | 63.7 | 19.6 |
Hours Worked | –5.0 | –3.7 | –1.3 | 3.3 | 9(–) | 10.1 | 74.8 | 15.1 |
Capital Expenditures | 0.9 | 16.8 | –15.9 | 6.6 | 9(+) | 17.0 | 66.9 | 16.1 |
| General Business Conditions Current (versus previous month) | ||||||||
| Indicator | Jun Index | May Index | Change | Series Average | Trend** | % Reporting Improved | % Reporting No Change | % Reporting Worsened |
Company Outlook | –6.9 | –13.4 | +6.5 | 4.6 | 28(–) | 14.9 | 63.3 | 21.8 |
General Business Activity | –15.1 | –19.4 | +4.3 | 0.8 | 26(–) | 10.5 | 63.9 | 25.6 |
| Indicator | Jun Index | May Index | Change | Series Average | Trend* | % Reporting Increase | % Reporting No Change | % Reporting Decrease |
Outlook Uncertainty | 9.8 | 16.4 | –6.6 | 17.1 | 38(+) | 24.4 | 61.0 | 14.6 |
| Business Indicators Relating to Facilities and Products in Texas Future (six months ahead) | ||||||||
| Indicator | Jun Index | May Index | Change | Series Average | Trend* | % Reporting Increase | % Reporting No Change | % Reporting Decrease |
Production | 27.1 | 17.3 | +9.8 | 36.3 | 50(+) | 41.7 | 43.7 | 14.6 |
Capacity Utilization | 21.3 | 17.4 | +3.9 | 33.2 | 50(+) | 36.1 | 49.1 | 14.8 |
New Orders | 29.8 | 13.2 | +16.6 | 33.7 | 20(+) | 43.0 | 43.7 | 13.2 |
Growth Rate of Orders | 24.5 | 7.0 | +17.5 | 24.8 | 13(+) | 34.3 | 55.9 | 9.8 |
Unfilled Orders | –2.9 | –0.2 | –2.7 | 2.8 | 4(–) | 8.9 | 79.3 | 11.8 |
Shipments | 28.1 | 15.2 | +12.9 | 34.7 | 50(+) | 42.5 | 43.1 | 14.4 |
Delivery Time | –0.4 | –1.2 | +0.8 | –1.5 | 3(–) | 6.8 | 86.0 | 7.2 |
Finished Goods Inventories | –8.0 | –3.8 | –4.2 | 0.0 | 2(–) | 9.3 | 73.3 | 17.3 |
Prices Paid for Raw Materials | 21.2 | 29.0 | –7.8 | 33.4 | 51(+) | 28.0 | 65.2 | 6.8 |
Prices Received for Finished Goods | 19.5 | 19.0 | +0.5 | 20.8 | 50(+) | 26.0 | 67.5 | 6.5 |
Wages and Benefits | 33.2 | 31.5 | +1.7 | 39.3 | 241(+) | 34.8 | 63.6 | 1.6 |
Employment | 11.7 | 13.4 | –1.7 | 22.8 | 49(+) | 25.2 | 61.3 | 13.5 |
Hours Worked | 3.0 | 10.2 | –7.2 | 8.8 | 3(+) | 13.0 | 77.0 | 10.0 |
Capital Expenditures | 12.6 | 14.9 | –2.3 | 19.4 | 49(+) | 25.5 | 61.6 | 12.9 |
| General Business Conditions Future (six months ahead) | ||||||||
| Indicator | Jun Index | May Index | Change | Series Average | Trend** | % Reporting Increase | % Reporting No Change | % Reporting Worsened |
Company Outlook | 22.9 | 4.9 | +18.0 | 18.3 | 7(+) | 32.9 | 57.1 | 10.0 |
General Business Activity | 12.9 | –3.3 | +16.2 | 12.2 | 1(+) | 26.2 | 60.5 | 13.3 |
*Shown is the number of consecutive months of expansion or contraction in the underlying indicator. Expansion is indicated by a positive index reading and denoted by a (+) in the table. Contraction is indicated by a negative index reading and denoted by a (–) in the table.
**Shown is the number of consecutive months of improvement or worsening in the underlying indicator. Improvement is indicated by a positive index reading and denoted by a (+) in the table. Worsening is indicated by a negative index reading and denoted by a (–) in the table.
Data have been seasonally adjusted as necessary.
Comments from survey respondents
These comments are from respondents’ completed surveys and have been edited for publication.
- We have been fortunate to be on the receiving end of some of our competition’s breakdowns/challenges.
- Markets are stabilizing, raw material costs have stopped increasing (seasonally), and demand for our products feels strong.
- We just added two new retail customers. It is mixed news—it is always good to have growth, but we are having trouble maintaining our production line. We had 25 percent turnover this year.
- We are really neutral at this time on our outlook.
- We are starting to see things slow down, and while many in our industry continue to be slow, we are pretty busy. We had “hooray” billing in both April and May, so I'm sure June will be less. It is hard to figure out why we have been so busy when many are not. Perhaps it’s just luck of the draw with our customers needing us more than their customers needed them?
- Our overall building and construction sales continue downward for the majority of our customers. Decreased housing starts, increased mortgage rates and overall housing costs are hampering this market. Our transportation market is off as well. Trailer orders are down, resulting in fewer being built.
- Legacy work has declined over the past 1.5 years and has not changed. Looking forward, we will be adding product offerings not previously supplied to bolster business.
- We are continuing to align production capacity to the lower order volumes projected for 2024.
- We have a good backlog, but owners have slowed down their approvals of projects and start dates for the projects we have purchase orders for.
- The summer doldrums are upon us! Orders are hard to come by, layoffs have been made, and the future really doesn't look that encouraging at the present. Our sales team is flipping every rock, our "creative" team is looking far and wide for new ideas, and our operations team is squeezing out every penny they can.
- We saw a small spurt of incoming work from long-time repeat customers, but overall it is still a very volatile work environment. We would like to hire but cannot: a) guarantee long-term employment and b) find skilled help.
- Business is slowing.
- Business remains sluggish at best. We see no signs of improvement and anticipate that there will be no major changes in economic activity before the election.
- We are seeing the expected cyclical bottom forming. Markets are still asynchronous.
- High interest rates are still playing a major role in the industrial capital equipment industry.
- While we still have a very large production backlog that is allowing us to continue to increase production and capacity utilization, our volume of new orders has slowed substantially, causing us to reevaluate longer-term plans.
- [Labor shortages in] skilled trades in millwork manufacturing, installation and CNC [computer numerical controlled equipment] operators continue to be the largest inhibitor of our growth.
- I think the election and fear of world conflict is scaring buyers from ordering nonessential material.
Historical Data
Historical data can be downloaded dating back to June 2004.
Indexes
Download indexes for all indicators. For the definitions of all variables, see Data Definitions.
| Unadjusted |
| Seasonally adjusted |
All Data
Download indexes and components of the indexes (percentage of respondents reporting increase, decrease, or no change). For the definitions of all variables, see Data Definitions.
| Unadjusted |
| Seasonally adjusted |
Questions regarding the Texas Business Outlook Surveys can be addressed to Emily Kerr at emily.kerr@dal.frb.org.
Sign up for our email alert to be automatically notified as soon as the latest Texas Manufacturing Outlook Survey is released on the web.