Texas Manufacturing Outlook Survey


Texas factory output growth slows to a moderate pace, outlooks stable
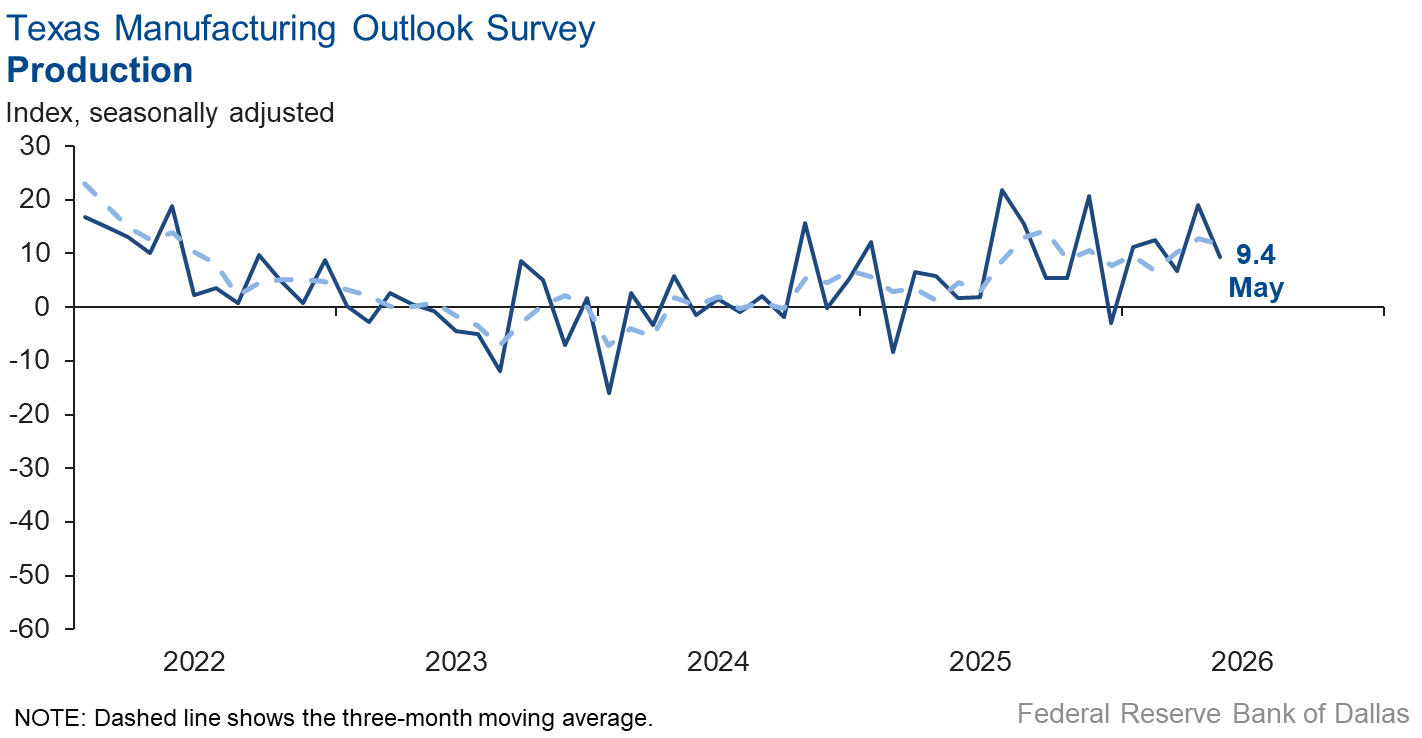
Texas manufacturing output growth decelerated in May, according to business executives responding to the Texas Manufacturing Outlook Survey. The production index, a key measure of state manufacturing conditions, fell 10 points to 9.4, a reading suggestive of an average pace of output expansion.
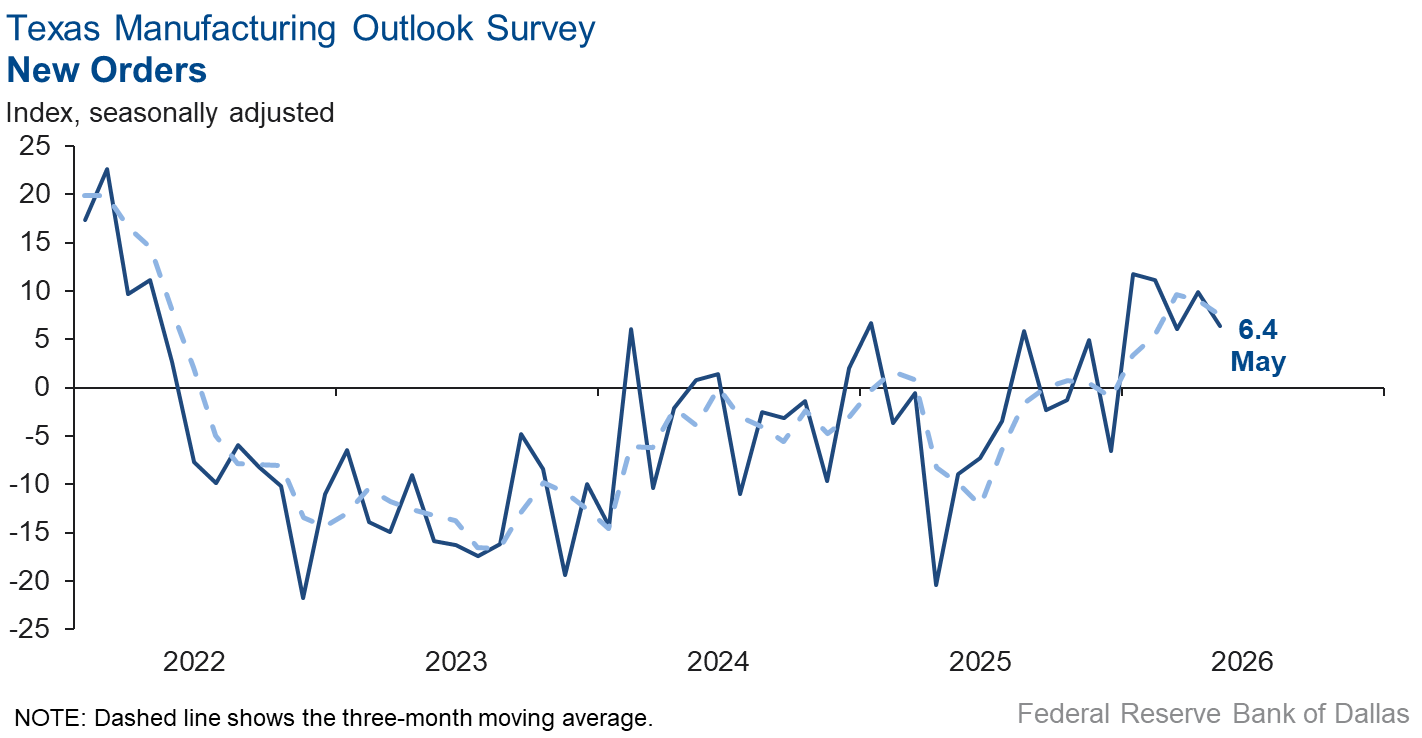
Other measures of manufacturing activity also remained positive but showed signs of slower growth this month. The capacity utilization index plunged 15 points to 5.2, the new orders index dipped four points to 6.4, and the shipments index fell eight points to 7.4.
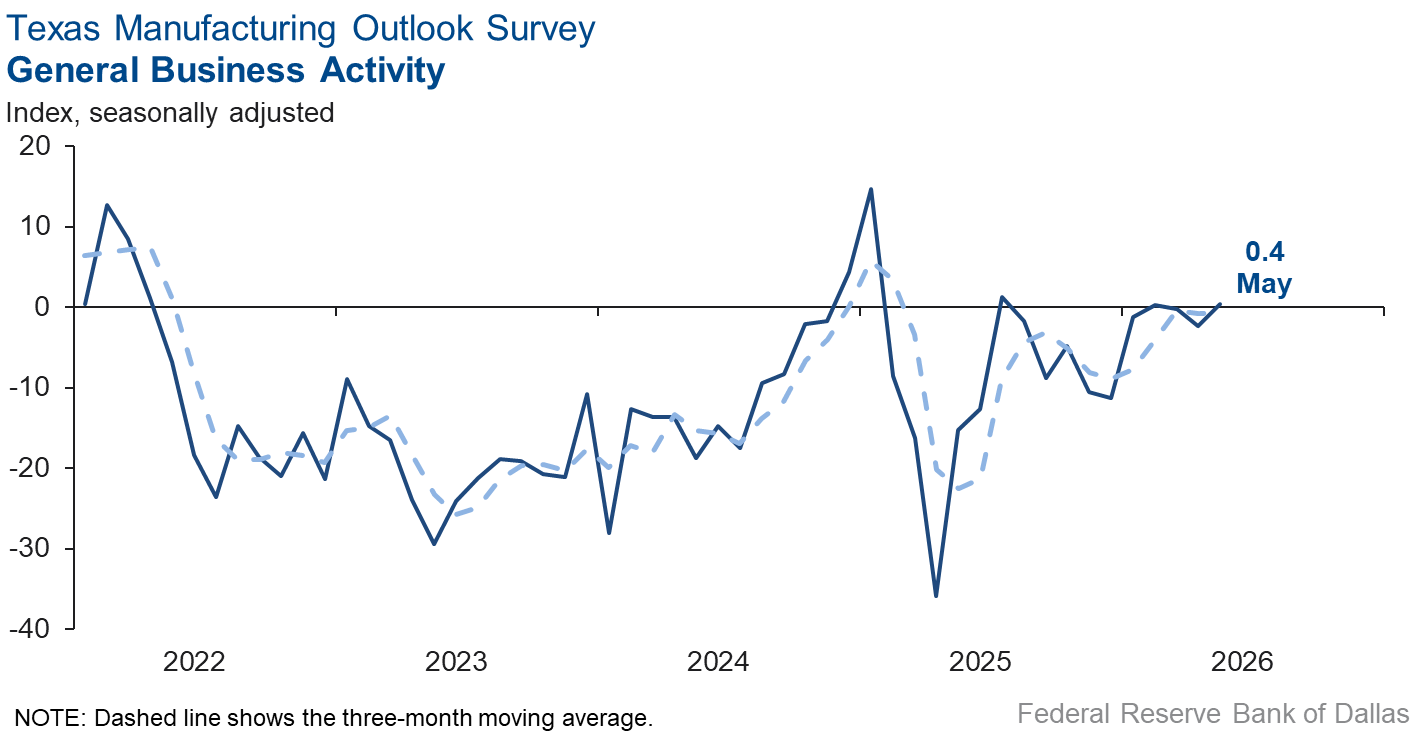
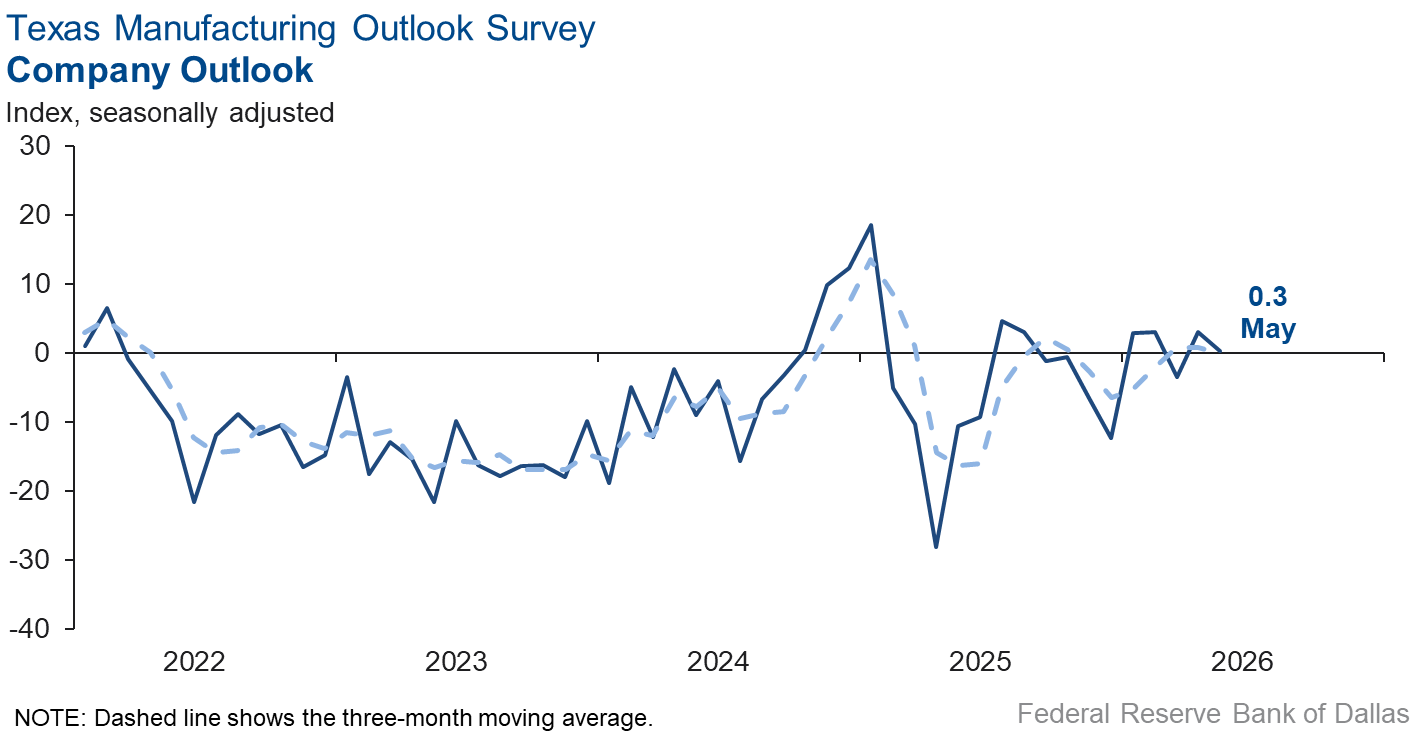
Perceptions of broader business conditions were stable in May. The general business activity index edged up three points to 0.4, with the near-zero reading indicating no change in activity from April. Similarly, the company outlook index came in at 0.3, down from 3.0, with the near-zero May reading signaling no change in outlooks. The outlook uncertainty index was little changed at 19.2, remaining above the series average of 16.9.
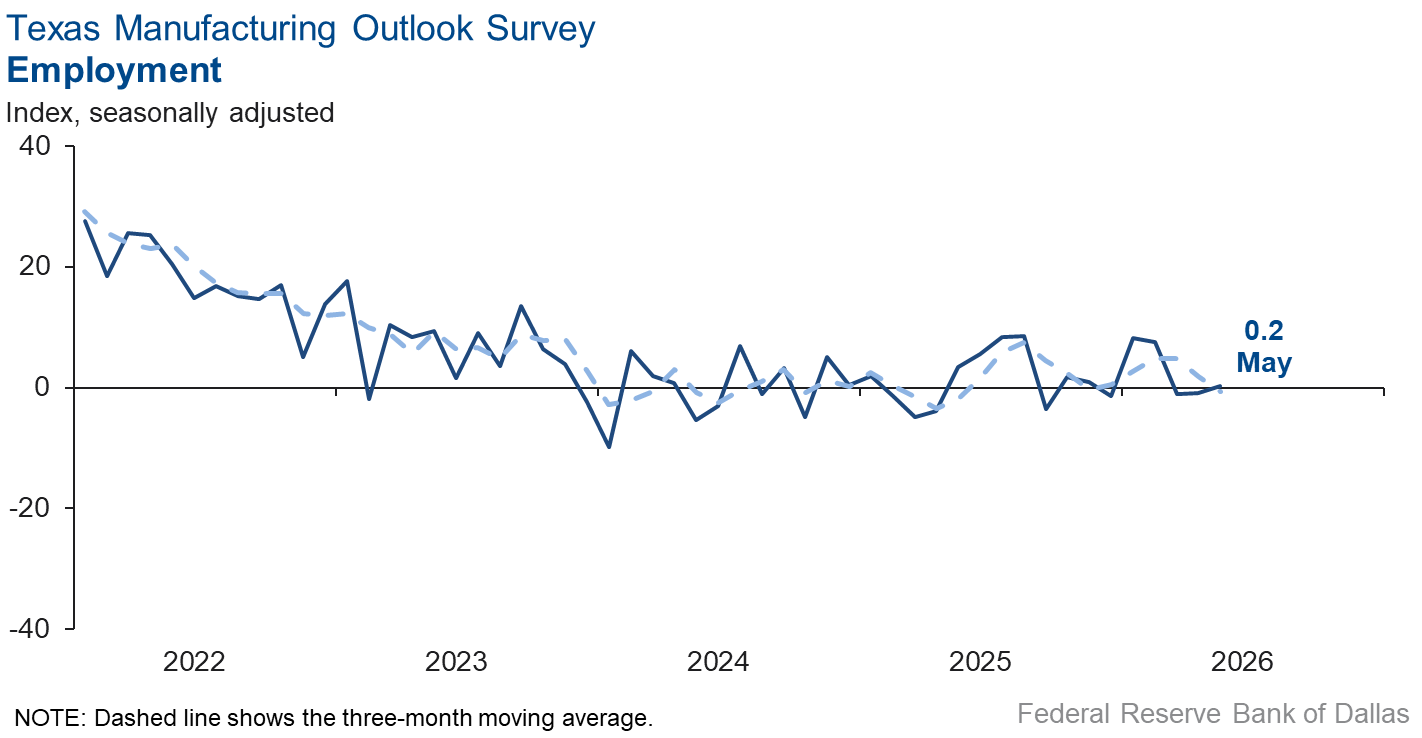
Employment continued to be flat, and workweeks held steady in May. The employment index was unchanged at 0.2, indicating no change in payrolls from April. The hours worked index moved down to 1.8 from 4.0.
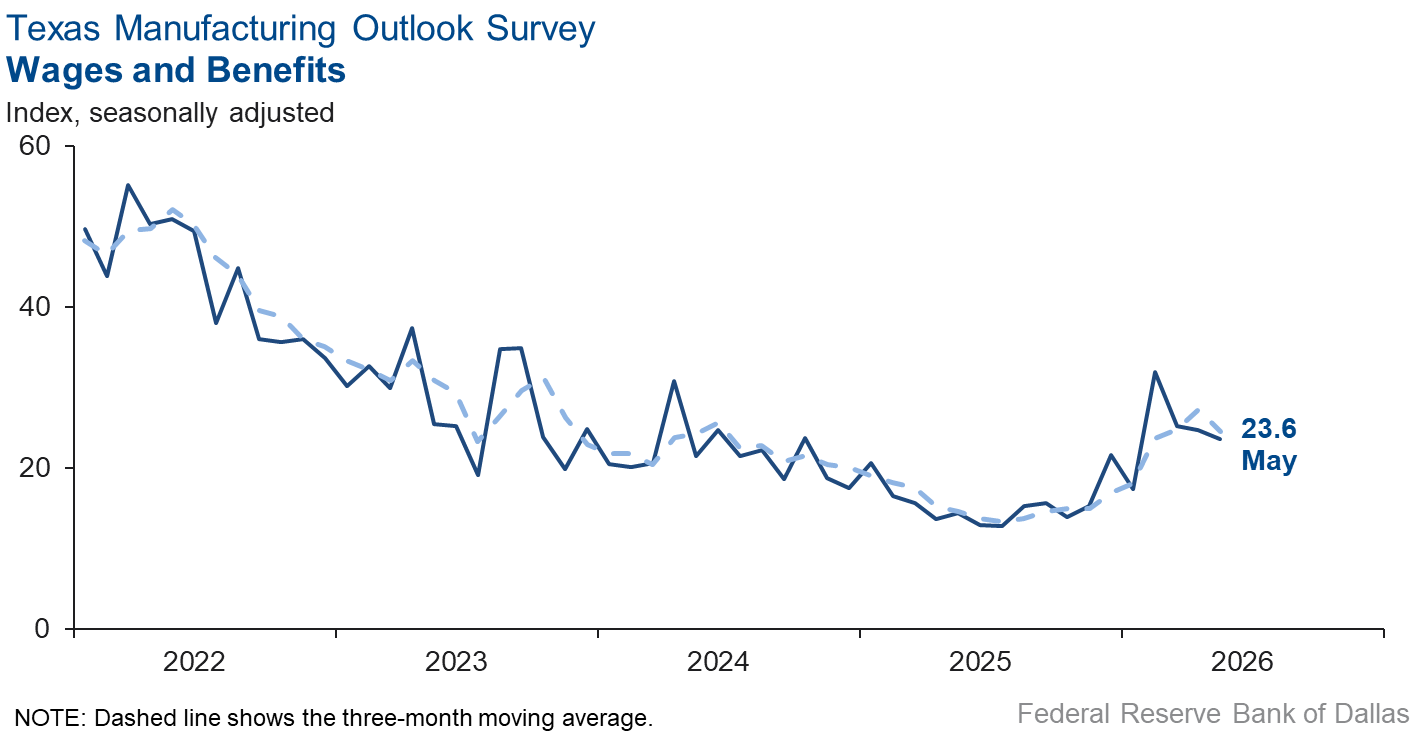
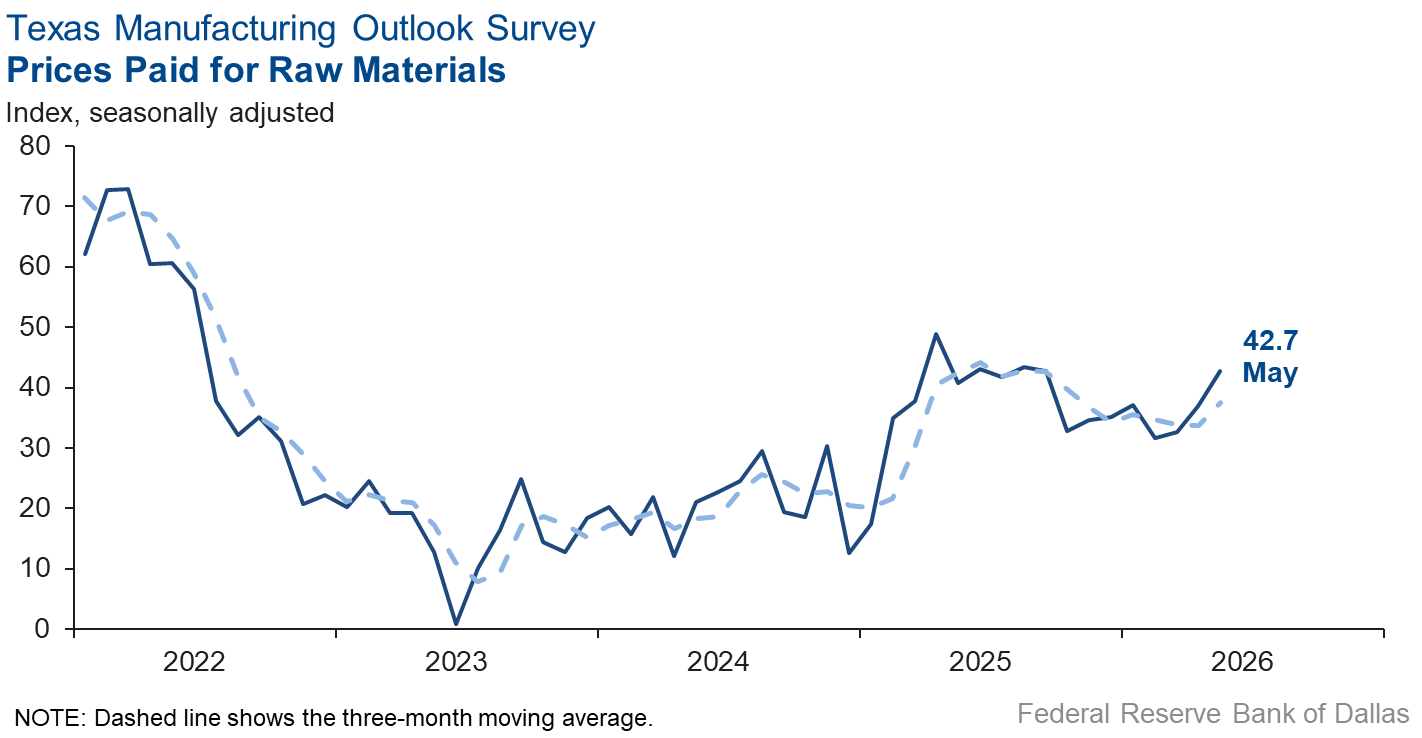
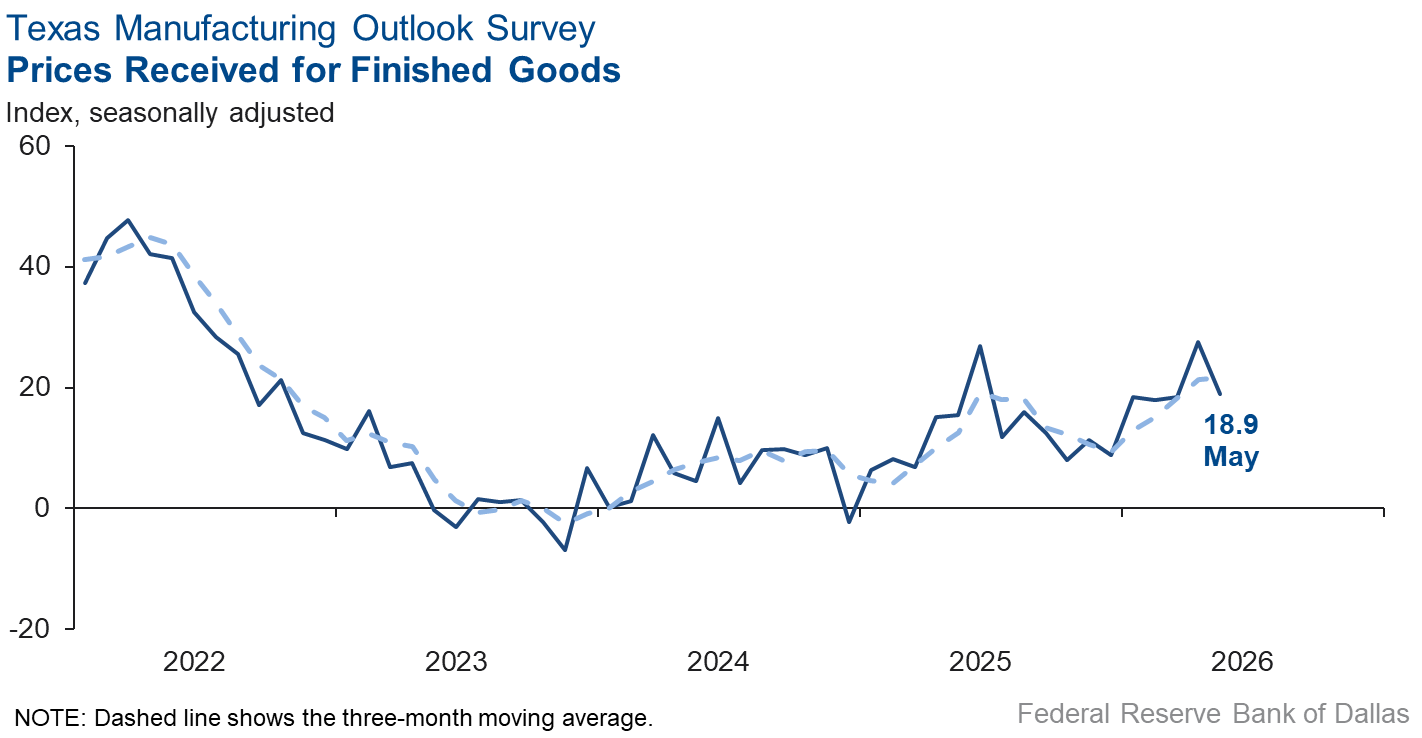
Input price pressures increased, selling price pressures eased, and wage pressures held steady this month. The raw materials prices index rose six points to 42.7, its highest level in eight months, while the finished goods prices index fell nine points to 18.9. The wages and benefits index was relatively unchanged at 23.6.
Expectations are for increased manufacturing activity six months from now. The future production index was little changed at 36.8, and the future general business activity index came in at 14.3, unchanged from last month. Other indexes of future manufacturing activity remained in positive territory.
Next release: Monday, June 29
Data were collected May 12–20, and 75 of the 114 Texas manufacturers surveyed submitted responses. The Dallas Fed conducts the Texas Manufacturing Outlook Survey monthly to obtain a timely assessment of the state’s factory activity. Firms are asked whether output, employment, orders, prices and other indicators increased, decreased or remained unchanged over the previous month.
Survey responses are used to calculate an index for each indicator. Each index is calculated by subtracting the percentage of respondents reporting a decrease from the percentage reporting an increase. When the share of firms reporting an increase exceeds the share reporting a decrease, the index will be greater than zero, suggesting the indicator has increased over the prior month. If the share of firms reporting a decrease exceeds the share reporting an increase, the index will be below zero, suggesting the indicator has decreased over the prior month. An index will be zero when the number of firms reporting an increase is equal to the number of firms reporting a decrease. Data have been seasonally adjusted as necessary.
Results summary
Historical data are available from June 2004 to the most current release month.
| Business Indicators Relating to Facilities and Products in Texas Current (versus previous month) | ||||||||
| Indicator | May Index | Apr Index | Change | Series Average | Trend* | % Reporting Increase | % Reporting No Change | % Reporting Decrease |
Production | 9.4 | 19.0 | –9.6 | 9.6 | 5(+) | 27.9 | 53.6 | 18.5 |
Capacity Utilization | 5.2 | 19.8 | –14.6 | 7.5 | 5(+) | 25.1 | 55.0 | 19.9 |
New Orders | 6.4 | 9.9 | –3.5 | 4.7 | 5(+) | 30.5 | 45.3 | 24.1 |
Growth Rate of Orders | –2.9 | 8.5 | –11.4 | –1.1 | 1(–) | 21.8 | 53.5 | 24.7 |
Unfilled Orders | 3.3 | –6.5 | +9.8 | –2.7 | 1(+) | 18.3 | 66.7 | 15.0 |
Shipments | 7.4 | 15.0 | –7.6 | 7.8 | 5(+) | 30.7 | 46.0 | 23.3 |
Delivery Time | 1.4 | –7.4 | +8.8 | 0.5 | 1(+) | 13.7 | 74.0 | 12.3 |
Finished Goods Inventories | –12.0 | –12.1 | +0.1 | –3.4 | 3(–) | 13.3 | 61.3 | 25.3 |
Prices Paid for Raw Materials | 42.7 | 37.0 | +5.7 | 27.8 | 73(+) | 46.2 | 50.3 | 3.5 |
Prices Received for Finished Goods | 18.9 | 27.6 | –8.7 | 9.0 | 17(+) | 22.7 | 73.5 | 3.8 |
Wages and Benefits | 23.6 | 24.8 | –1.2 | 21.0 | 73(+) | 26.1 | 71.4 | 2.5 |
Employment | 0.2 | –0.9 | +1.1 | 7.0 | 1(+) | 17.7 | 64.8 | 17.5 |
Hours Worked | 1.8 | 4.0 | –2.2 | 3.0 | 5(+) | 15.6 | 70.6 | 13.8 |
Capital Expenditures | 6.0 | 3.1 | +2.9 | 6.6 | 3(+) | 19.2 | 67.6 | 13.2 |
| General Business Conditions Current (versus previous month) | ||||||||
| Indicator | May Index | Apr Index | Change | Series Average | Trend** | % Reporting Improved | % Reporting No Change | % Reporting Worsened |
Company Outlook | 0.3 | 3.0 | –2.7 | 4.0 | 2(+) | 25.6 | 49.2 | 25.3 |
General Business Activity | 0.4 | –2.3 | +2.7 | 0.2 | 1(+) | 24.8 | 50.7 | 24.4 |
| Indicator | May Index | Apr Index | Change | Series Average | Trend* | % Reporting Increase | % Reporting No Change | % Reporting Decrease |
Outlook Uncertainty | 19.2 | 17.9 | +1.3 | 16.9 | 5(+) | 32.9 | 53.4 | 13.7 |
| Business Indicators Relating to Facilities and Products in Texas Future (six months ahead) | ||||||||
| Indicator | May Index | Apr Index | Change | Series Average | Trend* | % Reporting Increase | % Reporting No Change | % Reporting Decrease |
Production | 36.8 | 34.6 | +2.2 | 36.0 | 73(+) | 50.7 | 35.4 | 13.9 |
Capacity Utilization | 28.5 | 37.4 | –8.9 | 32.8 | 73(+) | 45.7 | 37.1 | 17.2 |
New Orders | 28.6 | 31.4 | –2.8 | 33.4 | 43(+) | 42.8 | 43.0 | 14.2 |
Growth Rate of Orders | 12.9 | 24.4 | –11.5 | 24.6 | 33(+) | 29.1 | 54.7 | 16.2 |
Unfilled Orders | 0.0 | 6.0 | –6.0 | 2.7 | 1() | 14.3 | 71.4 | 14.3 |
Shipments | 33.7 | 36.3 | –2.6 | 34.3 | 73(+) | 49.5 | 34.8 | 15.8 |
Delivery Time | 3.1 | –2.2 | +5.3 | –1.3 | 1(+) | 13.1 | 76.9 | 10.0 |
Finished Goods Inventories | –2.9 | 4.9 | –7.8 | –0.2 | 1(–) | 15.7 | 65.7 | 18.6 |
Prices Paid for Raw Materials | 44.9 | 47.3 | –2.4 | 34.1 | 74(+) | 53.1 | 38.7 | 8.2 |
Prices Received for Finished Goods | 28.1 | 38.1 | –10.0 | 21.8 | 73(+) | 36.6 | 54.9 | 8.5 |
Wages and Benefits | 37.9 | 35.5 | +2.4 | 39.0 | 264(+) | 43.8 | 50.3 | 5.9 |
Employment | 17.9 | 21.6 | –3.7 | 22.7 | 72(+) | 33.6 | 50.7 | 15.7 |
Hours Worked | 11.8 | 0.7 | +11.1 | 8.5 | 3(+) | 20.5 | 70.8 | 8.7 |
Capital Expenditures | 12.6 | 21.6 | –9.0 | 19.3 | 72(+) | 29.3 | 54.0 | 16.7 |
| General Business Conditions Future (six months ahead) | ||||||||
| Indicator | May Index | Apr Index | Change | Series Average | Trend** | % Reporting Increase | % Reporting No Change | % Reporting Worsened |
Company Outlook | 16.5 | 15.6 | +0.9 | 18.2 | 13(+) | 34.6 | 47.3 | 18.1 |
General Business Activity | 14.3 | 14.1 | +0.2 | 12.3 | 13(+) | 32.4 | 49.5 | 18.1 |
*Shown is the number of consecutive months of expansion or contraction in the underlying indicator. Expansion is indicated by a positive index reading and denoted by a (+) in the table. Contraction is indicated by a negative index reading and denoted by a (–) in the table.
**Shown is the number of consecutive months of improvement or worsening in the underlying indicator. Improvement is indicated by a positive index reading and denoted by a (+) in the table. Worsening is indicated by a negative index reading and denoted by a (–) in the table.
Data have been seasonally adjusted as necessary.
Comments from survey respondents
Survey participants are given the opportunity to submit comments on current issues that may be affecting their businesses. Some comments have been edited for grammar and clarity.
- High energy prices, erratic government policies, lots of spending and no attention to how we are going to deal with the ever-growing national deficit and national debt continue to create uncertainty. Our customers are definitely feeling the increase in gasoline costs.
- Conflict in the Middle East, the closure of the Strait [of Hormuz] and elevated oil prices have reduced supply of polyolefins and raised the cost of oil-based feedstocks for polyolefins in Europe and Asia, causing sharp increases in export prices, which are being matched domestically. Shipments of polyolefins have increased from the U.S., but exports from China of coal-based feedstock for PVC (polyvinyl chloride), which doesn't use oil-based feedstocks, has flooded the global market, so PVC prices rose in March and April but are now declining.
- I keep waiting for the other shoe to drop as increased fuel prices filter through the economy, but we haven't seen a major impact yet.
- The change in government spending has hurt our chances of keeping the doors open.
- Peak demand cycle [is] midyear. [Demand will] still be strong later in the year but will ease back to more normal levels.
- [We] have received new orders that have improved our immediate outlook. More importantly, [there is] indication of an improved business environment.
- [There is] uncertain federal policy at USDA (United States Department of Agriculture). The effect of overall economic conditions upon our purchasing customers [is uncertain].
- Volume is up with some new customers. Also, [we] recently completed a refinance that increased liquidity, decreased company uncertainty and improved the company outlook.
- [With] possible signs of a slowdown, [our] main concern is inflation.
- Uncertainty continues to play a big role in capital expenditure decisions. We are not investing in fixed assets but are focusing all resources on reserves and ongoing operations, outsourcing more and establishing new alliances. The climate for oil and gas, despite higher prices at the pump, is by no means favorable for the industry. There is constant pressure to lower prices for the U.S. market as external factors increase to capture a very competitive, but not surprisingly shrinking, market.
- What a blessed time we are in presently! Orders are up, output is steady and growth is full throttle. These periods are infrequent, when everything is forward-facing, rowing in tandem and prosperous. We're very grateful and pray that the good times keep on rolling for an extended period.
- Tariffs were a disaster! Everyone paid them, but only a few received refunds.
- Business remains strong; however, we are experiencing many price increases for raw materials that we are having to pass on to customers.
- Business volume continues to grow, driven by increased market share and strong internal sales efforts. However, we are navigating several margin pressures. Slow pay is being observed across customer segments, and while price increases have met some customer resistance, we have been successful in implementing them through continued engagement efforts. On the cost side, supplier price increases and fuel surcharges are mounting, compounded by uncertainty around tariff changes and a sharp uptick in fuel prices. Keeping pace with these escalating input costs and passing them through to customers in a timely manner remains a key concern.
- [There’s been a] slight uptick in activity.
- The administration’s April proclamation requiring importers of aluminum products to pay Section 232 tariffs on the full value of the aluminum content, including the Midwest Premium, has already helped spur some domestic onshoring activity. However, certain foreign extrusion companies continue exporting into the United States while absorbing the tariff costs and still pricing below domestic producers. We believe foreign government subsidies supporting exports to the U.S. market are once again becoming a significant concern. Our primary concern moving forward is that the administration does not grant Section 232 exemptions to Mexico or Canada during upcoming USMCA (United States-Mexico-Canada Agreement) negotiations. If Mexico receives broad exemptions, we believe the market will quickly return to the conditions experienced under NAFTA (North American Free Trade Agreement), when Chinese-owned operations established manufacturing facilities in Mexico using imported Chinese labor and materials to circumvent U.S. tariffs. Under that structure, raw aluminum products, extrusions and downstream-finished goods such as windows and doors were shipped into the United States at artificially low price levels. A repeat of that environment would severely damage the U.S. aluminum extrusion industry and negatively impact many domestic manufacturers that rely on a healthy and competitive U.S. aluminum supply chain.
- We are getting busy, but mainly from projects that we normally produce at this time of year. Beyond these specialty-type jobs, overall business activity feels down from where it should be. Now with these gas prices, everything is costing more, forcing us to raise wages and therefore raise prices. It's all going to put pressure on the Fed to keep rates at a reasonable level.
Historical Data
Historical data can be downloaded dating back to June 2004.
Indexes
Download indexes for all indicators. For the definitions of all variables, see Data Definitions.
| Unadjusted |
| Seasonally adjusted |
All Data
Download indexes and components of the indexes (percentage of respondents reporting increase, decrease, or no change). For the definitions of all variables, see Data Definitions.
| Unadjusted |
| Seasonally adjusted |
Special questions
For this month’s survey, Texas business executives were asked supplemental questions on artificial intelligence (AI). Results below include responses from participants from both the Texas Manufacturing Outlook Survey and Texas Service Sector Outlook Survey. View individual survey results.
Questions regarding the Texas Business Outlook Surveys can be addressed to Jesus Cañas.
Sign up for our email alert to be automatically notified as soon as the latest Texas Manufacturing Outlook Survey is released on the web.