Texas Manufacturing Outlook Survey


Growth continues in Texas manufacturing sector as outlooks improve
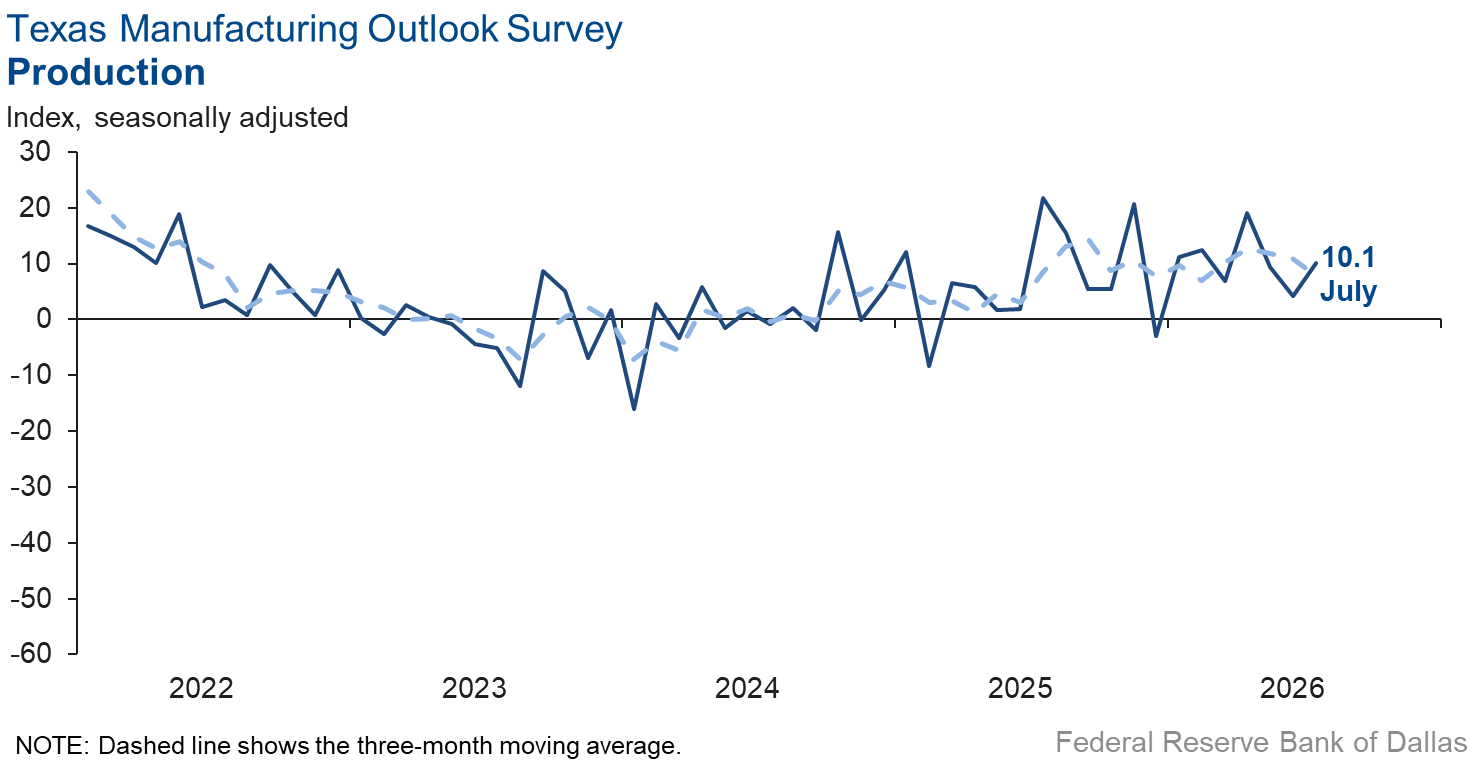
Texas manufacturing output growth accelerated in July, according to business executives responding to the Texas Manufacturing Outlook Survey. The production index, a key measure of state manufacturing conditions, increased six points to 10.1.
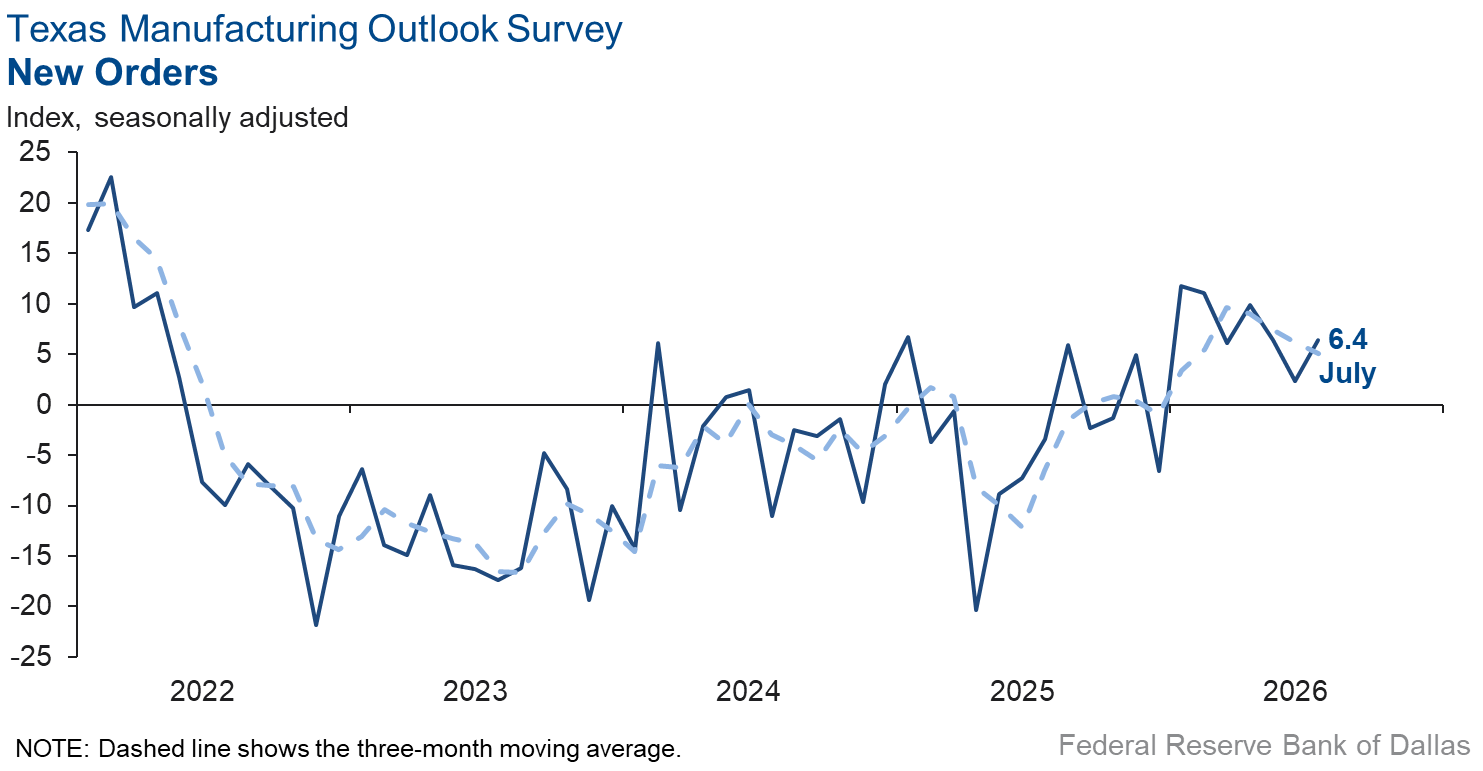
Other measures of manufacturing activity also showed solid growth. The capacity utilization index and the shipments index were relatively unchanged at 5.9 and 8.8, respectively. The new orders index increased to 6.4 from 2.3.
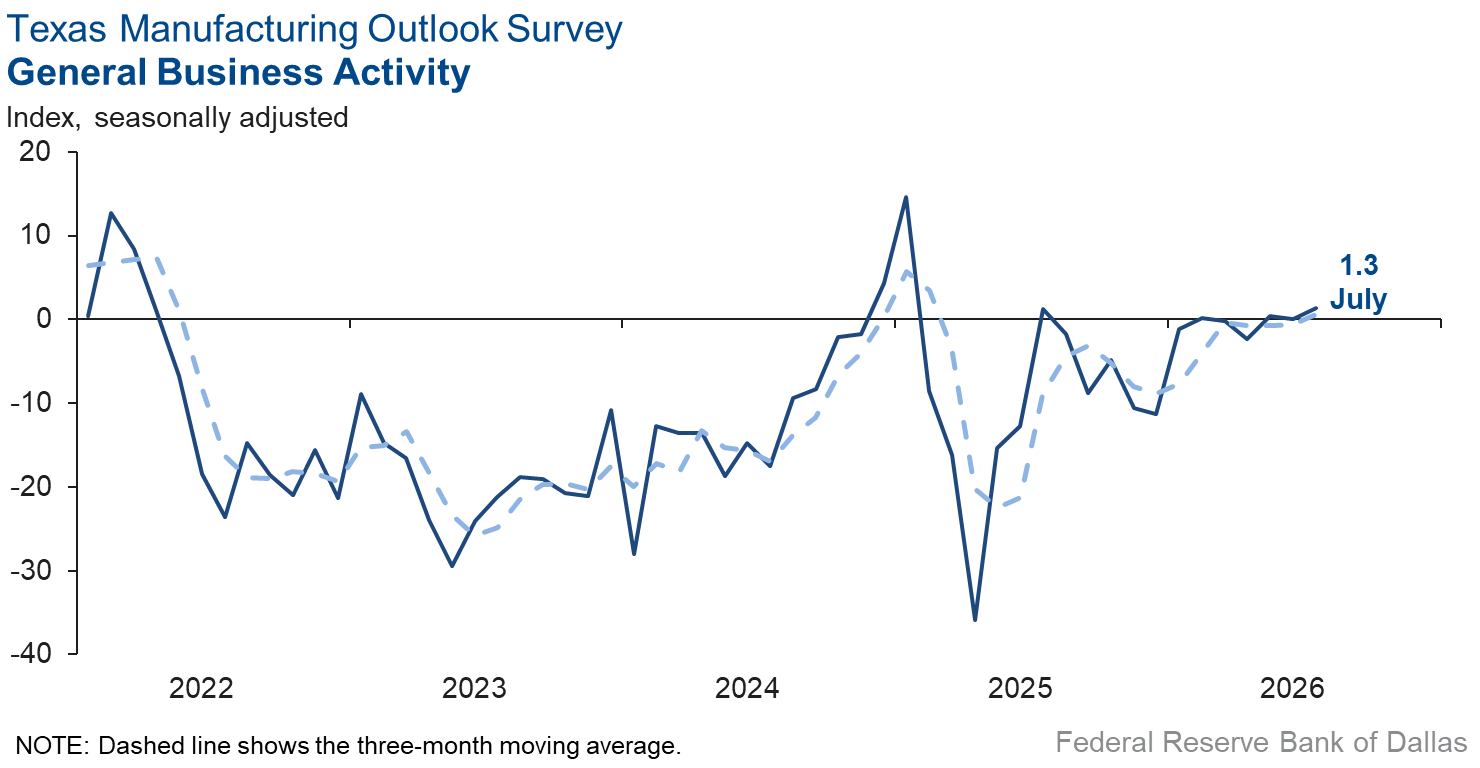
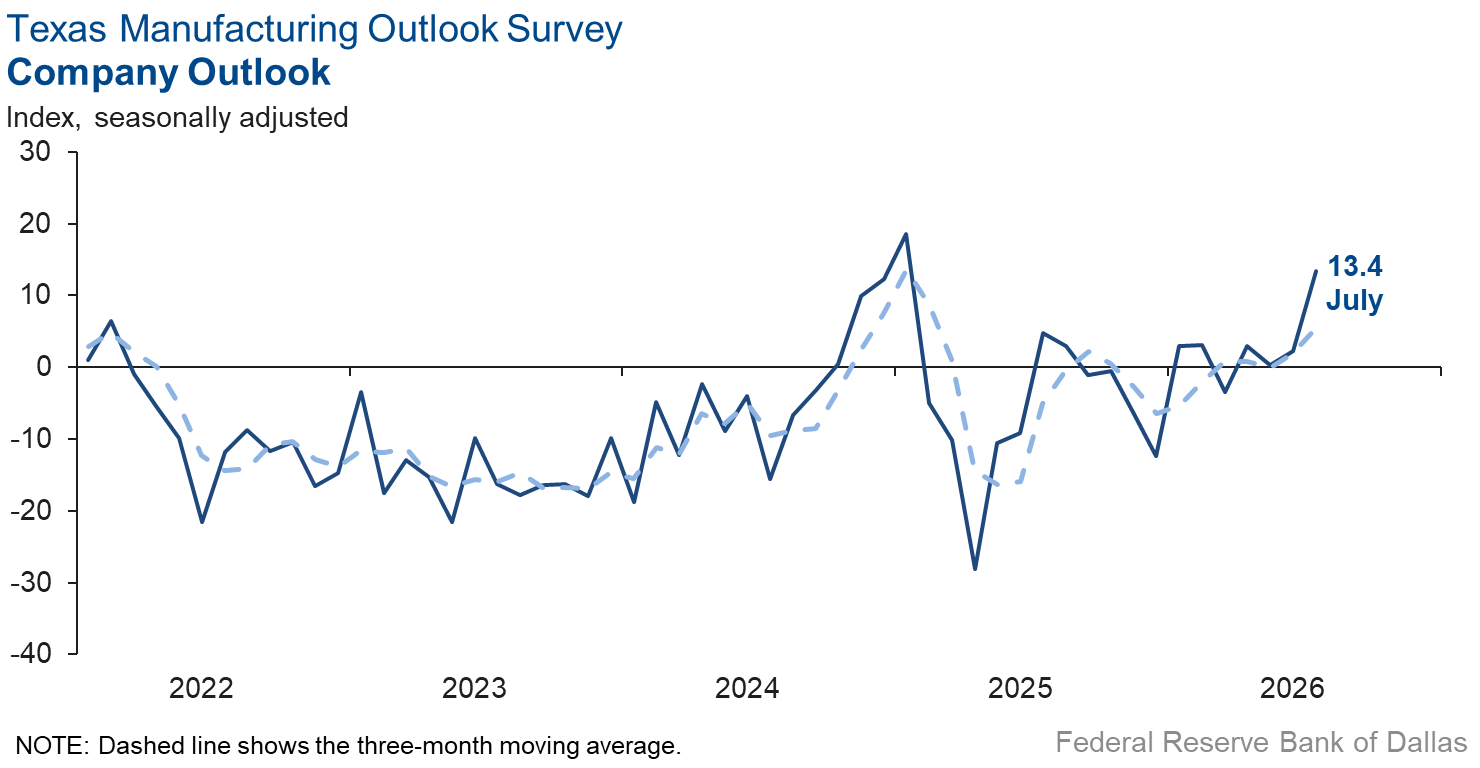
Perceptions of broader business conditions improved in July. While the general business activity index was little changed at 1.3, the company outlook index jumped 11 points to 13.4, signaling a notable improvement in outlooks. The outlook uncertainty index fell five points to 6.4.
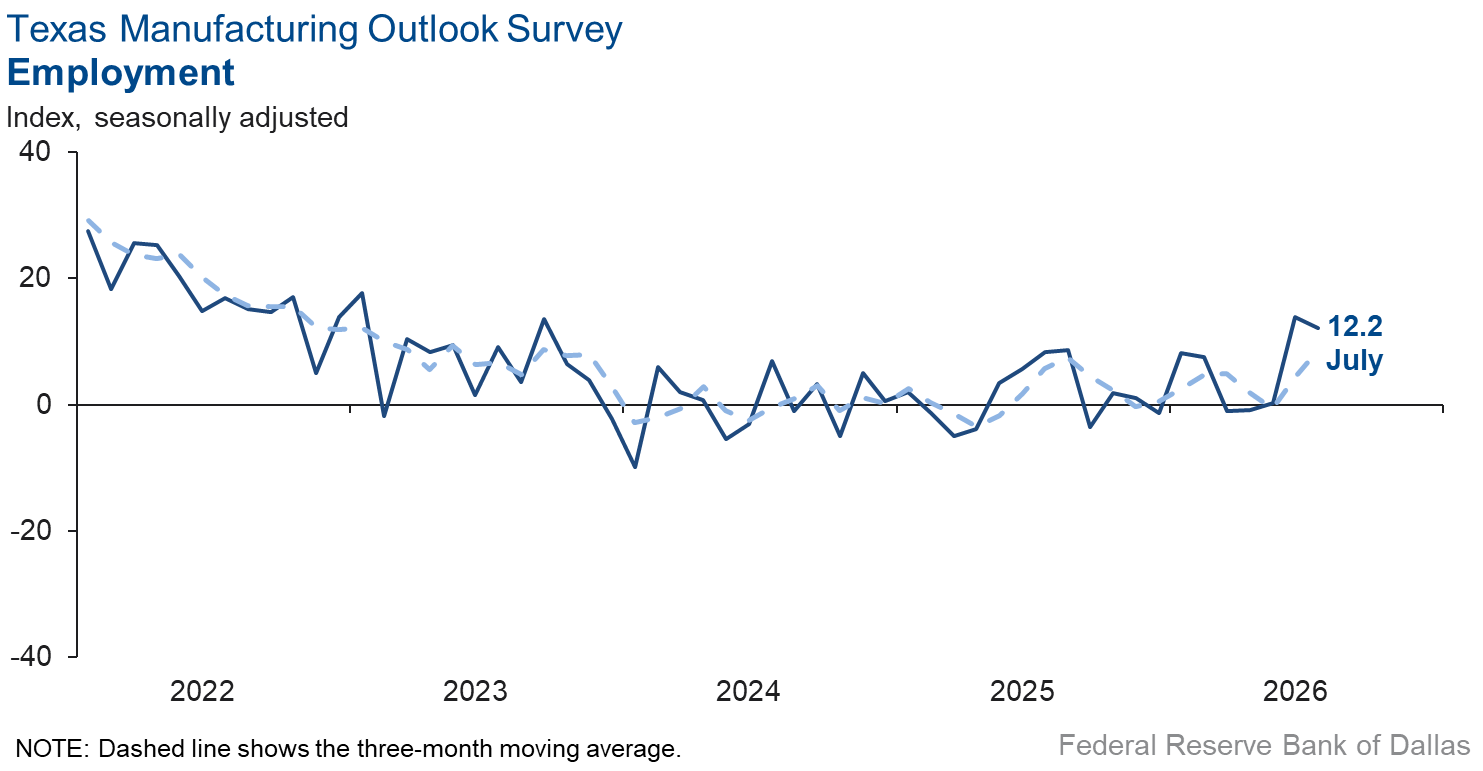
Employment growth and work hours were relatively stable in July. The employment index dipped two points to 12.2, remaining above its series average. The hours worked index edged down to 4.3 from 5.9.
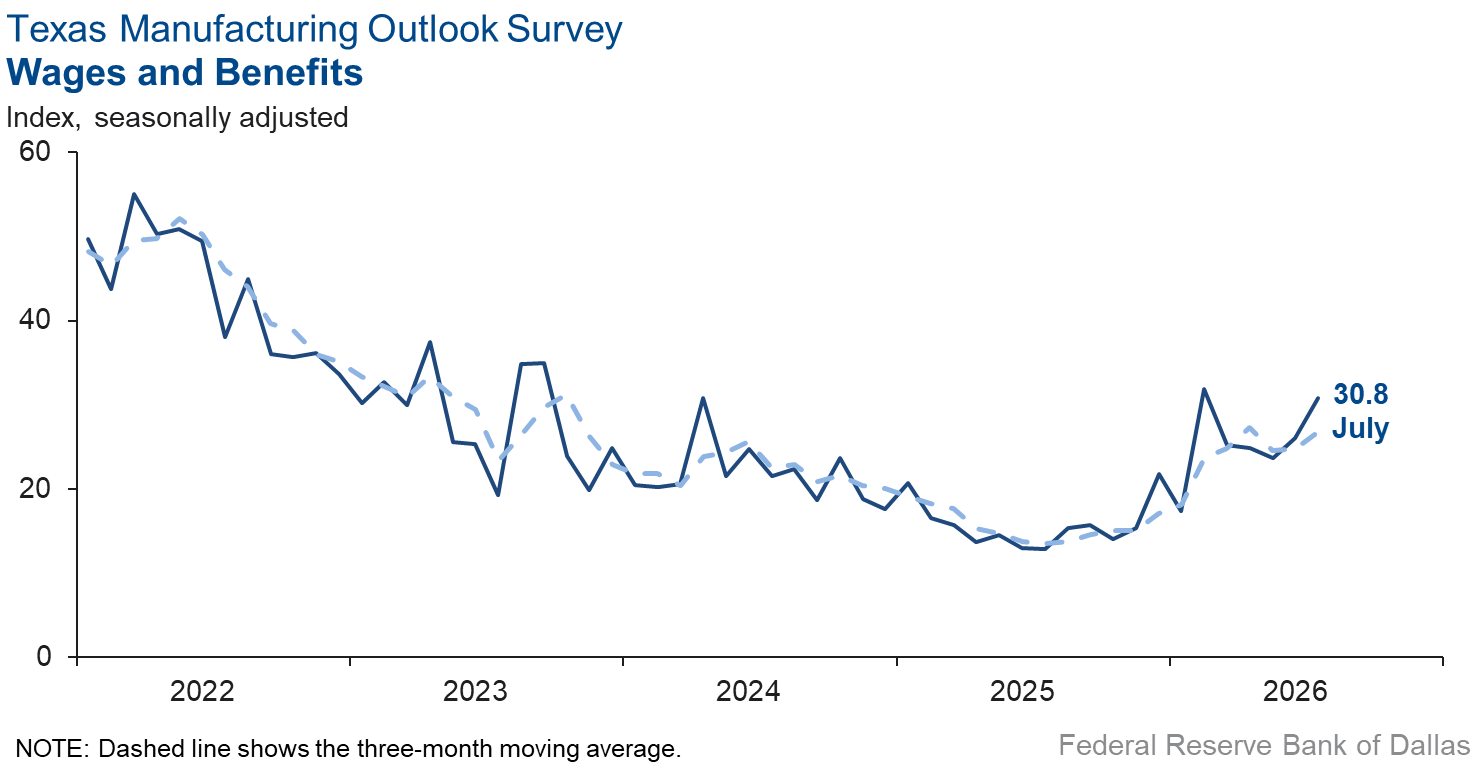
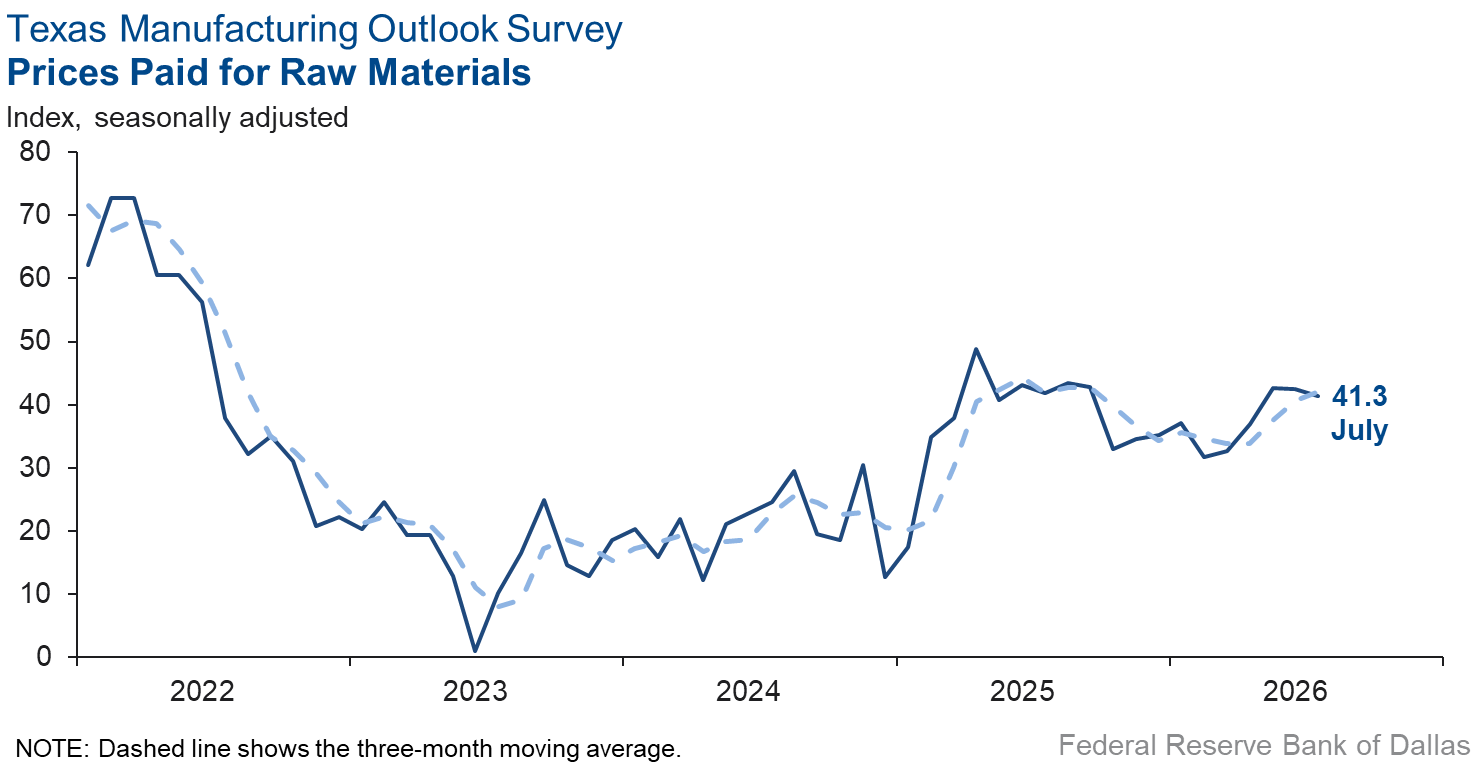
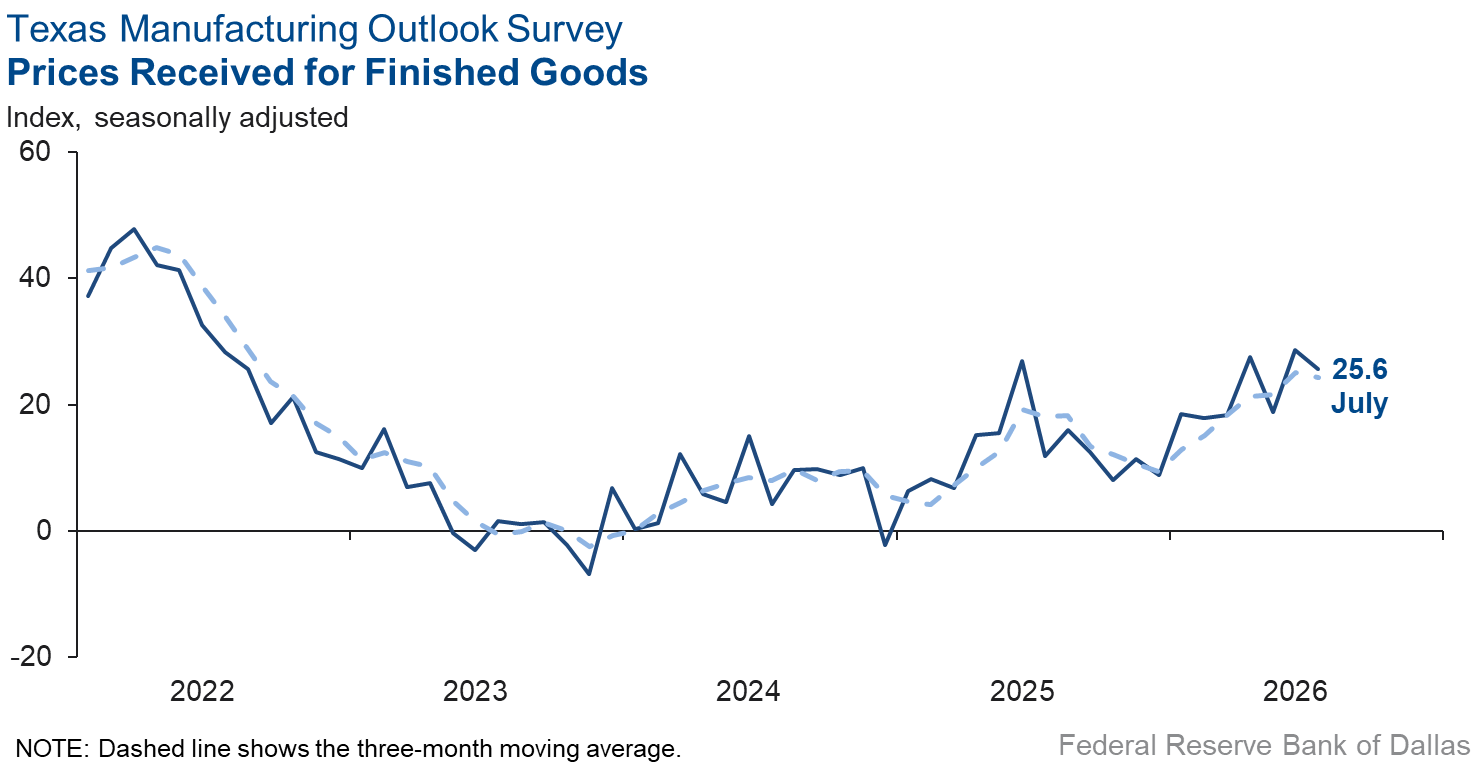
Price and wage pressures remained markedly elevated, though the indexes showed mixed movements in July. The finished goods prices index fell three points to 25.6. The raw materials prices index was relatively unchanged at 41.3. The wages and benefits index ticked up five points to 30.8.
Expectations are for increased manufacturing activity six months from now. The future production index and the future general business activity index remained unchanged at 34.6 and 26.5, respectively. Other indexes of future manufacturing activity remained in positive territory.
Next release: Monday, August 31
Data were collected July 14–22, and 64 of the 110 Texas manufacturers surveyed submitted responses. The Dallas Fed conducts the Texas Manufacturing Outlook Survey monthly to obtain a timely assessment of the state’s factory activity. Firms are asked whether output, employment, orders, prices and other indicators increased, decreased or remained unchanged over the previous month.
Survey responses are used to calculate an index for each indicator. Each index is calculated by subtracting the percentage of respondents reporting a decrease from the percentage reporting an increase. When the share of firms reporting an increase exceeds the share reporting a decrease, the index will be greater than zero, suggesting the indicator has increased over the prior month. If the share of firms reporting a decrease exceeds the share reporting an increase, the index will be below zero, suggesting the indicator has decreased over the prior month. An index will be zero when the number of firms reporting an increase is equal to the number of firms reporting a decrease. Data have been seasonally adjusted as necessary.
Results summary
Historical data are available from June 2004 to the most current release month.
| Business Indicators Relating to Facilities and Products in Texas Current (versus previous month) | ||||||||
| Indicator | Jul Index | Jun Index | Change | Series Average | Trend* | % Reporting Increase | % Reporting No Change | % Reporting Decrease |
Production | 10.1 | 4.1 | +6.0 | 9.6 | 7(+) | 33.9 | 42.3 | 23.8 |
Capacity Utilization | 5.9 | 7.3 | –1.4 | 7.5 | 7(+) | 28.6 | 48.7 | 22.7 |
New Orders | 6.4 | 2.3 | +4.1 | 4.7 | 7(+) | 28.6 | 49.1 | 22.2 |
Growth Rate of Orders | –0.4 | –2.0 | +1.6 | –1.1 | 3(–) | 19.0 | 61.6 | 19.4 |
Unfilled Orders | –2.0 | –2.8 | +0.8 | –2.7 | 2(–) | 13.4 | 71.2 | 15.4 |
Shipments | 8.8 | 7.1 | +1.7 | 7.8 | 7(+) | 31.8 | 45.2 | 23.0 |
Delivery Time | 2.3 | 0.9 | +1.4 | 0.5 | 3(+) | 15.0 | 72.3 | 12.7 |
Finished Goods Inventories | 1.5 | 7.8 | –6.3 | –3.3 | 2(+) | 19.0 | 63.5 | 17.5 |
Prices Paid for Raw Materials | 41.3 | 42.4 | –1.1 | 27.9 | 75(+) | 44.4 | 52.5 | 3.1 |
Prices Received for Finished Goods | 25.6 | 28.6 | –3.0 | 9.1 | 19(+) | 30.0 | 65.6 | 4.4 |
Wages and Benefits | 30.8 | 26.0 | +4.8 | 21.1 | 75(+) | 32.6 | 65.6 | 1.8 |
Employment | 12.2 | 13.9 | –1.7 | 7.1 | 3(+) | 19.0 | 74.2 | 6.8 |
Hours Worked | 4.3 | 5.9 | –1.6 | 3.0 | 7(+) | 14.2 | 75.9 | 9.9 |
Capital Expenditures | 12.2 | 11.4 | +0.8 | 6.6 | 5(+) | 20.0 | 72.2 | 7.8 |
| General Business Conditions Current (versus previous month) | ||||||||
| Indicator | Jul Index | Jun Index | Change | Series Average | Trend** | % Reporting Improved | % Reporting No Change | % Reporting Worsened |
Company Outlook | 13.4 | 2.3 | +11.1 | 4.1 | 4(+) | 27.0 | 59.4 | 13.6 |
General Business Activity | 1.3 | 0.0 | +1.3 | 0.2 | 1(+) | 20.5 | 60.3 | 19.2 |
| Indicator | Jul Index | Jun Index | Change | Series Average | Trend* | % Reporting Increase | % Reporting No Change | % Reporting Decrease |
Outlook Uncertainty | 6.4 | 10.9 | –4.5 | 16.7 | 7(+) | 17.5 | 71.4 | 11.1 |
| Business Indicators Relating to Facilities and Products in Texas Future (six months ahead) | ||||||||
| Indicator | Jul Index | Jun Index | Change | Series Average | Trend* | % Reporting Increase | % Reporting No Change | % Reporting Decrease |
Production | 34.6 | 34.8 | –0.2 | 36.0 | 75(+) | 47.2 | 40.2 | 12.6 |
Capacity Utilization | 29.7 | 33.8 | –4.1 | 32.8 | 75(+) | 42.6 | 44.5 | 12.9 |
New Orders | 29.2 | 35.5 | –6.3 | 33.4 | 45(+) | 41.0 | 47.2 | 11.8 |
Growth Rate of Orders | 24.6 | 28.3 | –3.7 | 24.6 | 35(+) | 35.6 | 53.4 | 11.0 |
Unfilled Orders | 11.7 | 3.4 | +8.3 | 2.7 | 2(+) | 19.6 | 72.5 | 7.9 |
Shipments | 30.3 | 35.1 | –4.8 | 34.3 | 75(+) | 42.0 | 46.3 | 11.7 |
Delivery Time | 2.3 | 5.5 | –3.2 | –1.3 | 3(+) | 14.4 | 73.5 | 12.1 |
Finished Goods Inventories | –1.7 | –8.1 | +6.4 | –0.2 | 3(–) | 13.1 | 72.1 | 14.8 |
Prices Paid for Raw Materials | 45.5 | 32.0 | +13.5 | 34.1 | 76(+) | 51.3 | 42.9 | 5.8 |
Prices Received for Finished Goods | 34.4 | 27.5 | +6.9 | 21.8 | 75(+) | 41.0 | 52.5 | 6.6 |
Wages and Benefits | 40.8 | 45.8 | –5.0 | 39.0 | 266(+) | 45.2 | 50.4 | 4.4 |
Employment | 20.1 | 25.4 | –5.3 | 22.7 | 74(+) | 36.0 | 48.1 | 15.9 |
Hours Worked | 4.8 | 10.8 | –6.0 | 8.5 | 5(+) | 12.0 | 80.8 | 7.2 |
Capital Expenditures | 25.9 | 27.0 | –1.1 | 19.4 | 74(+) | 35.4 | 55.1 | 9.5 |
| General Business Conditions Future (six months ahead) | ||||||||
| Indicator | Jul Index | Jun Index | Change | Series Average | Trend** | % Reporting Increase | % Reporting No Change | % Reporting Worsened |
Company Outlook | 28.7 | 28.5 | +0.2 | 18.3 | 15(+) | 42.5 | 43.8 | 13.8 |
General Business Activity | 26.5 | 25.9 | +0.6 | 12.4 | 15(+) | 38.4 | 49.7 | 11.9 |
*Shown is the number of consecutive months of expansion or contraction in the underlying indicator. Expansion is indicated by a positive index reading and denoted by a (+) in the table. Contraction is indicated by a negative index reading and denoted by a (–) in the table.
**Shown is the number of consecutive months of improvement or worsening in the underlying indicator. Improvement is indicated by a positive index reading and denoted by a (+) in the table. Worsening is indicated by a negative index reading and denoted by a (–) in the table.
Data have been seasonally adjusted as necessary.
Comments from survey respondents
Survey participants are given the opportunity to submit comments on current issues that may be affecting their businesses. Some comments have been edited for grammar and clarity.
- Increased gasoline prices create a burden on the consumer that we think can have a negative impact on spending on craft beer. We thought fuel prices were on the way down but now they are back up. This creates a certain amount of uncertainty going forward.
- Our projected production increases, employee headcount and business improvements are based on a verbal commitment that we will soon receive a large, new contract from a German customer.
- June was a very high month for us, but July is more normal. The war in Iran is impacting us in unexpected ways. Printed circuit board (PCB) pricing is unstable now because Iran attacked a facility in Saudi Arabia that produces a large amount of the global supply of a material used in the manufacturing process. We expected higher fuel costs to filter through but did not anticipate PCBs to be impacted in this way.
- We are in a holding pattern but we continue to service existing customers
- Lower demand is projected in the second half, but still strong.
- Geopolitical and national political uncertainty, combined with inflation, undermines consumer and business confidence. People and businesses are sitting on the sidelines.
- We will close our 1951-2026 business due to lack of demand.
- We are a coffee-based business, so summers are typically slower. But we are up on a year-over-year basis.
- We’re still getting steady orders while having to increase prices due to raw material cost escalation. Maybe someday everything will settle down and be more predictable.
- We see a very strong oil-based economy that will be with us for many years. We are losing competitors. Therefore, we are able to raise our prices but not increase our product costs. We’re investing in new machines that will increase our production but overall reduce our cost of manufacturing. However, we will not reduce our labor force, but productivity will increase substantially. We’ve been falling behind in maintaining our levels of finished products, but these new investments will solve those problems over the next six months.
- This is our third straight month of sales below average.
- The backlog is continuing to grow, and business is good in every respect for our operation.
- Customer concentration in the oil and gas industry is increasing buying power and forcing more competitive pricing and faster delivery.
- Older consumers are feeling the pressure of inflation.
- We are busy now because of large jobs we knew were coming, plus one large new project that has promise to become a very good ongoing job. Other than that, our customer base has become slow and anemic and now things are getting even more messed up overseas. It gives me plenty of reasons to be pessimistic going into the rest of this year.
- War is causing dramatic economic slowdown.
- Tariffs and the war continue to cause uncertainty and compress margins.
- We've seen an uptick in activity, orders and production. We also formalized and implemented our first price increase in 5 years to counter the rising product, wage and business costs. There was no pushback or negative feedback from customers—this was something they've experienced with other companies and understood.
- Too much noise in the economy and high interest rates make planning or taking risks difficult.
Historical Data
Historical data can be downloaded dating back to June 2004.
Indexes
Download indexes for all indicators. For the definitions of all variables, see Data Definitions.
| Unadjusted |
| Seasonally adjusted |
All Data
Download indexes and components of the indexes (percentage of respondents reporting increase, decrease, or no change). For the definitions of all variables, see Data Definitions.
| Unadjusted |
| Seasonally adjusted |
Special questions
For this month’s survey, Texas business executives were asked supplemental questions on labor market conditions. Results below include responses from participants from both the Texas Manufacturing Outlook Survey and Texas Service Sector Outlook Survey. View individual survey results.
Questions regarding the Texas Business Outlook Surveys can be addressed to Jesus Cañas.
Sign up for our email alert to be automatically notified as soon as the latest Texas Manufacturing Outlook Survey is released on the web.